

Abstract
Background:
Epidemics of seasonal influenza vary in intensity annually, and influenza vaccine effectiveness (VE) fluctuates based in part on antigenic match to circulating viruses. We estimated the incidence of influenza and influenza cases averted by vaccination in four ambulatory care sites in the United States, during seasons when overall influenza VE ranged from 29% to 40%.
Methods:
We conducted active surveillance for influenza at ambulatory care settings at four sites within the United States Influenza Vaccine Effectiveness Network. We extrapolated the total number of influenza cases in the source populations served by these organizations based on incidence of medically attended acute respiratory illness in the source population and influenza test results in those actively tested for influenza. We estimated the number of medically attended influenza cases averted based on incidence, vaccine coverage, and VE.
Results:
From 2016/17 through 2018/19, incidence of ambulatory visits for laboratory-confirmed influenza ranged from 31 to 51 per 1,000 population. Incidence was highest in children aged 9–17 years (range, 56 to 81 per 1,000) and lowest in adults aged 18–49 years (range, 23–32 per 1,000). Medically attended cases averted by vaccination ranged from a high of 46.6 (95% CI, 12.1– 91.9) per 1,000 vaccinees in children aged 6 months to 8 years, to a low of 6.9 (95% CI, −5.1– 27.3) per 1,000 vaccinees in adults aged ≥65 years.
Discussion:
Even in seasons with low vaccine effectiveness for a particular virus subtype, influenza vaccines can still lead to clinically meaningful reductions in ambulatory care visits for influenza.
Introduction
Influenza vaccination is the best available tool for reducing morbidity and mortality from seasonal influenza epidemics. Yearly influenza vaccination campaigns represent a multi-billion-dollar public health investment [1]. However, the impact of these vaccination campaigns on disease burden varies from year to year, depending, in part, on the circulating virus types/subtypes and the antigenic match between vaccine virus strains and circulating virus strains [2, 3]. This variability calls for ongoing evaluations of the effectiveness of influenza vaccines and their impact on reducing disease burden due to influenza.
Estimating the seasonal incidence of medically attended influenza can be challenging in the United States (US) where testing for influenza is inconsistent and varies across different medical systems and settings [4, 5]. From 2011/12 through 2020/21, the United States Influenza Vaccine Effectiveness (US Flu VE) Network conducted active surveillance for influenza in ambulatory care settings at five sites across the US. These data have been used to estimate influenza vaccine effectiveness (VE) each year [6–12]. With the advantage of systematic testing for influenza of all individuals presenting with acute respiratory illness, the Network has also estimated the burden of influenza in ambulatory care settings and the medically attended cases averted by vaccination from 2011/12 through 2015/16 [13, 14]. Here, we estimate the incidence of influenza and medically attended cases averted by vaccination for the 2016/17 through 2018/19 influenza seasons in the US Flu VE Network.
Methods
Details of the US Flu VE Network and methods for estimating the burden of influenza within the Network have been published previously [10, 13–16]. Data from four US Flu VE Network study sites were included in this analysis: Kaiser Permanente Washington in western Washington State (KPW); the Marshfield Clinic Health System in central Wisconsin (MC); Baylor Scott and White Health in Temple, Texas (BSW); and the University of Michigan and the Henry Ford healthcare systems in Ann Arbor and Detroit, Michigan (UM).
US Flu VE Network enrollees
Research staff at each study sites conduct active surveillance for patients with acute respiratory illness (ARI) including cough (reported by the participant) in ambulatory care settings. Eligible and consenting patients who present for care within 7 days of illness onset are enrolled in the US Flu VE Network study. Enrolled participants complete a brief interview and provide paired nasal and oropharyngeal swabs (nasal only in children aged <2 years) for influenza testing. Participants’ current season influenza vaccination status is determined by a combination of electronic health record (EHR) data, state immunization registries, employee health records, and plausible self-report, depending on each site’s ability access to each of these sources [8].
Real-time reverse transcriptase polymerase chain reaction (RT-PCR) was used to test swab specimens for influenza A and B, using probes and primers provided by the Centers for Disease Control and Prevention (CDC). Specimens testing positive for influenza were tested for influenza A subtype and B virus lineage. Influenza case-patients were those with a positive test for any influenza virus.
Source cohorts
The KPW source cohort consisted of KPW health plan members whose primary medical center was a US Flu VE enrollment site. The MC source cohort included persons with at least 12 months of residency (or since birth for those aged <12 months) in the Marshfield Epidemiologic Study Area (MESA), a 14 ZIP Code region centered around Marshfield, Wisconsin [17], as well as non-MESA residents who had at least 2 encounters at the main MC campus, affiliated hospital, or adjacent satellite clinics within the previous 3 years. MC captures at least 93% of all medical encounters from MESA residents [18]. In the 2018/19 season, the MC source cohort was expanded to include two additional areas in Central Wisconsin from which members were enrolled in the US Flu VE Network. The UM source cohort consisted of all patients aged 6 months and older who had at least 1 encounter at an outpatient primary care clinic in the University of Michigan or Henry Ford Health System in the previous 2 years starting from July 1st (e.g., for 2016/17, the 2-year period is July 1, 2015 – June 30, 2017). The BSW source cohort consisted of vaccine age-eligible patients who had received medical care from a BSW primary care health provider in Central Texas for any reason in the three years prior to annual influenza vaccinations beginning on September 1st each year.
Demographic data for source population cohorts were obtained from administrative healthcare databases. Subject age was defined as of September 1st of each season and grouped into five categories: 6 months to 8 years; 9 to 17 years; 18 to 49 years, 50 to 64 years; and 65 years or older. Receipt of current season’s influenza vaccine (after July 1 of each year) was defined from administrative databases, EHR data, and state immunization registries. Ambulatory care visits for presumptive ARI were identified based on International Classification of Diseases, Version 10 (ICD-10) codes (Supplemental Table).
Analysis
To estimate the cumulative incidence of influenza in ambulatory care settings, we extrapolated the influenza positivity rate from US Flu VE Network enrollees to ARI ambulatory care visits in each site’s full source cohorts. We first stratified the source cohorts into mutually exclusive groups based on study site (s), age (a), influenza vaccination status (v), and number of medically attended ARI (MAARI) visits during the prior year (m). We then assigned each US Flu VE Network enrollee a sampling weight. Within each (s, a, v, m) stratum, the sampling weight was the number of source cohort members in the stratum divided by the number of US Flu VE Network enrollees. US Flu VE Network enrollees with zero MAARI visits (i.e., who did not have a MAARI code assigned to their enrollment visit) were assigned a sampling weight of 1.0.
Using the sampling weights, we estimated how may influenza cases in the source population were represented by each Network enrollee, to give the total number of influenza cases in each (s, a, v, m) stratum. Confidence limits were calculated by bootstrapping from the source population and the Network enrollees. Using state-level surveillance data for each site, we upweighted the total case numbers based on the proportion of total yearly influenza cases that occurred during periods of US Flu VE Network enrollment to account for cases occurring outside of study recruitment.
Finally, for three influenza seasons, we estimated the number of ambulatory visits for influenza that were averted by vaccination across sites, as described previously [11, 12] (Supplemental Methods). Age-specific estimates of influenza VE were taken from the US Flu VE Network during 2016/17, 2017/18, and 2018/19. To calculate the percent of medically attended influenza cases averted by vaccination, we multiplied the estimated cases averted per 1000 vaccinees by the proportion of the population that was vaccinated and divided by the incidence per 1000 population [19]. Within each age-stratum and season, VE was assumed to be constant across study sites. All analyses were conducting using SAS version 9.4 (SAS Institute, Cary NC), and R version 4.0.0 (R Foundation for Statistical Computing, Vienna, Austria).
Results
All three influenza seasons were characterized by substantial circulation of influenza A(H3N2) viruses (Figure 1). The 2016/17 and 2017/18 seasons had minimal circulation of A(H1N1) viruses; both had early circulation of A(H3N2) viruses followed by later circulation of B viruses, predominantly B/Yamagata. The 2018/19 season had an early wave of A(H1N1) disease followed by a later wave of A(H3N2), with minimal circulation of influenza B viruses. Across the 2016/17 through 2018/19 seasons, the source populations ranged from 87,545 to 641,445 individuals across the four study sites (Table 1). Children aged 6 months to 17 years made up 19% of the source population, compared to 21% that were aged ≥65 years. Annual influenza vaccine coverage ranged from 35% to 38% across the three years and varied by age group (Figure 2). From these yearly source populations, between 1,187 and 2,772 subjects were enrolled annually in the US Flu VE Network across the sites. Compared to the source populations, the US Flu VE Network enrollees were more likely to be aged 6 months to 17 years (37%) and more likely to have been vaccinated (49% to 54% across seasons).
Figure 1:
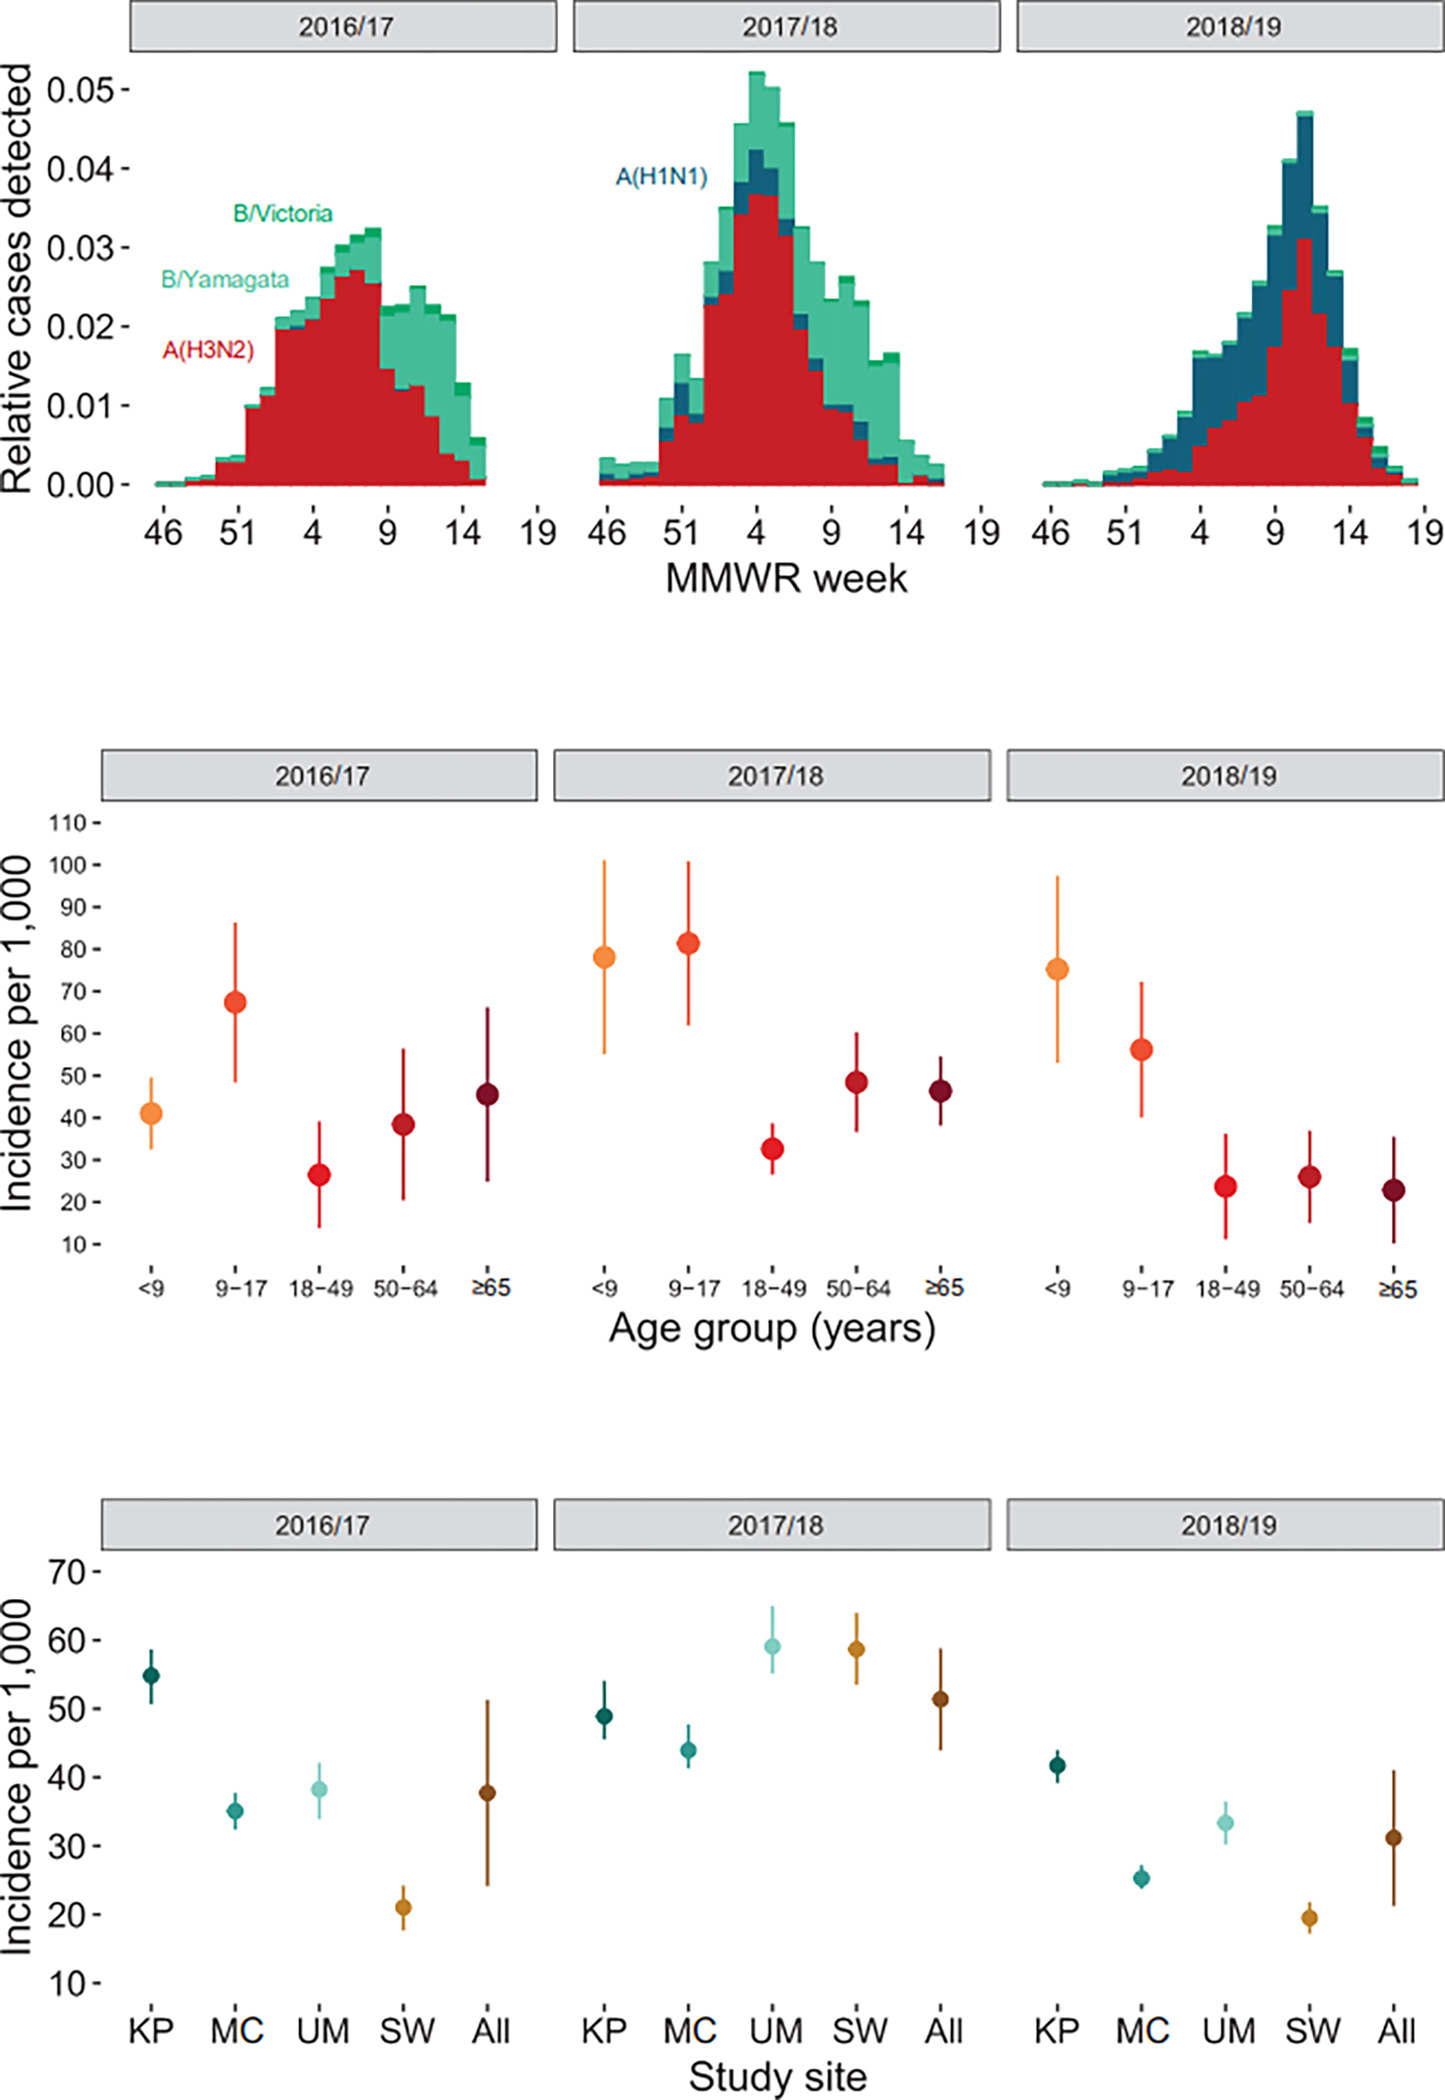
Influenza incidence by season. A) Distribution of influenza subtype/lineage relative to all cases by week among United States Influenza Vaccine Effectiveness enrollees; B) Cumulative incidence of ambulatory care visits for influenza by age group; C) Cumulative incidence of ambulatory care visits for influenza by study site
Panel A: Red = A(H3N2), Blue = A(H1N1)pdm09, Light Green = B/Yamagata, Dark Green = B/Victoria
Panel B: <9 includes persons aged 6 months – 8 years.
Panel C: KP, Kaiser Permanente Washington, Seattle, WA; MC, Marshfield Clinic Health System, Marshfield, WI; UM, University of Michigan and the Henry Ford healthcare systems, Ann Arbor and Detroit, MI; SW, Baylor Scott & White Health, Temple, TX
Table 1:
Characteristics of source populations and United States Influenza Vaccine Effectiveness enrollees
| Source population | US Flu VE Network enrollees | |||||
|---|---|---|---|---|---|---|
| Characteristic | 2016/17 | 2017/18 | 2018/19 | 2016/17 | 2017/18 | 2018/19 |
| Total population | 1,088,193 | 1,033,864 | 1,097,570 | 6,027 | 7,094 | 8,279 |
| Age group | ||||||
| 6 months–8 years | 66,033 (6%) | 64,758 (6%) | 95,341 (9%) | 1,007 (17%) | 1,190 (17%) | 1,849 (22%) |
| 9–17 years | 141,243 (13%) | 132,605 (13%) | 106,345 (10%) | 1,279 (21%) | 1,383 (19%) | 1,132 (14%) |
| 18–49 years | 416,155 (38%) | 391,742 (38%) | 423,346 (39%) | 1,797 (30%) | 2,256 (32%) | 2,623 (32%) |
| 50–64 years | 244,489 (22%) | 230,953 (22%) | 245,873 (22%) | 1,089 (18%) | 1,239 (17%) | 1,533 (19%) |
| ≥65 years | 220,273 (20%) | 213,806 (21%) | 226,665 (21%) | 855 (14%) | 1,026 (14%) | 1,142 (14%) |
| Study site | ||||||
| KP | 171,766 (19%) | 174,003 (20%) | 203,003 (22%) | 1,608 (35%) | 1,771 (34%) | 2,772 (43%) |
| MC | 88,703 (10%) | 87,545 (10%) | 135,117 (14%) | 1,844 (40%) | 2,019 (39%) | 1,957 (30%) |
| UM | 641,445 (71%) | 596,539 (70%) | 599,765 (64%) | 1,187 (26%) | 1,356 (26%) | 1,707 (27%) |
| SW | 186,279 (17%) | 175,777 (17%) | 159,685 (15%) | 1,388 (23%) | 1,948 (27%) | 1,843 (22%) |
| Vaccinated | 375,745 (35%) | 378,398 (37%) | 419,765 (38%) | 3,060 (51%) | 3,479 (49%) | 4,498 (54%) |
| MAARI visits | ||||||
| 0 | 956,293 (88%) | 898,435 (87%) | 978,061 (89%) | 727 (12%) | 696 (10%) | 888 (11%) |
| 1 | 99,660 (9%) | 100,617 (10%) | 89,589 (8%) | 2,608 (43%) | 2,948 (42%) | 3,707 (45%) |
| ≥2 | 30,852 (3%) | 32,864 (3%) | 28,077 (3%) | 1,304 (22%) | 1,502 (21%) | 1,841 (22%) |
SW, Baylor Scott & White Health, Temple, TX; KP, Kaiser Permanente Washington; MC, Marshfield Clinic Health System in central Wisconsin; UM, University of Michigan and the Henry Ford healthcare systems, Ann Arbor and Detroit, Michigan
Figure 2:
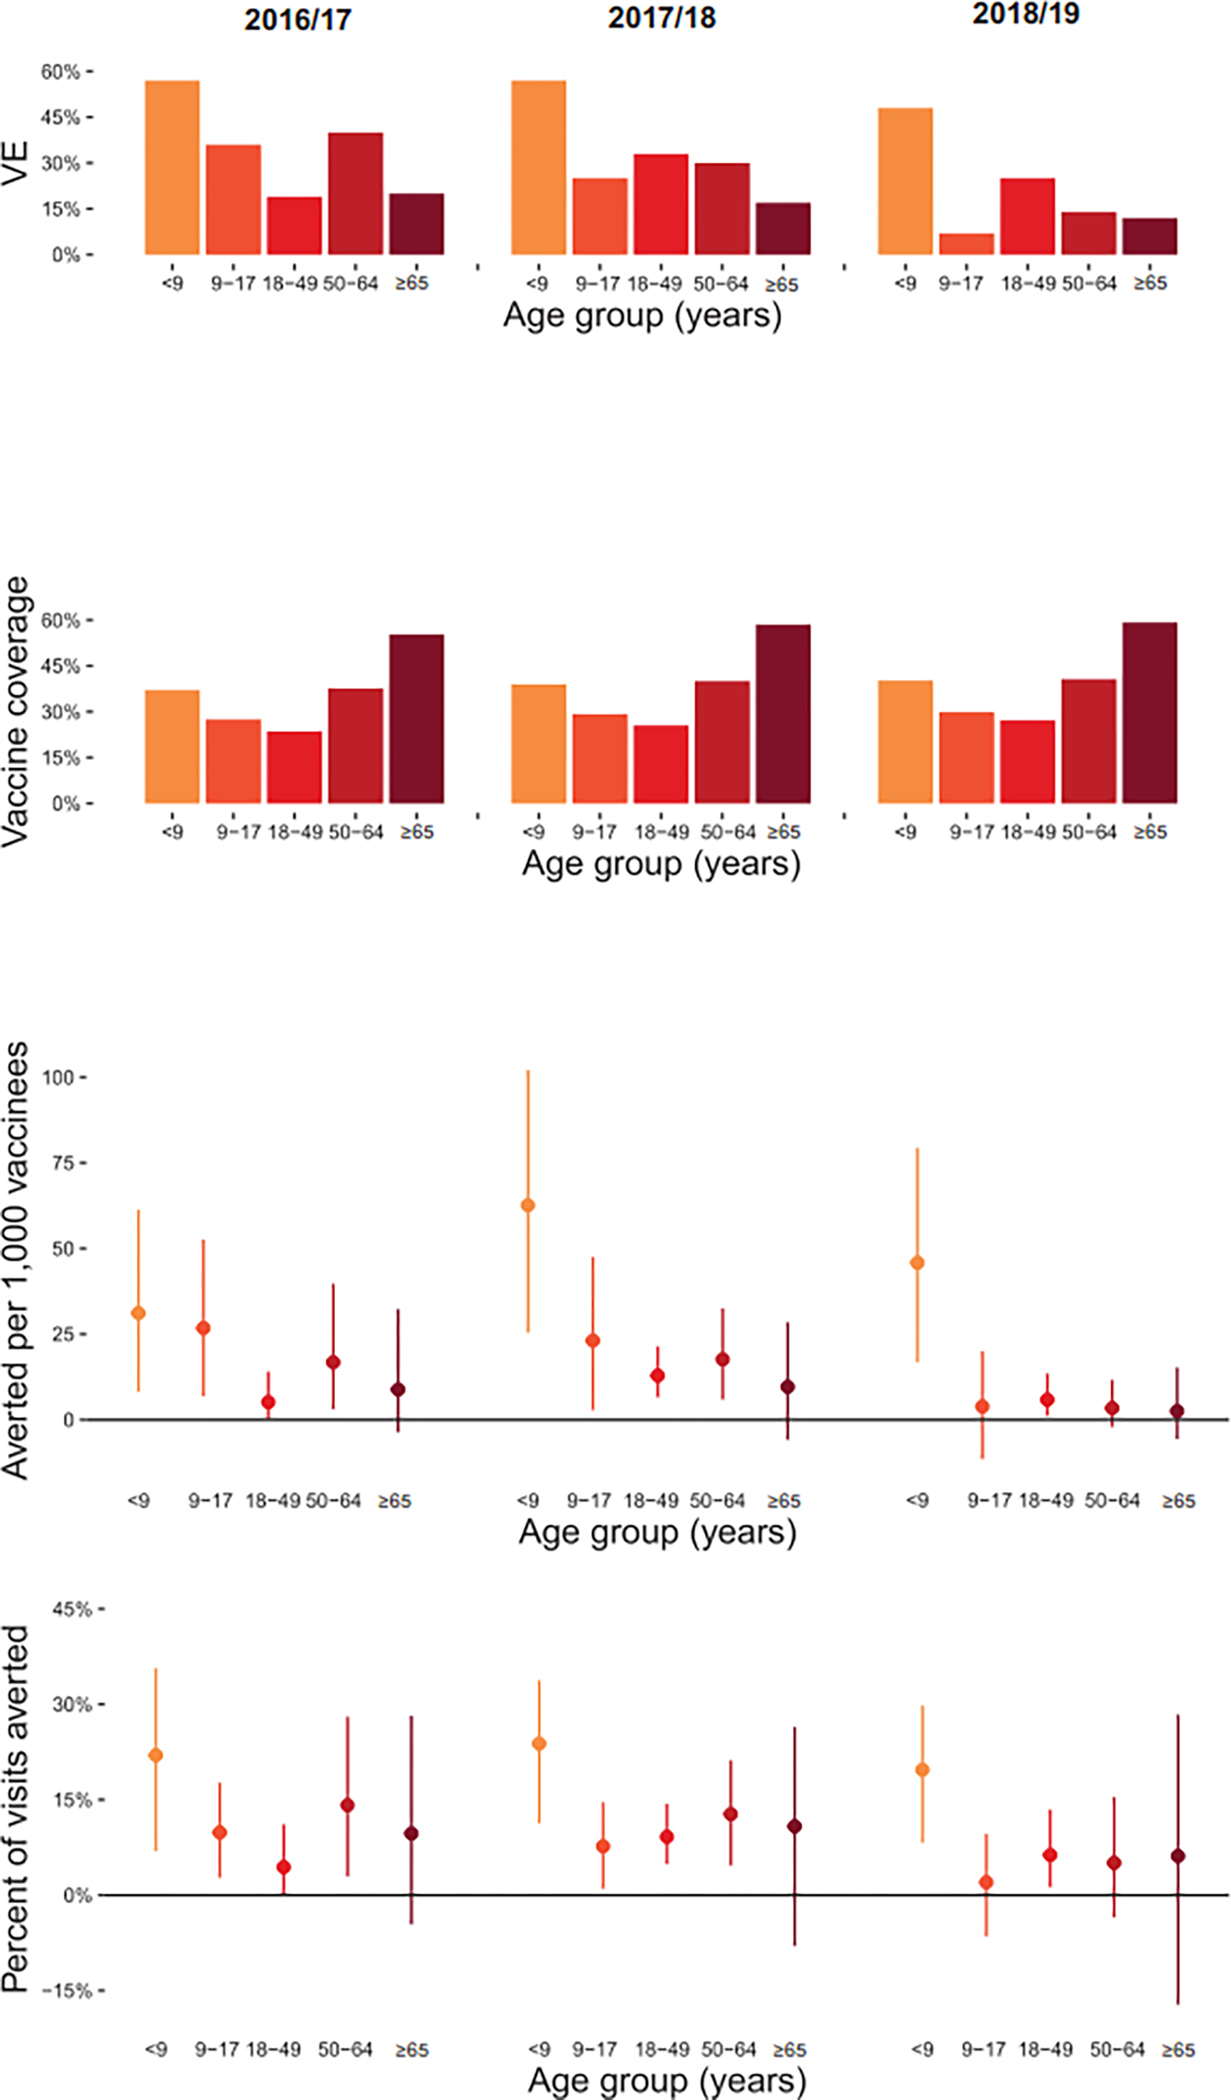
Vaccine impact by season (2016/17, 2017/18, 2018/19). A) Influenza vaccine effectiveness by age group; B) Influenza vaccine coverage by age group; C) Ambulatory care visits for influenza averted per 1,000 vaccinees by age group; D) Percent of influenza visits averted by age group
Panels A–D: <9 includes persons aged 6 months – 8 years.
The cumulative incidence of ambulatory care visits for influenza ranged from 19.4 (95% CI, 17.2 to 21.8) cases per 1,000 population in BSW during 2018/19, to 59.1 (95% CI, 55.1 to 65.0) per 1,000 in UM during 2017/18 (Figure 1). Averaging across study sites, incidence of medically attended influenza was generally higher among children than adults, but there was considerable heterogeneity in age-specific incidence from year to year (Figure 1). In 2016/17, incidence was lowest in adults aged 18–49 years and highest in children aged 9–17 years. In contrast, during 2018/19, incidence was lowest in seniors aged ≥65 years and highest in children aged 6 months to 8 years.
The number of medically attended influenza cases averted by vaccination ranged from 12.3 per 1,000 vaccinees (95% CI, −5.3 to 66.8) in 2018/19 to 25.2 per 1,000 vaccinees (95% CI, 0 to 85.1) in 2017/18. When stratified by age group, medically attended cases averted were consistently highest in children aged 6 months to 8 years due to higher VE than in other age groups (Figure 2). Averaged across three seasons, medically attended cases averted ranged from a high of 46.6 (95% CI, 12.1 to 91.9) per 1,000 vaccinees in children aged 6 months to 8 years, to a low of 6.9 (95% CI, −5.1 to 27.3) per 1,000 vaccinees in adults aged ≥65 years. Estimates of averted burden of medically attended influenza cases were not statistically significant in any of the three seasons among adults aged ≥65 years. The percent of ambulatory visits for influenza that were averted by vaccination ranged from 2.0% (among children aged 9 to 17 years in 2018/19) up to 23.8% (among children aged 6 months to 8 years in 2017/18).
Discussion
During three consecutive influenza seasons during which A(H3N2) viruses predominated, influenza vaccination substantially reduced medically attended disease burden in children while reductions in older age groups were modest. Previous studies in this population (covering the 2011/12 through 2015/16 influenza seasons [13, 14]) have found that the incidence of ambulatory care visits for influenza ranged from 0.7% (7 per 1,000) to 6.4% (64 per 1,000) across study sites and years. The observed incidence of influenza associated medical visits during each season in this study included fell within this range, confirming previous findings that 5% or more of the population might seek ambulatory medical care for influenza during a severe seasonal epidemic [20]. Over the three seasons when influenza resulted in an estimated 14–21 million medical visits annually [21], influenza vaccination reduced influenza-related medical visits by an average of 20% among children and 10% among adults in this population.
The 2018/19 influenza season was characterized by late circulation of A(H3N2) viruses belonging to genetic clade 3C.3a [22], while the vaccine A(H3N2) reference strain belonged to the antigenically distinct 3C.2a1 subclade. Thus, while VE in 2018/19 against A(H1N1) was 44% in this outpatient care-seeking population, overall average VE against any outpatient laboratory-confirmed influenza was only 29% owing to the lack of statistically significant VE against A(H3N2) clade 3C.3a viruses that season [22–24]. Despite the low overall VE that season, our study found that influenza vaccination was still associated with statistically significant reductions in the burden of influenza among young children and among adults aged 18–49 years, which could be due to protection against the earlier wave of A(H1N1) viruses. During the 2014/15 influenza season, when VE against antigenically mismatched A(H3N2) viruses was reduced, protection against B viruses resulted in significant reductions in medically attended disease burden [14]. A separate analysis of US influenza surveillance data from the 2018/19 influenza season reported that vaccination significantly reduced illnesses and hospitalizations associated with A(H1N1) that year [16].
In contrast to estimates from 2013/14 through 2015/16, we did not observe statistically significant reductions in medically attended influenza burden among seniors aged ≥65 years in any of the three seasons. Incidence of ambulatory visits for influenza tended to be higher during the present study period (31 to 51 cases per 1,000) compared with our prior study (19 to 43 per 1,000), so this difference was likely not due to a lower burden of influenza during 2016/17 to 2018/19. Instead, the difference is likely driven by generally low influenza VE among seniors during the study period, ranging from 12% to 20%, compared with 33% to 59% during 2013/14 to 2015/16 [8, 25, 26]. Influenza vaccines may have reduced the burden of more severe influenza among seniors during this time period, as VE against A(H3N2) hospitalizations may have exceeded VE against ambulatory care visits [27]. However, analysis of US surveillance data provided little evidence that influenza vaccination was associated with statistically significant reductions in influenza hospitalization or deaths among seniors during 2017/18 [15].
We note several limitations of the present study. First, the approach used in this study only accounts for the direct effects of influenza vaccination in protecting the vaccinated. If influenza vaccination has indirect effects on the unvaccinated through reduced transmission of influenza, those effects would not be captured by this analysis. Second, this study was conducted among four geographically disparate regions in the United States. Given that influenza dynamics can differ across regions in the United States [25], projections from these four study sites may not accurately measure the impact of influenza vaccination in the United States as a whole or by region. Third, our surveillance definition required acute respiratory illness with cough for study enrollment. While cough is a sensitive marker for influenza [28], we may have under-estimated the burden of medically attended influenza to the extent that influenza patients seek care for illness without a cough. Finally, our subjects were recruited primarily from insured populations, and our results may not generalize to uninsured populations.
Seasonal influenza remains an important cause of morbidity in the United States, and influenza vaccination is the best available tool for reducing the burden of influenza. Even in seasons when vaccine effectiveness is low against circulating strains, influenza vaccination can substantially reduce influenza-related medical visits and more severe outcomes not included in our analysis such as hospitalizations and deaths from complications of influenza [15, 16]. Improvements in influenza vaccines that result in more effective vaccines across the age spectrum have potential for greater reductions in seasonal influenza burden on the medical system.
Supplementary Material
Acknowledgements
We thank the following individuals for their contributions to this work: Caroline Cheng, Latifa Bazzi, Dr. Lois Lamerato, Shirley Zhang, Jeff Cowall, Robinson Seda, Lynn Holevinski, Dr. Joshua Petrie.
The US Influenza Vaccine Effectiveness Network was supported by the Centers for Disease Control and Prevention through cooperative agreements with the University of Michigan (U01IP001034), Kaiser Permanente Washington Health Research Institute (U01IP001037), Marshfield Clinic Research Institute (U01IP001038), and Baylor Scott and White Healthcare (U01IP001039).
Footnotes
Declaration of interests
The authors declare the following financial interests/personal relationships which may be considered as potential competing interests:
Dr. Gaglani reports relationships with Sanofi Pasteur Inc and Centers for Disease Control and Prevention that includes: funding grants. Dr. Lisa Jackson reports a relationship with Novavax Inc that includes: funding grants. Dr. Martin reports a relationship with Merck & Co Inc that includes: funding grants. Dr. Martin reports a relationship with Pfizer Inc that includes: consulting or advisory. Dr. McLean reports a relationship with Seqirus Inc. that includes: funding grants.
Publisher's Disclaimer: This is a PDF file of an unedited manuscript that has been accepted for publication. As a service to our customers we are providing this early version of the manuscript. The manuscript will undergo copyediting, typesetting, and review of the resulting proof before it is published in its final form. Please note that during the production process errors may be discovered which could affect the content, and all legal disclaimers that apply to the journal pertain.
References
- [1].Carias C, Reed C, Kim IK, Foppa IM, Biggerstaff M, Meltzer MI, et al. Net Costs Due to Seasonal Influenza Vaccination--United States, 2005–2009. PLoS One. 2015;10:e0132922. [DOI] [PMC free article] [PubMed] [Google Scholar]
- [2].Foppa IM, Cheng PY, Reynolds SB, Shay DK, Carias C, Bresee JS, et al. Deaths averted by influenza vaccination in the U.S. during the seasons 2005/06 through 2013/14. Vaccine. 2015;33:3003–9. [DOI] [PMC free article] [PubMed] [Google Scholar]
- [3].Kostova D, Reed C, Finelli L, Cheng PY, Gargiullo PM, Shay DK, et al. Influenza Illness and Hospitalizations Averted by Influenza Vaccination in the United States, 2005–2011. PLoS One. 2013;8:e66312. [DOI] [PMC free article] [PubMed] [Google Scholar]
- [4].Rolfes MA, Yousey-Hindes KM, Meek JI, Fry AM, Chaves SS. Respiratory Viral Testing and Influenza Antiviral Prescriptions During Hospitalization for Acute Respiratory Illnesses. Open Forum Infect Dis. 2016;3:ofv216. [DOI] [PMC free article] [PubMed] [Google Scholar]
- [5].Tenforde MW, Campbell AP, Michaels MG, Harrison CJ, Klein EJ, Englund JA, et al. Clinical Influenza Testing Practices in Hospitalized Children at United States Medical Centers, 2015–2018. J Pediatric Infect Dis Soc. 2022;11:5–8. [DOI] [PMC free article] [PubMed] [Google Scholar]
- [6].Ohmit SE, Thompson MG, Petrie JG, Thaker SN, Jackson ML, Belongia EA, et al. Influenza vaccine effectiveness in the 2011–2012 season: protection against each circulating virus and the effect of prior vaccination on estimates. Clinical infectious diseases : an official publication of the Infectious Diseases Society of America. 2014;58:319–27. [DOI] [PMC free article] [PubMed] [Google Scholar]
- [7].McLean HQ, Thompson MG, Sundaram ME, Kieke BA, Gaglani M, Murthy K, et al. Influenza vaccine effectiveness in the United States during 2012–2013: variable protection by age and virus type. J Infect Dis. 2015;211:1529–40. [DOI] [PMC free article] [PubMed] [Google Scholar]
- [8].Gaglani M, Pruszynski J, Murthy K, Clipper L, Robertson A, Reis M, et al. Influenza Vaccine Effectiveness Against 2009 Pandemic Influenza A(H1N1) Virus Differed by Vaccine Type During 2013–2014 in the United States. J Infect Dis. 2016;213:1546–56. [DOI] [PMC free article] [PubMed] [Google Scholar]
- [9].Zimmerman RK, Nowalk MP, Chung J, Jackson ML, Jackson LA, Petrie JG, et al. 2014–2015 Influenza Vaccine Effectiveness in the United States by Vaccine Type. Clinical infectious diseases : an official publication of the Infectious Diseases Society of America. 2016;63:1564–73. [DOI] [PMC free article] [PubMed] [Google Scholar]
- [10].Flannery B, Chung JR, Monto AS, Martin ET, Belongia EA, McLean HQ, et al. Influenza Vaccine Effectiveness in the United States During the 2016–2017 Season. Clinical infectious diseases : an official publication of the Infectious Diseases Society of America. 2019;68:1798–806. [DOI] [PMC free article] [PubMed] [Google Scholar]
- [11].Rolfes MA, Flannery B, Chung J, O’Halloran A, Garg S, Belongia EA, et al. Effects of Influenza Vaccination in the United States during the 2017–2018 Influenza Season. Clin Infect Dis. 2019. [DOI] [PMC free article] [PubMed] [Google Scholar]
- [12].Chung JR, Rolfes MA, Flannery B, Prasad P, O’Halloran A, Garg S, et al. Effects of Influenza Vaccination in the United States During the 2018–2019 Influenza Season. Clin Infect Dis. 2020;71:e368–e76. [DOI] [PMC free article] [PubMed] [Google Scholar]
- [13].Jackson ML, Jackson LA, Kieke B, McClure D, Gaglani M, Murthy K, et al. Incidence of medically attended influenza infection and cases averted by vaccination, 2011/2012 and 2012/2013 influenza seasons. Vaccine. 2015;33:5181–7. [DOI] [PMC free article] [PubMed] [Google Scholar]
- [14].Jackson ML, Phillips CH, Benoit J, Jackson LA, Gaglani M, Murthy K, et al. Burden of medically attended influenza infection and cases averted by vaccination - United States, 2013/14 through 2015/16 influenza seasons. Vaccine. 2018;36:467–72. [DOI] [PMC free article] [PubMed] [Google Scholar]
- [15].Rolfes MA, Flannery B, Chung JR, O’Halloran A, Garg S, Belongia EA, et al. Effects of Influenza Vaccination in the United States During the 2017–2018 Influenza Season. Clinical infectious diseases : an official publication of the Infectious Diseases Society of America. 2019;69:1845–53. [DOI] [PMC free article] [PubMed] [Google Scholar]
- [16].Chung JR, Rolfes MA, Flannery B, Prasad P, O’Halloran A, Garg S, et al. Effects of Influenza Vaccination in the United States During the 2018–2019 Influenza Season. Clinical infectious diseases : an official publication of the Infectious Diseases Society of America. 2020;71:e368–e76. [DOI] [PMC free article] [PubMed] [Google Scholar]
- [17].DeStefano F, Eaker ED, Broste SK, Nordstrom DL, Peissig PL, Vierkant RA, et al. Epidemiologic research in an integrated regional medical care system: the Marshfield Epidemiologic Study Area. J Clin Epidemiol. 1996;49:643–52. [DOI] [PubMed] [Google Scholar]
- [18].Kieke AL, Kieke BA Jr., Kopitzke SL, McClure DL, Belongia EA, VanWormer JJ, et al. Validation of Health Event Capture in the Marshfield Epidemiologic Study Area. Clin Med Res. 2015;13:103–11. [DOI] [PMC free article] [PubMed] [Google Scholar]
- [19].Jackson MLJ, A. L//Kieke B//McClure D//Gaglani M//Murthy K//Malosh R//Monto A//Zimmerman RK//Foppa IM//Flannery B//Thompson MG Incidence of medically attended influenza infection and cases averted by vaccination, 2011/2012 and 2012/2013 influenza seasons. Vaccine. 2015;33:5181–7. [DOI] [PMC free article] [PubMed] [Google Scholar]
- [20].Jackson MLP, H. C//Benoit J//Jackson LA//Gaglani M//Murthy K//McLean HQ//Belongia EA//Malosh R//Zimmerman R//Flannery B Burden of medically attended influenza infection and cases averted by vaccination - United States, 2013/14 through 2015/16 influenza seasons. Vaccine. 2018;36:467–72. [DOI] [PMC free article] [PubMed] [Google Scholar]
- [21].Centers for Disease Control and Prevention. Past Seasons Estimated Influenza Disease Burden. 2020.
- [22].Flannery B, Kondor RJG, Chung JR, Gaglani M, Reis M, Zimmerman RK, et al. Spread of Antigenically Drifted Influenza A(H3N2) Viruses and Vaccine Effectiveness in the United States During the 2018–2019 Season. J Infect Dis. 2020;221:8–15. [DOI] [PMC free article] [PubMed] [Google Scholar]
- [23].Bellino S, Bella A, Puzelli S, Di Martino A, Facchini M, Punzo O, et al. Moderate influenza vaccine effectiveness against A(H1N1)pdm09 virus, and low effectiveness against A(H3N2) subtype, 2018/19 season in Italy. Expert Rev Vaccines. 2019;18:1201–9. [DOI] [PubMed] [Google Scholar]
- [24].Kissling E, Pozo F, Buda S, Vilcu AM, Gherasim A, Brytting M, et al. Low 2018/19 vaccine effectiveness against influenza A(H3N2) among 15–64-year-olds in Europe: exploration by birth cohort. Euro Surveillance: Bulletin Europeen sur les Maladies Transmissibles = European Communicable Disease Bulletin. 2019;24. [DOI] [PMC free article] [PubMed] [Google Scholar]
- [25].Zimmerman RK, Nowalk MP, Chung J, Jackson ML, Jackson LA, Petrie JG, et al. 2014–2015 Influenza Vaccine Effectiveness in the United States by Vaccine Type. Clinical Infectious Diseases. 2016;63:1564–73. [DOI] [PMC free article] [PubMed] [Google Scholar]
- [26].Jackson ML, Chung JR, Jackson LA, Phillips CH, Benoit J, Monto AS, et al. Influenza Vaccine Effectiveness in the United States during the 2015–2016 Season. The New England journal of medicine. 2017;377:534–43. [DOI] [PMC free article] [PubMed] [Google Scholar]
- [27].Tenforde MW, Chung J, Smith ER, Talbot HK, Trabue CH, Zimmerman RK, et al. Influenza Vaccine Effectiveness in Inpatient and Outpatient Settings in the United States, 2015–2018. Clinical infectious diseases : an official publication of the Infectious Diseases Society of America. 2021;73:386–92. [DOI] [PMC free article] [PubMed] [Google Scholar]
- [28].Ebell MH, Afonso A. A systematic review of clinical decision rules for the diagnosis of influenza. Ann Fam Med. 2011;9:69–77. [DOI] [PMC free article] [PubMed] [Google Scholar]
Associated Data
This section collects any data citations, data availability statements, or supplementary materials included in this article.