

Abstract
To identify the prevalence of and disparities in past-year exposure to deadly gun violence near adolescents’ homes and schools, we linked national data on deadly gun violence incidents from the Gun Violence Archive to the age-fifteen wave of the Fragile Families and Child Wellbeing Study, a cohort of children born during 1998–2000 in large US cities. We found that 21 percent of adolescents in this cohort resided or attended school within 500 meters of a prior-year deadly gun violence incident during 2014–17. Rates of exposure were higher for Black and Hispanic adolescents than for White adolescents and higher for poor and near-poor adolescents than middle-to-high-income adolescents. Middle-to-high-income Black and Hispanic adolescents were more likely to be exposed to violence near home or school than poorer White adolescents. Because exposure to violence is detrimental to health, policies that reduce gun violence could improve population health disparities.
Adolescence sets the foundation for adult health and is thus a key developmental period for identifying modifiable environmental risks. Exposure to violence is one such risk, as it creates physical and psychological stress that affects well-being and impedes healthy decision making.1 Exposure to violence can take many forms: being the victim of violence, witnessing violent acts, hearing about violence from others, and spending time in settings affected by prior violence. We focus on the final of these, specifically by identifying adolescents who live and attend schools in communities affected by deadly gun violence in the past year. Violent events undermine community social organization—including social cohesion, behavioral norms, and social ties—as community members adapt to the presence of violence.2 These changes affect all community members, whether or not they were also victims or witnesses or heard secondhand reports of the violent event. Indeed, adolescents who spend time in communities that have experienced violence have a wide range of adverse emotional and behavioral outcomes, including posttraumatic stress disorder and internalizing, externalizing, delinquent, and risky health behaviors.3–5
Violence is concentrated in communities characterized by concentrated socioeconomic disadvantage, particularly in areas with higher proportions of poor and non-White residents.6 These patterns suggest that adolescents who live or attend school in disadvantaged communities have a higher risk for exposure to violent contexts and their consequent harms than adolescents who spend time in more advantaged communities. However, associations between demographic characteristics and violent events have primarily been identified through the macro-level analysis of geographically aggregated data (for example, counties, cities, or metropolitan areas). Thus, little is known about the extent to which a specific adolescent in a particular location is at risk for exposure to violence.
This lack of research is largely due to the absence of a harmonized national database of violent incidents in the United States.7 Available data on violent events are either measured at large geographies or limited to citywide data. For example, local crime statistics provided by the Federal Bureau of Investigation’s Uniform Crime Reporting Program are not available for areas smaller than US counties. Some municipalities publicly release incident-level crime data, but coverage is limited to selected cities and urban areas. For these reasons, no national study has yet been able to combine incident-level data on violent incidents and population-based data on individuals to systematically examine the prevalence of and disparities in exposure to violent contexts.
In this study we were able to overcome these limitations by linking a unique data set of violent incidents to a birth cohort study. We used data from the Gun Violence Archive, a detailed database of gun violence incidents in the United States collected by a not-for-profit research group since January 1, 2014.8 Incidents are gathered from media, law enforcement, government, and commercial sources and updated in near real time, including their geocoded location and other characteristics of the incident. We linked these data on deadly gun violence to the home and school addresses of adolescent participants in the Fragile Families and Child Wellbeing Study, a birth-cohort study of children born in large US cities during 1998–2000.
Although all types of violence are detrimental to health, violence caused by guns is unique in that it is a ubiquitous form of deadly violence and a matter of national policy debate. Firearms are used in three-quarters of homicides in the United States.9 Capturing the distribution of deadly gun violence thus identifies much of the lethal violence to which adolescents may be exposed. Gun violence is also an active subject of legislative debate because it is modifiable by policy: Firearm homicides can be reduced through policy interventions such as background checks.10
By linking precise, nationwide data on deadly gun violence to a cohort of adolescents born in large US cities, we were able to identify how many adolescents lived or attended school near a deadly gun violence incident in the past year and to describe patterns of ethnoracial and income inequality in these exposures. The innovations of this analysis were threefold. First, we estimated the prevalence of exposure to deadly gun violence near both an adolescent’s home and their school, capturing the contexts in which adolescents spend the bulk of their time. We are unaware of prior studies that have geolocated both adolescents’ homes and schools to examine nearby violence. Second, the spatial precision of these incident-level data on violent incidents allowed us to consider small-radius, hyperlocal geographies around the home and school that are likely to be most salient for health and wellbeing. This approach is a substantial improvement over the aggregated data on violence previously available at the national level. Third, we estimated ethnoracial and income disparities in these exposures in a cohort of adolescents born during 1998–2000 in large US cities. To our knowledge, we are the first to combine national data on violent events with a birth-cohort study to systematically examine ethnoracial and income disparities in exposure to violence.
Study Data And Methods
DATA
We combined two data sources to estimate adolescents’ annual exposure to deadly gun violence.
The first data source was the Fragile Families and Child Wellbeing Study, a birth cohort study of children born in large US cities during 1998–2000. The city-based design included a total of twenty cities: a stratified random sample of births in sixteen cities with populations of 200,000 or more and four other cities selected because of the study funders’ interests. We considered only the families from the sixteen randomly selected cities, as they can be weighted to represent the target population of births in large US cities between 1998 and 2000. These cities are Austin, Texas; Baltimore, Maryland; Philadelphia, Pennsylvania; Richmond, Virginia; Corpus Christi, Texas; Indianapolis, Indiana; New York, New York; San Jose, California; Boston, Massachusetts; Nashville, Tennessee; Chicago, Illinois; Jacksonville, Florida; Toledo, Ohio; San Antonio, Texas; Pittsburgh, Pennsylvania; and Norfolk, Virginia. This sample included 3,442 families at the study baseline, which occurred when parents were interviewed in the hospital at the time of the focal child’s birth. The study also followed up with the families when the focal child was approximately ages one, three, five, nine, and fifteen.
The second data source was the Gun Violence Archive.8 Since January 1, 2014, this nonprofit organization has catalogued deadly gun violence incidents in the United States via data gathered from media, law enforcement, government, and commercial sources.
Fragile Families and Child Wellbeing Study staff retrieved Gun Violence Archive data on deadly gun violence incidents that occurred between January 1, 2014, and October 5, 2017. Using data on all nonsuicidal incidents (suicides are substantially underreported in most official statistics),11 they validated these data relative to Centers for Disease Control and Prevention Underlying Cause of Death data by state and month, drawn from death certificates. Overall, they found that the Gun Violence Archive captured approximately 88 percent of nonsuicidal deadly gun violence during this period, with a correlation of 0.97 of state-by-month counts between the two sources. Details on this validation are available elsewhere.12 Fragile Families and Child Wellbeing Study staff merged these data to adolescents’ home and school addresses reported in the cohort study, calculating the distances between deadly gun violence incidents and these addresses and comparing dates of incidents with dates of adolescent interviews. This process produced measures of exposure by distance (from residence or school), time (from interview date), and frequency (number of incidents within a time frame and distance).
Our findings underscore prior estimates indicating substantial disparities in adolescent exposure to violence.
ANALYTIC SAMPLE
Our analysis used data from the adolescent wave of the Fragile Families and Child Wellbeing Study collected from 2014 to 2017, when participants were approximately age fifteen. Online appendix exhibit 1 shows the distribution of interview dates across these years.13 The analytic sample included 2,313 adolescents (appendix exhibit 2 describes sample selection).13 We used survey weights to make estimates of exposure to deadly gun violence that are generalizable to all births during 1998–2000 in large US cities (population of 200,000 or more). We followed weighting procedures established by Fragile Families and Child Wellbeing Study staff.14 Weights adjusted for sample design, baseline nonresponse, and attrition on observable characteristics across waves. The weighted baseline and analytic samples have similar baseline demographic characteristics (appendix exhibit 3).13 The demographic characteristics of the analytic sample are described below.
MEASURES
EXPOSURE TO DEADLY GUN VIOLENCE:
For the purposes of our analyses, we defined exposure to deadly gun violence as living or attending school within 500 meters (0.31 miles, or a six-minute walk) of a location where a nonsuicidal deadly gun violence incident occurred in the year before the adolescent interview. (We note that home and school communities typically do not overlap—in our sample, homes and schools are, on average, 5.5 kilometers apart, and only 3.5 percent of adolescents live less than 500 meters from their schools.) We chose to describe annual rates of exposure to deadly gun violence within 500 meters of the adolescent’s home or school based on prior research showing that one’s perceived community extends between 520 and 1,060 meters around one’s home (this is comparable to the radius of one or two median-size census block groups).15 Our selection of a 500-meter radius provides a likely lower bound on estimates of exposure to violent contexts in an adolescent’s perceived community. We also conducted sensitivity tests using other sizes of neighborhood boundaries and found similar results using distances of 250 and 1,000 meters.
For brevity, we describe our measurement of exposure to deadly gun violence as annual exposure. However, 4 percent of adolescent interviews occurred during 2014, when the Gun Violence Archive had been operating for less than a year. Among these interviews, 87 percent had at least six months of data. To verify that this partial coverage did not bias our results, we also reestimated our models excluding these cases. Estimates in this reduced analytic sample are extremely similar to the main findings.
ETHNORACIAL GROUP:
Ethnoracial group was reported by the adolescent. For the 5 percent of adolescents who did not report an ethnoracial group, we used the mother’s ethnoracial group instead. We also tested models dropping these cases, and the results were extremely similar. Thirty-four percent of adolescents are White (non-Hispanic), 25 percent are Black (non-Hispanic), 31 percent are Hispanic (any race), and 10 percent identified some other racial category (including multiracial) (exhibit 1). Because of the heterogeneity of adolescents in the residual ethnoracial group and its small size, we do not present results for this group.
EXHIBIT 1.
Demographic characteristics of the analytic sample of adolescents from the Fragile Families and Child Wellbeing Study, 2014–17
| Demographic characteristics | Percent |
|---|---|
| Adolescent ethnoracial group | |
| White | 34 |
| Black | 25 |
| Hispanic | 31 |
| Other, including multiracial | 10 |
| Household income | |
| Poor | 23 |
| Near-poor | 22 |
| Middle to high | 55 |
| Ethnoracial group and household income subgroups | |
| White | |
| Poor | 4 |
| Near-poor | 4 |
| Middle to high | 27 |
| Black | |
| Poor | 8 |
| Near-poor | 8 |
| Middle to high | 9 |
| Hispanic | |
| Poor | 9 |
| Near-poor | 9 |
| Middle to high | 13 |
| Other, including multiracial | |
| Poor | 3 |
| Near-poor | 1 |
| Middle to high | 6 |
SOURCE Authors’ analysis of data from the Fragile Families and Child Wellbeing Study, 2014–17.
NOTES N = 2,313. Household income includes categories for poor (less than 100 percent of the poverty threshold), near-poor (100–199 percent of the poverty threshold), and middle-to-high-income (200 percent or more of the poverty threshold). Percentages sum to more than 100 percent because of rounding.
HOUSEHOLD INCOME:
Household income was reported by the adolescent’s primary caregiver at the age-fifteen interview and includes income from all sources. The household’s income-to-needs ratio compares the household’s income to the federal poverty threshold. We created three income groups based on these thresholds: poor (less than 100 percent of the poverty threshold), near poor (100–199 percent of the poverty threshold), and middle-to-high income (200 percent or more of the poverty threshold). Twenty-three percent of households were poor, 22 percent were near-poor, and 55 percent were middle-to-high income (exhibit 1).
ANALYTIC APPROACH
We identified disparities in adolescents’ exposure to deadly gun violence near home or school in the twelve months before the interview date. Our estimates compared the rate of exposure to deadly gun violence between ethnoracial groups (non-Hispanic White, non-Hispanic Black, Hispanic) and income groups (poor, near-poor, middle-to-high income). Our estimates were weighted such that they are representative rates of exposure for all children born in US cities with populations of at least 200,000 between 1998 and 2000.
LIMITATIONS
Although linking data on deadly gun violence from the Gun Violence Archive to a birth-cohort study is innovative, the study had several limitations. First, data on past-year deadly gun violence were linked to the adolescent’s home and school locations at the time of the survey. If an adolescent moved or changed schools within the past year, we may have over or underestimated their exposure to deadly gun violence. However, only 12 percent of households with children move annually,16 typically to similar neighborhoods.17 This suggests that having detailed residential histories for the past year would be unlikely to result in substantively different patterns of disparities than those presented here. Also, a small share of adolescents had less than one full year of gun violence data; analyses excluding these adolescents had similar findings.
Second, we had geographic data on adolescents’ home and school locations only. These are the spaces in which adolescents spend the majority of their time, but we could not account for exposure to violence in other settings. Third, our measure of exposure to violence captured living or attending school within 500 meters of a nonsuicidal deadly gun violence incident only; patterns of exposure to other types of violence, including firearm suicides, deadly violence using other weapons, hearing about violence, witnessing violent events, and violent victimization, may differ. Finally, these estimates were specific to a cohort born in large US cities during 1998–2000. Our findings might not generalize to adolescents born in rural areas or smaller cities. We further underscore that these were not estimates of rates of exposure for all adolescents currently living in large cities. Although half of the adolescents in this study resided in their birth city, 30 percent lived in the surrounding metropolitan area, and 20 percent had moved outside the area.
Study Results
RATES OF EXPOSURE
One in five adolescents (21 percent) lived or attended school near a deadly gun violence incident in the past year. Thirteen percent of adolescents lived near an incident, and 14 percent attended school near an incident. Six percent of adolescents both lived and attended school near a deadly gun violence incident (appendix exhibit 4).13
DIFFERENCES IN EXPOSURE
Exhibits 2–4 show the percentage of adolescents who resided or attended school near deadly gun violence by ethnoracial group and household income. Appendix exhibit 4 shows the values used to produce these figures.13
EXHIBIT 2. Ethnoracial disparities in adolescents’ annual exposure to deadly gun violence within 500 meters of home or school, 2014–17.
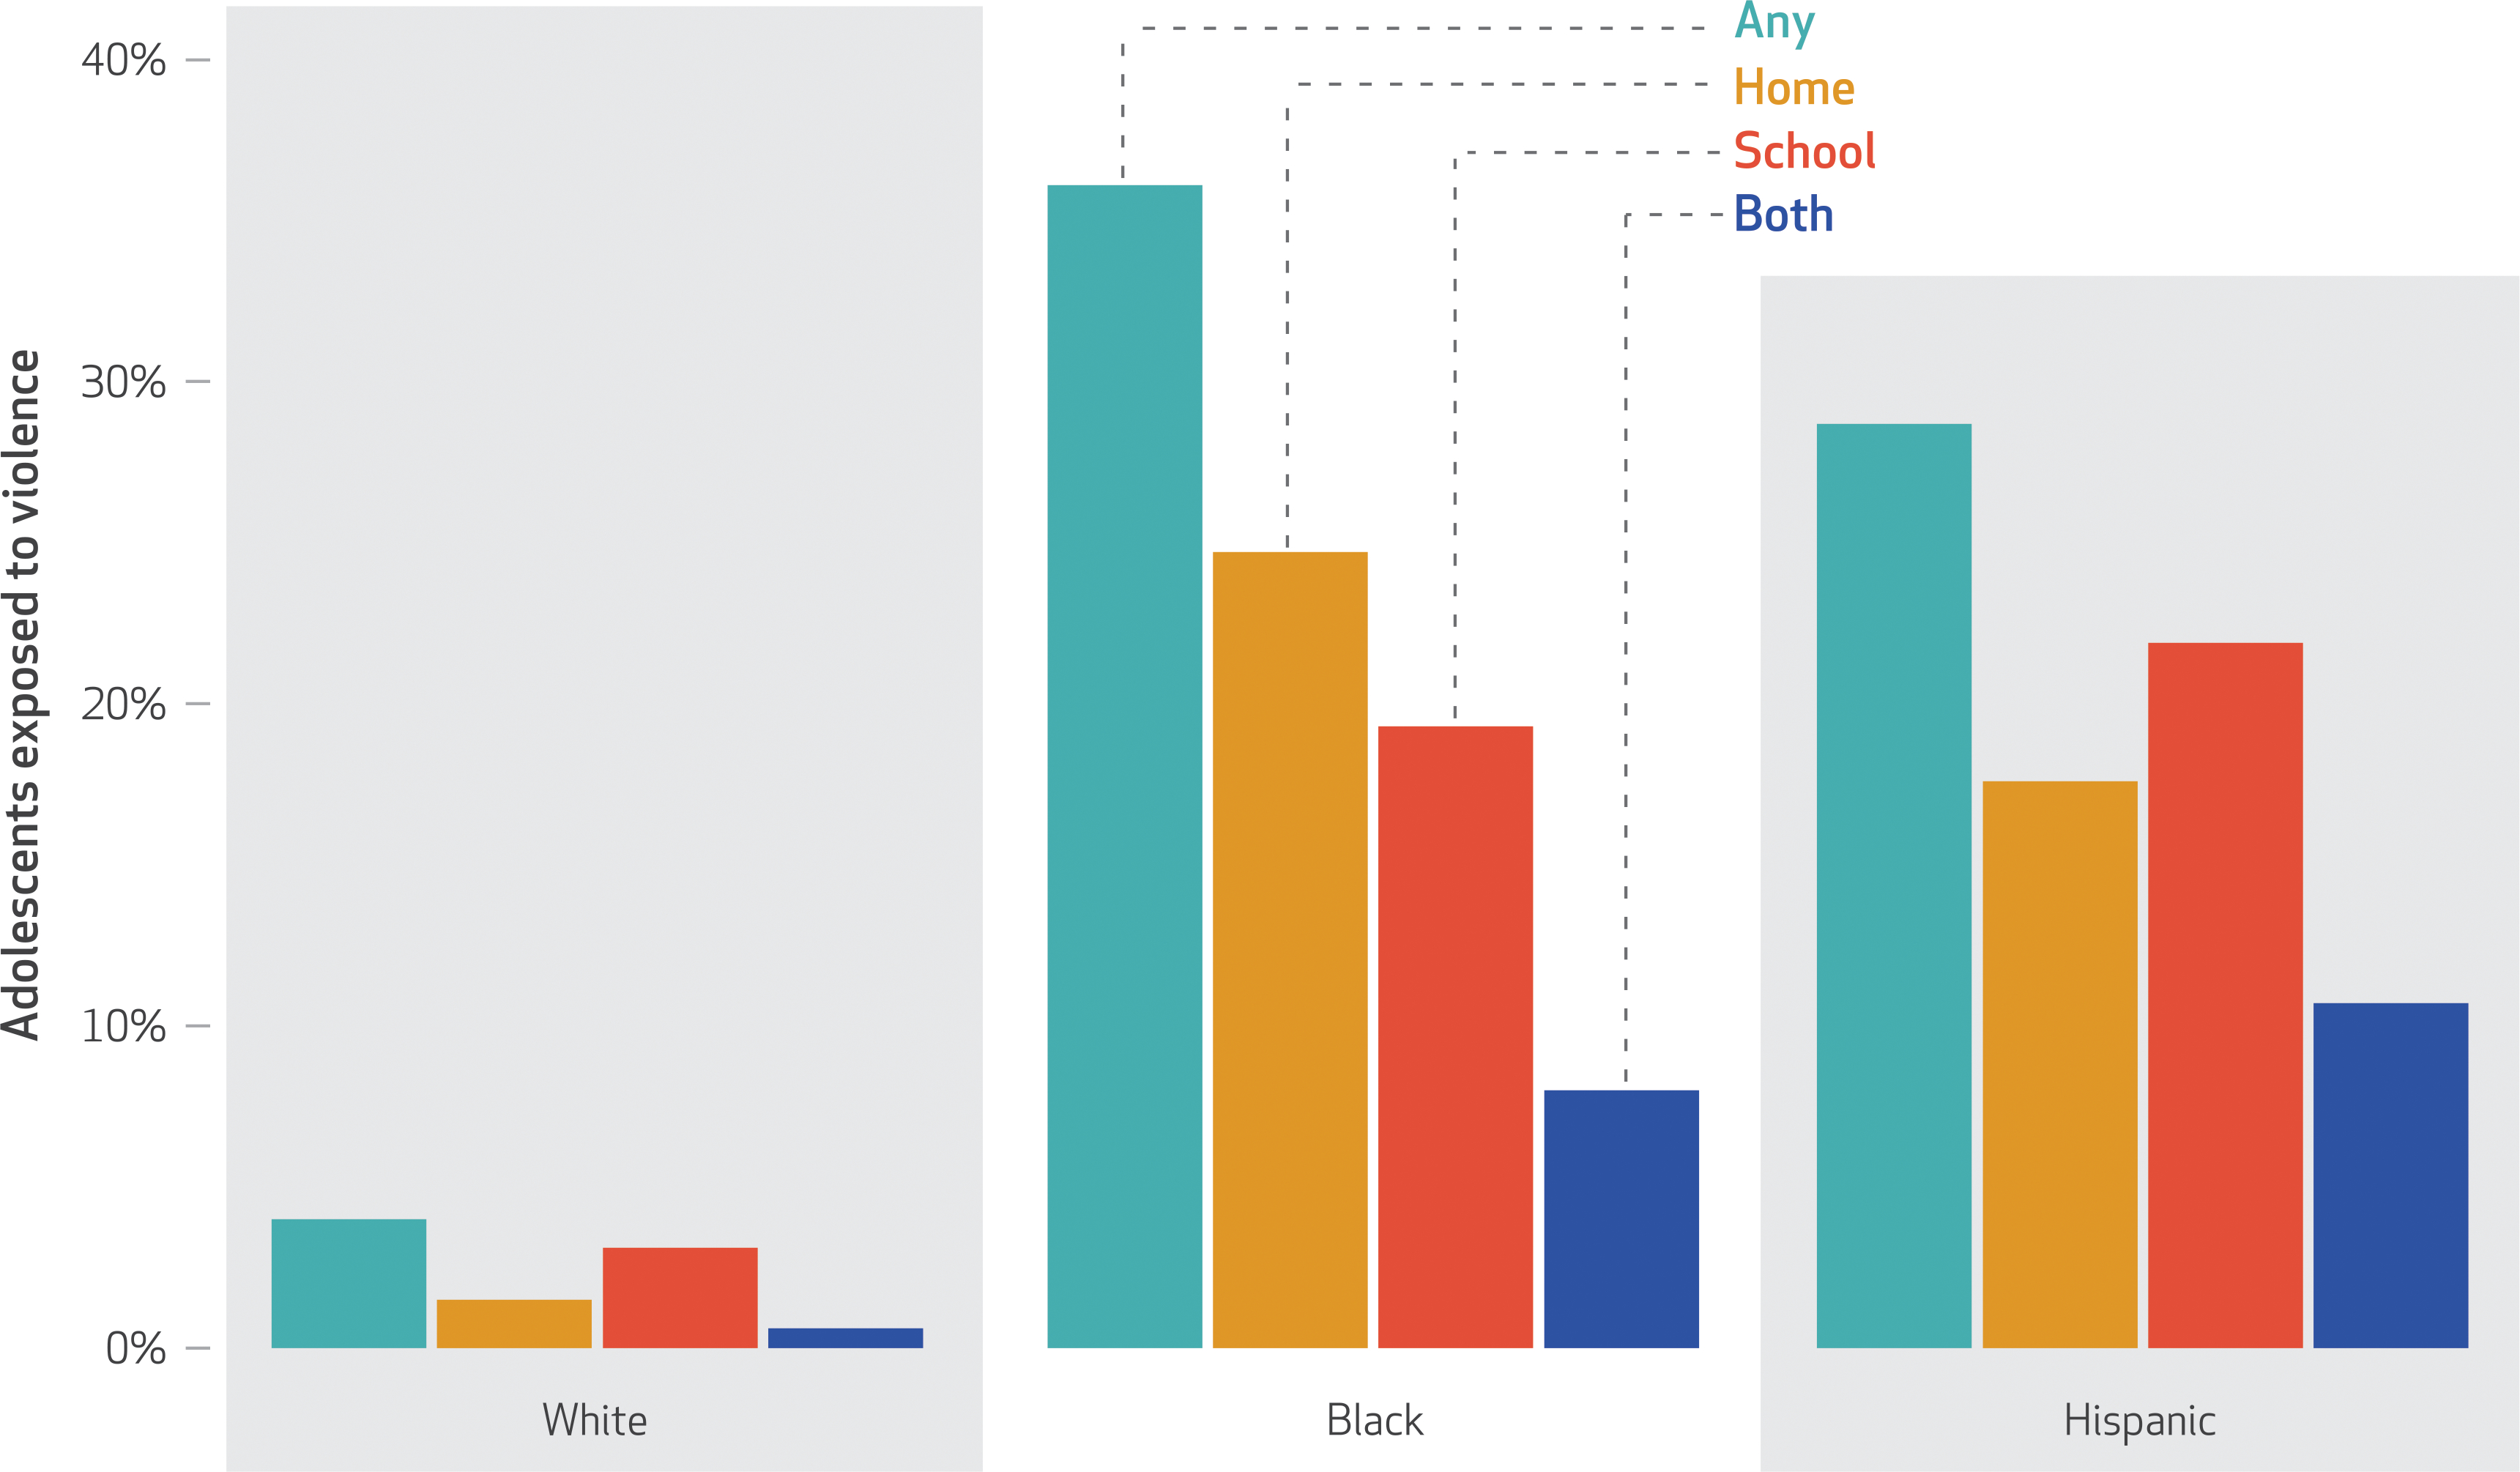
SOURCE Authors’ analysis of data from the Fragile Families and Child Wellbeing Study, 2014–17, using data from the Gun Violence Archive to determine locations of deadly gun violence. NOTE The bar for any exposure indicates exposure near home or school; the bar for both exposures indicates exposure near both home and school.
EXHIBIT 4. Disparities in adolescents’ annual exposure to deadly gun violence within 500 meters of home or school, by ethnoracial group and income, 2014–17.
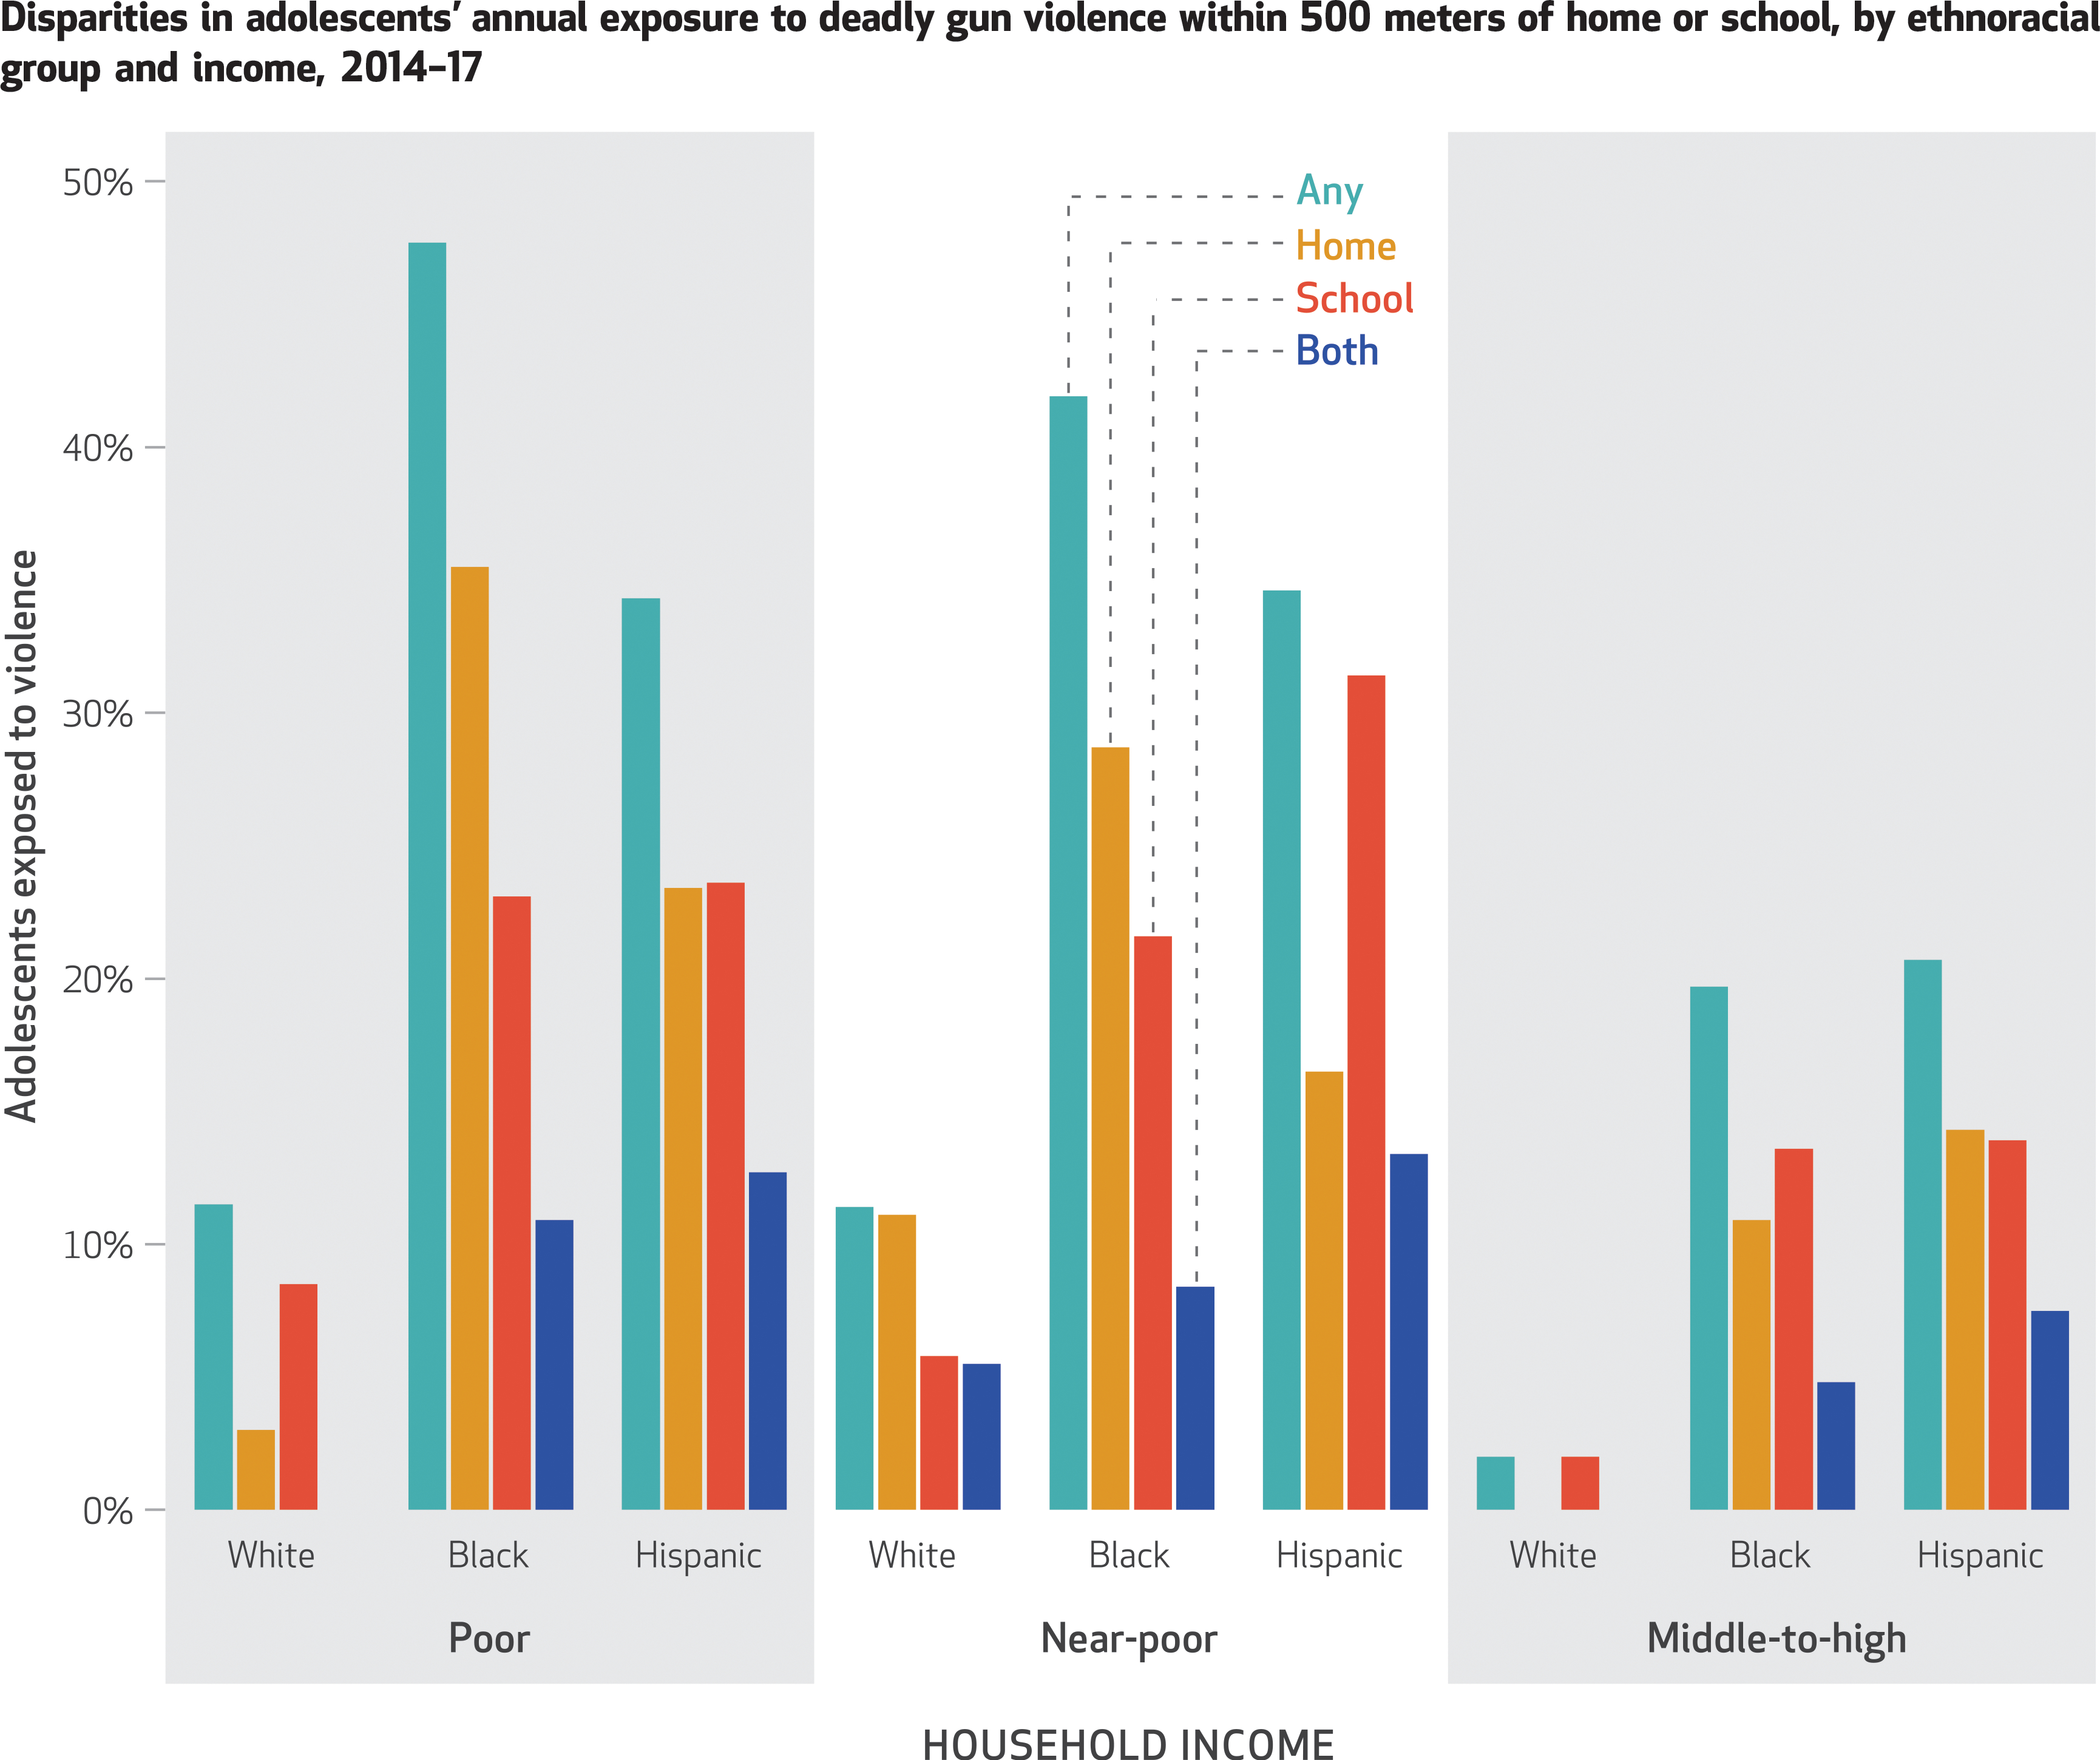
SOURCE Authors’ analysis of data from the Fragile Families and Child Wellbeing Study, 2014–17, using data from the Gun Violence Archive to determine locations of deadly gun violence. NOTES Income groups are defined in the notes to exhibit 1. The bar for any exposure indicates exposure near home or school; the bar for both exposures indicates exposure near both home and school. There are three subgroups in which none (0 percent) of the adolescents were exposed to deadly gun violence within 500 meters: No poor White adolescents were exposed in both contexts, no middle-to-high-income White adolescents were exposed near home, and no middle-to-high-income White adolescents were exposed in both contexts.
ETHNORACIAL DISPARITIES:
Ethnoracial disparities in exposure to deadly gun violence were substantial (exhibit 2). Black and Hispanic adolescents had higher rates of exposure to deadly gun violence than White adolescents in all contexts. Only 4 percent of White adolescents resided or attended school within 500 meters of a deadly gun violence incident in the past year, versus 36 percent of Black adolescents and 29 percent of Hispanic adolescents. Although Black adolescents had the highest rate of exposure to any deadly gun violence near home or school, Hispanic adolescents were slightly more likely to experience violence near their schools and near both home and school than Black adolescents (22 percent versus 19 percent near their schools and 11 percent versus 8 percent near both home and school, respectively). White and Hispanic adolescents were more likely to attend schools in neighborhoods with deadly gun violence than to live in such neighborhoods (3 percent versus 1.5 percent for Whites, 22 percent versus 18 percent for Hispanics). The pattern was reversed for Black adolescents, who were somewhat more likely to live near gun violence than to attend school in such neighborhoods (25 percent versus 19 percent, respectively).
INCOME DISPARITIES:
There was also an income gradient in exposure to violent contexts, as shown in exhibit 3. Adolescents in poor and near-poor households had similar rates of exposure to any deadly gun violence near home or school (37 percent and 33 percent, respectively), which were much higher than the rate of exposure (10 percent) for adolescents in middle-to-high-income households. The same pattern of disparities occurred for all contexts of exposure: Poor and near-poor adolescents had similarly high rates of exposure compared with middle-to-high-income adolescents near home (23 percent and 20 percent, respectively, versus 5 percent), school (23 percent and 22 percent, respectively, versus 7 percent), and both home and school (9 percent and 10 percent, respectively, versus 3 percent).
EXHIBIT 3. Income disparities in adolescents’ annual exposure to deadly gun violence within 500 meters of home or school, 2014–17.
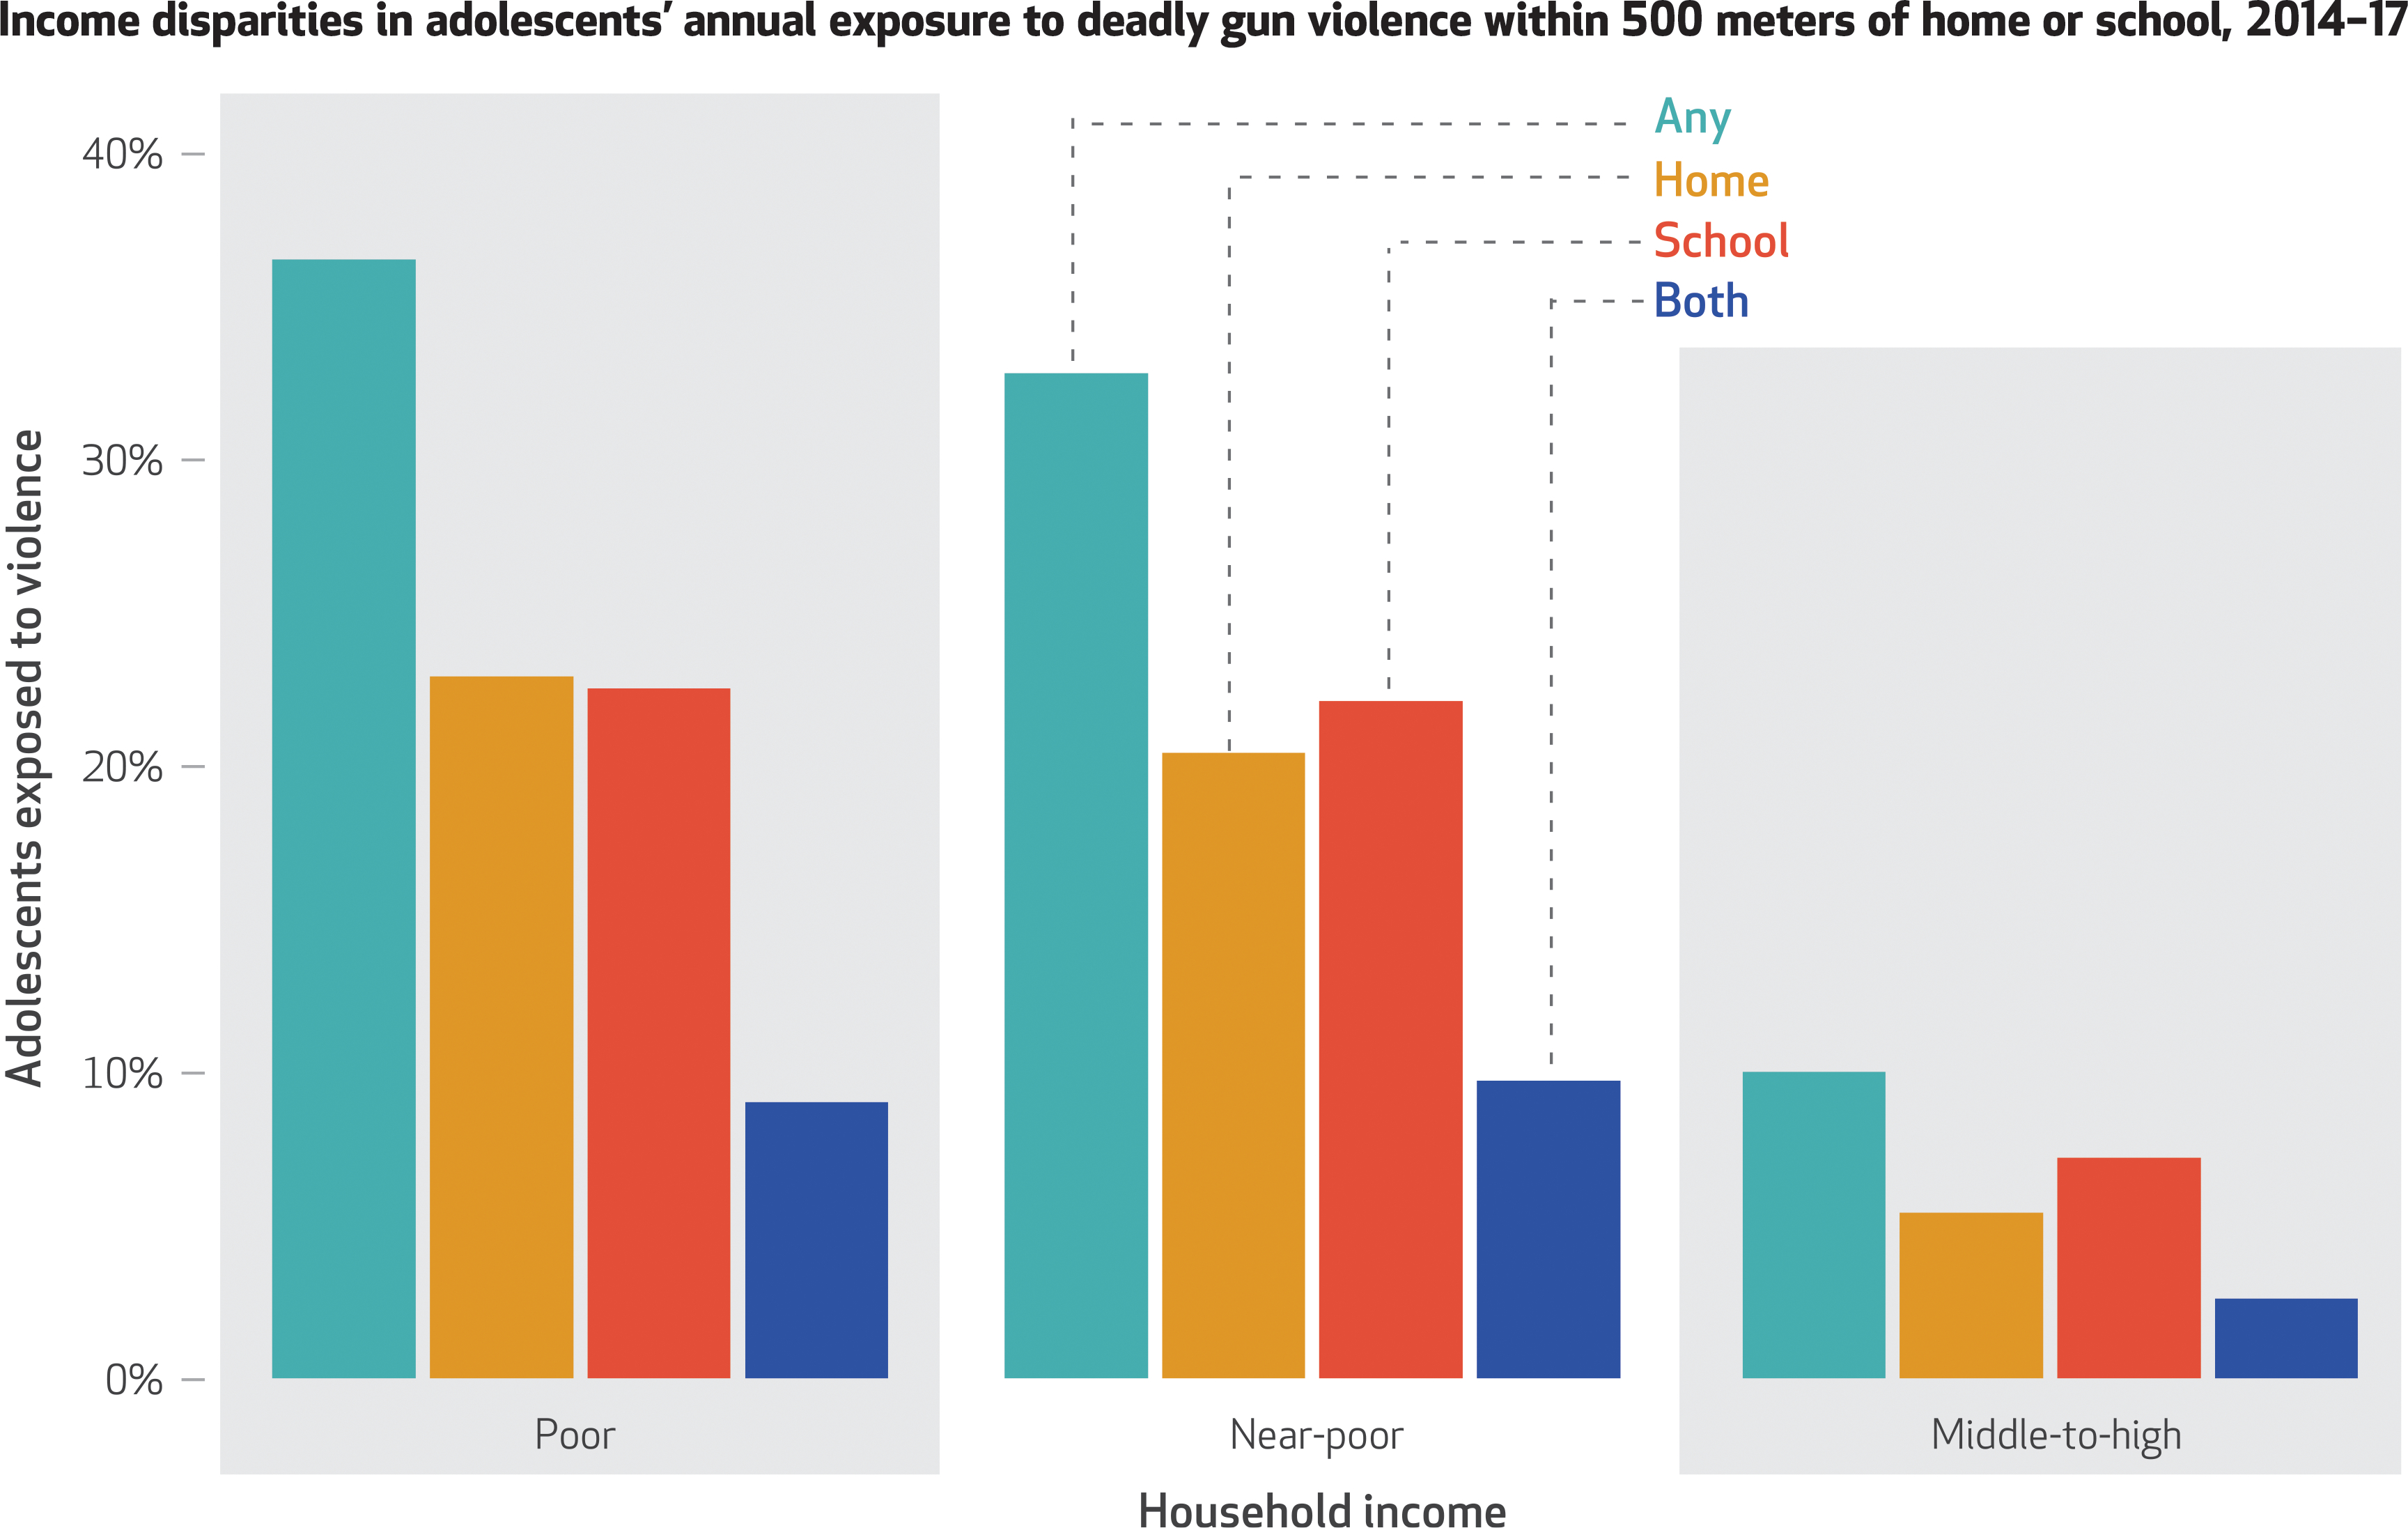
SOURCE Authors’ analysis of data from the Fragile Families and Child Wellbeing Study, 2014–17, using data from the Gun Violence Archive to determine locations of deadly gun violence. NOTES Income groups are defined in the notes to exhibit 1. The bar for any exposure indicates exposure near home or school; the bar for both exposures indicates exposure near both home and school.
COMPOUNDING DISADVANTAGES
Examining rates of exposure to deadly gun violence across ethnoracial-income groups not only confirms that disparities exist across subgroups but also underscores the high rates of exposure to any deadly gun violence among Black and Hispanic adolescents, regardless of income. As in exhibit 2, exhibit 4 shows that Black and Hispanic adolescents had higher rates of exposure to deadly gun violence than White adolescents with similar household incomes at every income level (poor, near poor, and middle-to-high-income) and in all contexts (home or school, home, school, and home and school). For example, among middle-to-high-income adolescents, 20 percent of Black and 21 percent of Hispanic adolescents were exposed to any deadly gun violence near home or school, compared with 2 percent of White adolescents. Similarly, as in exhibit 3, exhibit 4 shows that adolescents living in middle-to-high-income households had lower rates of exposure across contexts (home or school, home, school, and home and school) and within ethnoracial groups (White, Black, and Hispanic) than adolescents in poor and near-poor households. We note one exception to this pattern: Neither poor nor middle-to-high-income Whites were exposed to violence near both home and school (0 percent for both groups).
Moreover, exhibit 4 reveals high rates of any exposure near home or school among Black and Hispanic adolescents of all incomes. Black and Hispanic adolescents not only had higher levels of exposure near home or school within each income group but also had higher levels of exposure between income groups. About one in five middle-to-high-income Black and Hispanic adolescents were exposed to any deadly gun violence near home or school (20 percent and 21 percent, respectively) versus about one in nine poor and near-poor White adolescents (12 percent and 11 percent, respectively).
SUPPLEMENTAL ANALYSES
TESTS OF SIGNIFICANCE:
To assess the statistical significance of these differences, we conducted weighted logistic regressions comparing the rate of exposure to deadly gun violence near home and school by ethnoracial and income groups (appendix exhibit 5).13 These models confirmed statistically significant (p < 0:05) differences in exposure to deadly gun violence by ethnoracial group and income for any (home or school), home, and school exposure. Across modeling specifications, estimates for exposure to violence near both home and school did not reach statistical significance at p < 0:05, likely because the rarity of this outcome makes it difficult to precisely estimate these relative odds.
In unadjusted models, Black and Hispanic adolescents had statistically significantly higher odds of exposure to any deadly gun violence (home or school), violence near home, and violence near school than White adolescents (models 1, 4, and 7). Compared with White adolescents, Black adolescents had thirteen times higher odds of any exposure (p < 0:001, model 1), twenty-one times higher odds of exposure near home (p < 0:01, model 4), and seven times higher odds of exposure near school (p < 0:01, model 7). Hispanic adolescents had ten times higher odds of any exposure (p < 0:001, model 1), fourteen times higher odds of exposure near home (p < 0:05, model 4), and nine times higher odds of exposure near school (p < 0:001, model 7) than White adolescents (appendix exhibit 5).13
Likewise, in unadjusted models of income differences, we found that both poor and near-poor adolescents had statistically significantly higher odds of exposure to any deadly gun violence (home or school), violence near home, and violence near school than middle-to-high-income adolescents (models 2, 5, and 8). Compared with middle-to-high-income adolescents, poor adolescents had five times higher odds of any exposure (p < 0:001, model 2), five times higher odds of exposure near home (p < 0:001, model 5), and four times higher odds of exposure near school (p < 0:05, model 8). Near-poor adolescents had about four times higher odds of any exposure (p < 0:05, model 2), four times higher odds of exposure near home (p < 0:01, model 5), and four times higher odds of exposure near school (p < 0:05, model 8) (appendix exhibit 5).13
In models that simultaneously adjusted for both ethnoracial group and income, findings were substantively similar to those of the unadjusted models. Ethnoracial disparities were larger than income disparities, although the size of both types of disparities was somewhat smaller in the adjusted models (models 3, 6, and 9). Differences in exposure between near-poor and middle-to-high-income adolescents were no longer statistically significant at p < 0:05.
MULTIPLE INCIDENTS:
In the main results, we present estimates of exposure to any (that is, one or more) deadly gun violence incident within 500 meters of the adolescent’s home or school in the past year. We also considered whether the intensity of gun violence exposure might differ across groups. In appendix exhibit 6 we show the prevalence of home and school exposure to multiple deadly gun violence incidents (two or more incidents near home or school in the past year) in this sample.13 Although only 7 percent of adolescents were exposed to multiple incidents near home or school, patterns of disparities were similar to those seen in the primary results. Black and Hispanic adolescents were more likely to be exposed to multiple incidents than White adolescents with similar household incomes in most comparisons. Middle-to-high-income Black and Hispanic adolescents were less likely to be exposed to multiple deadly gun violence than poor and near-poor adolescents of the same ethnoracial group in most cases, although middle-to-high-income Hispanic adolescents had higher rates of any exposure (home or school) and home exposure than near-poor Hispanic adolescents.
These income gradients were somewhat different for White adolescents, however. Both near-poor and middle-to-high-income White adolescents had virtually no exposure to any multiple deadly gun violence near either home or school (0.1 percent and 0 percent, respectively), versus 4 percent of poor White adolescents (appendix exhibit 6).13
Discussion
In a cohort born during 1998–2000 in large US cities, followed up as adolescents during 2014–17, one in five adolescents lived or attended school in a community characterized by nearby deadly gun violence in the past year. This exposure was not distributed equally, however. Black and Hispanic adolescents were far more likely to be exposed to contexts characterized by deadly gun violence than their White peers. Likewise, adolescents living in poor or near-poor households had an elevated risk of living or attending school in a context characterized by deadly gun violence compared with higher-income adolescents. Taking ethnoracial group and household income together, we found that middle-to-high-income Black and Hispanic adolescents were exposed to any deadly gun violence near their homes or schools at higher rates than poorer White adolescents.
Our findings underscore prior estimates indicating substantial disparities in adolescent exposure to violence. Black and Hispanic adolescents witness violent events (including hearing gunshots)4 and experience violent attacks18 at roughly twice the rate of White adolescents. Similarly, lifetime rates of both witnessing violent events and being a victim of violent attacks are higher among low-income versus higher-income adolescents and for Black and Hispanic adolescents compared with White adolescents.19
These stark disparities are consistent with a broader literature on the concentration of contextual disadvantage by ethnoracial group and socioeconomic status. For example, 78 percent of Black children born during 1985–2000 grew up in highly disadvantaged neighborhoods, versus 5 percent of White children.20 From 1990 to 2010, families with children increasingly lived near families with similar incomes.21 Schools are similarly segregated: During the past several decades, Black and Hispanic students have become more likely to attend schools that are majority minority and majority low income.22 Our results suggest that exposure to violence is similarly polarized, with strong patterning by ethnoracial group and income.
DIRECTIONS FOR FUTURE RESEARCH
Although this study moves forward research on exposure to deadly gun violence, many important questions remain unanswered. We suggest three priorities for future research. First, studies should identify exposure to violence in contexts outside the residential neighborhood, such as school (as we have done here), work, and public spaces. Pairing innovative approaches to identify where people spend their time, such as tracking daily movements through smartphones, with high-quality data on violence is promising.23 Second, future research should use longitudinal methods to study how exposure to violence accumulates across the life course. Third, it is important to understand how the context, outcome, and timing of exposure to violence matters for health and how disparities in exposure to violence contribute to health disparities. Linking information on violent events spatially and temporally to ongoing health surveillance and longitudinal studies, as we have done here with the Fragile Families and Child Wellbeing Study, can contribute to answering these questions. The Gun Violence Archive is a novel and promising resource for such research because it facilitates such analyses at a national scale.
Conclusion
Gun violence is recognized as an urgent national problem that requires policy intervention.10,24,25 Considering the distribution and accumulation of exposures to gun violence within the population and across the life course will ultimately indicate how policy and interventions to mitigate these effects can improve public health and reduce population health disparities. Our findings suggest that policies that reduce deadly gun violence, such as background checks,10 will improve population health and promote health equity.
Supplementary Material
Acknowledgments
Research reported in this publication was supported by the Eunice Kennedy Shriver National Institute of Child Health and Human Development of the National Institutes of Health under Award Nos. R01HD036916, R01HD039135, and R01HD040421, and P2CHD047879; a consortium of private foundations; and the Frank H. T. Rhodes Postdoctoral Fellowship. The content is solely the responsibility of the authors and does not necessarily represent the official views of the National Institutes of Health. Funding to append data from the Gun Violence Archive to the Fragile Families and Child Wellbeing Study was provided by the Robert Wood Johnson Foundation grant, “Beating the Odds: Identifying Characteristics of Cities Associated with Achievement by Disadvantaged Adolescents to Improve Youths’ Upward Mobility,” awarded to Sara McLanahan. This work was presented at the Population Association of America 2018 Annual Meeting in Denver, Colorado, April 28, 2018. The authors thank Louis Donnelly for his contributions to acquiring and processing data from the Gun Violence Archive and for drafting early versions of the manuscript.
Contributor Information
Sarah James, Cornell Population Center, Cornell University, in Ithaca, New York..
Sarah Gold, Bendheim-Thoman Center for Research on Child Wellbeing, Princeton University, in Princeton, New Jersey..
Shiva Rouhani, Department of Sociology, University of California Los Angeles, in Los Angeles, California..
Sara McLanahan, Bendheim-Thoman Center for Research on Child Wellbeing, Princeton University.
Jeanne Brooks-Gunn, Virginia and Leonard Marx Professor of Child Development, Teachers College and College of Physicians and Surgeons, Columbia University, in New York, New York.
NOTES
- 1.Margolin G, Gordis EB. The effects of family and community violence on children. Annu Rev Psychol. 2000;51:445–79. [DOI] [PubMed] [Google Scholar]
- 2.Harding DJ. Collateral consequences of violence in disadvantaged neighborhoods. Soc Forces. 2009;88(2):757–84. [DOI] [PMC free article] [PubMed] [Google Scholar]
- 3.Fowler PJ, Tompsett CJ, Braciszewski JM, Jacques-Tiura AJ, Baltes BB. Community violence: a meta-analysis on the effect of exposure and mental health outcomes of children and adolescents. Dev Psychopathol. 2009;21(1):227–59. [DOI] [PubMed] [Google Scholar]
- 4.Zimmerman GM, Posick C. Risk factors for and behavioral consequences of direct versus indirect exposure to violence. Am J Public Health. 2016;106(1):178–88. [DOI] [PMC free article] [PubMed] [Google Scholar]
- 5.James S, Donnelly L, Brooks-Gunn J, McLanahan S. Links between childhood exposure to violent contexts and risky adolescent health behaviors. J Adolesc Health. 2018;63(1):94–101. [DOI] [PMC free article] [PubMed] [Google Scholar]
- 6.Sampson RJ. Great American city: Chicago and the enduring neighborhood effect. Chicago (IL): University of Chicago Press; 2012. [Google Scholar]
- 7.Sharkey P The long reach of violence: a broader perspective on data, theory, and evidence on the prevalence and consequences of exposure to violence. Annu Rev Criminol. 2018;1:85–102. [Google Scholar]
- 8.Gun Violence Archive [home page on the Internet] Washington (DC): Gun Violence Archive; 2021. [cited 2021 Apr 15]. Available from: https://www.gunviolencearchive.org/ [Google Scholar]
- 9.Federal Bureau of Investigation. Uniform Crime Report: crime in the United States, 2018. Washington (DC): FBI; 2019. [Google Scholar]
- 10.Morrall A The science of gun policy: a critical synthesis of research evidence on the effects of gun policies in the United States. Rand Health Q. 2018;8(1):5. [PMC free article] [PubMed] [Google Scholar]
- 11.Tøllefsen IM, Hem E, Ekeberg Ø. The reliability of suicide statistics: a systematic review. BMC Psychiatry. 2012;12(9):9. [DOI] [PMC free article] [PubMed] [Google Scholar]
- 12.Fragile Families and Child Wellbeing Study. Fragile Families Gun Violence Archive data on local deadly gun violence restricted use appendage [Internet] Princeton (NJ): Princeton University, Bendheim-Thoman Center for Research on Child Well-being; 2019 Mar. Appendix, Comparing incident-level gun violence data with national data; [cited 2021 Apr 15]. Available from: https://fragilefamilies.princeton.edu/sites/fragilefamilies/files/ff_gva_15y_res1_20190603.pdf [Google Scholar]
- 13.To access the appendix, click on the Details tab of the article online.
- 14.Fragile Families and Child Wellbeing Study. Fragile Families & Child Wellbeing Study: a brief guide to using the weights for waves 1–6 [Internet]. Princeton (NJ):Princeton University, Bendheim-Thoman Center for Research on Child Wellbeing; [cited 2021 Apr 15]. Available from: https://fragilefamilies.princeton.edu/sites/fragilefamilies/files/using_the_fragile_families_weights_waves_1_6.pdf [Google Scholar]
- 15.Donaldson K How big is your neighborhood? Using the AHS and GIS to determine the extent of your community [Internet]. Washington (DC): Census Bureau; 2013. Jun 13 [cited 2021 Apr 115]. (SEHSD Working Paper No. FY2013-064). Available from: https://www.census.gov/content/dam/Census/programs-surveys/ahs/working-papers/how_big_is_your_neighborhood.pdf [Google Scholar]
- 16.Mateyka PJ. Desire to move and residential mobility: 2010–2011 [Internet]. Washington (DC): Census Bureau; 2015. Mar [cited 2021 Apr 15]. Available from: https://www.census.gov/content/dam/Census/library/publications/2015/demo/p70-140.pdf [Google Scholar]
- 17.Sharkey P Residential mobility and the reproduction of unequal neighborhoods. Cityscape (Wash, DC). 2012;14(3):9–31. [Google Scholar]
- 18.Tillyer MS, Tillyer R. Race, ethnicity, and adolescent violent victimization. J Youth Adolesc. 2016;45(7):1497–511. [DOI] [PubMed] [Google Scholar]
- 19.Crouch JL, Hanson RF, Saunders BE, Kilpatrick DG, Resnick HS. Income, race/ethnicity, and exposure to violence in youth: results from the National Survey of Adolescents. J Community Psychol. 2000;28(6):625–41. [Google Scholar]
- 20.Sharkey P Neighborhoods and the Black-White mobility gap [Internet]. Washington (DC): Economic Mobility Project; 2009. Jul [cited 2021 Apr 15]. Available from: https://www.pewtrusts.org/~/media/legacy/uploadedfiles/wwwpewtrustsorg/reports/economic_mobility/pewsharkeyv12pdf.pdf [Google Scholar]
- 21.Owens A Inequality in children’s contexts: income segregation of households with and without children. Am Sociol Rev. 2016;81(3):549–74. [Google Scholar]
- 22.Orfield G, Kucsera J, Siegel-Hawley G. E pluribus…separation: deepening double segregation for more students [Internet]. Los Angeles (CA): Civil Rights Project; 2012. Sep [cited 2021 Apr 15]. Available from: https://escholarship.org/uc/item/8g58m2v9 [Google Scholar]
- 23.Browning CR, Calder CA, Ford JL, Boettner B, Smith AL, Haynie D. Understanding racial differences in exposure to violent areas: integrating survey, smartphone, and administrative data resources. Ann Am Acad Pol Soc Sci. 2017;669(1):41–62. [DOI] [PMC free article] [PubMed] [Google Scholar]
- 24.Hemenway D, Miller M. Public health approach to the prevention of gun violence. N Engl J Med. 2013; 368(21):2033–5. [DOI] [PubMed] [Google Scholar]
- 25.Behrman P, Redding CA, Raja S, Newton T, Beharie N, Printz D. Society of Behavioral Medicine (SBM) position statement: restore CDC funding for firearms and gun violence prevention research. Transl Behav Med. 2018;8(6):958–61. [DOI] [PMC free article] [PubMed] [Google Scholar]
Associated Data
This section collects any data citations, data availability statements, or supplementary materials included in this article.