

Abstract
Objectives:
Accurate preoperative diagnosis of small cell neuroendocrine cancer of the cervix (SCNECC) is crucial for establishing the best treatment plan. This study aimed to develop an improved, non-invasive method for the preoperative diagnosis of SCNECC by integrating clinical, MR morphological, and apparent diffusion coefficient (ADC) information.
Methods:
A total of 105 pathologically confirmed cervical cancer patients (35 SCNECC, 70 non-SCNECC) from multiple centres with complete clinical and MR records were included. Whole lesion histogram analysis of the ADC was performed. Multivariate logistic regression analysis was used to develop diagnostic models based on clinical, morphological, and histogram data. The predictive performance in terms of discrimination, calibration, and clinical usefulness of the different models was assessed. A nomogram for preoperatively discriminating SCNECC was developed from the combined model.
Results:
In preoperative SCNECC diagnosis, the combined model, which had a diagnostic AUC (area under the curve) of 0.937 (95% CI: 0.887–0.987), outperformed the clinical-morphological model, which had an AUC of 0.869 (CI: 0.788–0.949), and the histogram model, which had an AUC of 0.872 (CI: 0.792–0.951). The calibration curve and decision curve analyses suggest that the combined model achieved good fitting and clinical utility.
Conclusions:
Non-invasive preoperative diagnosis of SCNECC can be achieved with high accuracy by integrating clinical, MR morphological, and ADC histogram features. The nomogram derived from the combined model can provide an easy-to-use clinical preoperative diagnostic tool for SCNECC.
Advances in knowledge:
It is clear that the therapeutic strategies for SCNECC are different from those for other pathological types of cervical cancer according to V 1.2021 of the NCCN clinical practice guidelines in oncology for cervical cancer. This research developed an improved, non-invasive method for the preoperative diagnosis of SCNECC by integrating clinical, MR morphological, and apparent diffusion coefficient (ADC) information.
Introduction
Cervical cancer is the fourth most common cancer in females worldwide, with a prevalence of 6.6% and a mortality of 7.7%. 1 Neuroendocrine carcinomas of the cervix (NECCs) account for 2–5% of cervical malignancies, 2–5 with significantly lower 5-year overall survival rates of approximately 30% compared to >65% for squamous cell carcinoma and adenocarcinoma of the cervix. 6,7 As a very aggressive cancer, small cell neuroendocrine carcinoma of the cervix (SCNECC) belongs to the NECC category of high-grade neuroendocrine carcinomas.
The NCCN cervical cancer clinical practice guidelines in oncology suggest different treatment and management strategies for SCNECC than for other subtypes of cervical cancers. 8 Specifically, the treatment strategies for SCNECC are based on either locally advanced or metastatic diseases confined to the cervix, whereas those of other subtypes of cervical cancer are based on the staging as specified by the 2018 International Federation of Gynaecology and Obstetrics (FIGO) and whether the treatment is fertility-sparing. 8 Notably, SCNECC is not considered suitable for fertility-sparing surgery. 8 Cisplatin combined with etoposide chemotherapy is recommended as the first line of chemotherapy for SCNECC, while cisplatin-based chemotherapy alone is recommended for other subtypes of cervical cancer. In addition, brain MR is the recommended imaging modality for SCNECC but not for other subtypes of cervical cancer. 8 Therefore, the accurate preoperative diagnosis of SCNECC is crucial for establishing an appropriate, comprehensive treatment plan.
The diagnosis of SCNECC can be made on cervical biopsy. However, this diagnostic approach has many limitations, such as invasiveness, patient compliance, and intra/interobserver variation. Moreover, it may easily lead to an incorrect diagnosis as poorly differentiated cervical cancer due to the limited amount of tissue, and the neuroendocrine component is sometimes only recognized after hysterectomy. 9 In contrast, MR is recommended by the European Society of Urogenital Radiology guidelines 10 as a useful method for cervical cancer diagnosis for initial staging, response monitoring and evaluation of disease recurrence because of its good soft tissue resolution and non-invasiveness. A few reports have offered discussions on the MR characteristics of NECC, but a definitive NECC diagnosis based on preoperative MR results seems difficult. 11–14 Some studies have reported that low apparent diffusion coefficient (ADC) values are suggestive of NECC. 12,14 Others suggest that a whole-lesion-based ADC histogram analysis can reflect pathological heterogeneity, which can be achieved by quantifying the ADC intensity distribution in regions of interest (ROIs), which is often ignored by empirical approaches. 15,16 To date, research on preoperative SCNECC diagnosis has been very limited despite its importance, which may partially be attributed to the rarity of this malignancy. Therefore, this study focused on developing a non-invasive, practical, and sufficiently accurate method for preoperatively diagnosing SCNECC by constructing a combined risk model integrating clinical features, MR morphological features, and whole-lesion ADC histogram analysis.
Methods and materials
Patients
Our Institutional Review Board approved this retrospective study and waived the requirement for informed consent. A total of 69 patients with pathologically (biopsy or surgical resection sampling) confirmed SCNECC from five medical centres, including the First Hospital of Lanzhou University (LZU1st), Gansu Provincial Maternity and Child-care Hospital (GSMCH), Gansu Tumor Hospital (GSTH), Gansu Provincial Hospital (GSPH), and the Second Hospital of Lanzhou University (LZU2nd) , between July 2010 and April 2021 were retrospectively reviewed (Supplementary Figure S1). The inclusion criteria included the following: (1) pelvic MR imaging performed before preoperative treatment, (2) MR imaging with good quality can identify the tumour morphology, (3) complete clinical information, and (4) MR performed at 1.5 T and diffusion-weighted (DW) imaging with b values of 50 and 800 s/mm2. A patient was excluded if she met any one of the following conditions: (1) missing preoperative pelvic MR imaging, (2) incomplete clinical information, (3) indeterminable boundary and morphology of the SCNECC on MR, or (4) MR performed at 3.0 T. Ultimately, a total of 35 patients with SCNECC who met the inclusion and exclusion criteria were enrolled (Table 1).
Table 1.
Characteristics of patients with cervical cancer
| Characteristics | Non-SCNECC | SCNECC | p value |
|---|---|---|---|
| (N = 70) | (N = 35) | ||
| Age (mean ± SD) | 48.77 ± 7.61 | 50.09 ± 10.81 | 0.472 |
| FIGO staging (n (%)) | 0.254 | ||
| I | 36 (51.4%) | 17 (48.6%) | |
| II | 30 (42.9%) | 12 (34.3%) | |
| III | 2 (2.86%) | 4 (11.4%) | |
| IV | 2 (2.86%) | 2 (5.71%) | |
| Tumour LR Axis (median [IQR]) | 3.28 [2.66;4.14] | 3.30 [2.72;5.18] | 0.426 |
| Tumour AP Axis (median [IQR]) | 2.70 [2.11;3.54] | 3.30 [2.08;4.80] | 0.16 |
| Tumour height (median [IQR]) | 3.09 [2.11;3.81] | 3.18 [2.12;4.20] | 0.681 |
| Tumour mini-diameter (median [IQR]) | 2.46 [1.76;3.15] | 2.82 [2.05;3.78] | 0.241 |
| LN long axis (median [IQR]) | 1.04 [0.84;1.23] | 1.36 [0.98;2.16] | 0.007 |
| LN short axis (median [IQR]) | 0.66 [0.53;0.86] | 0.98 [0.65;1.85] | 0.001 |
| LN tumour ratio (median [IQR]) | 0.20 [0.14;0.26] | 0.27 [0.19;0.51] | 0.001 |
| LNM (n (%)) | <0.001 | ||
| Absent | 55 (78.6%) | 14 (40.0%) | |
| Present | 15 (21.4%) | 21 (60.0%) | |
| HPV18(n (%)) | <0.001 | ||
| Absent | 62 (88.6%) | 15 (42.9%) | |
| Present | 8 (11.4%) | 20 (57.1%) | |
| Tumour size (median [IQR]) | 3.80 [2.78;4.38] | 4.08 [2.80;5.40] | 0.274 |
| Tumour size >= 4 cm (n (%)) | 0.533 | ||
| Absent | 40 (57.1%) | 17 (48.6%) | |
| Present | 30 (42.9%) | 18 (51.4%) | |
| Tumour size >= 5 cm (n (%)) | 0.002 | ||
| Absent | 62 (88.6%) | 21 (60.0%) | |
| Present | 8 (11.4%) | 14 (40.0%) |
AP: anteroposterior; FIGO: International Federation of Gynaecology and Obstetrics; HPV: human papillomavirus; IQR: interquartile range; LNM: lymph node metastasis; LR: left-right;SCNECC: small cell neuroendocrine cancer of the cervix; SD: standard deviation.
A total of 70 non-SCNECC patients were included in this study, including 35 adenocarcinoma (AC) patients and 35 squamous cell carcinoma (SCC) patients (Table 1, Supplementary Figure S1). All patients underwent a pelvic MR imaging examination. The details are shown in Supplementary S1, Supplementary Table S1 and S2.
Histopathology
All patient histopathology diagnoses were confirmed by biopsy or surgical resection sampling findings. Human papillomavirus (HPV) 18 genotyping was performed by polymerase chain reaction (PCR).
Histogram imaging analysis
Anonymous DWI and T 2-weighted imaging (T2WI) data were archived offline in DICOM format and transferred to FireVoxel workstation (FireVoxel, 301; https://firevoxel.org). The corresponding ADC maps were generated automatically according to the monoexponential diffusion model.
The first reader (Y.S.X, a gynaecologic radiologist with 2 years of experience) manually examined the ROI segments slice by slice on the low b-value DW images (b = 50 s/mm2) along the inside edge of the lesions to delineate the whole tumour volume without excluding cystic, haemorrhagic or necrotic areas for more complete information with reference to the corresponding level of the axial and sagittal T2WI. During the process of ROI segmentation, care was taken to avoid inclusion of any of the adjacent normal cervical stroma or vascular structures and contamination by areas of gas, fluid, or Nabothian cysts in the cervix and artefacts. The second reader (Y.Z.L, a gynaecologic radiologist with 9 years of experience) independently verified the ROIs. Both readers were blinded to the clinical information or the pathological patterns of the patient.
The ADC map within the whole-tumour ROIs was constructed automatically. The histogram and frequency table of ADC values were generated from the ROI. The parameters calculated included the following: minimum, maximum, mean, median, standard deviation (SD), inhomogeneity, skewness, kurtosis, and entropy. The whole-tumour frequency distribution table of the ADC values was imported into SPSS V 26.0 statistical software (IBM, Armonk, NY), and the 5th, 10th, 15th, 20th, 25th, 30th, 35th, 40th, 45th, 50th, 55th, 60th, 65th, 70th, 75th, 80th, 85th, 90th, and 95th percentiles were subsequently obtained.
Feature selection and model construction
The selected clinical features included age, staging (FIGO 2009 17 and FIGO 2018 18 ), and HPV18. The selected MR morphological features included lymph node metastasis (LNM), tumour LR (left to right) axis, tumour AP (anteroposterior) axis, tumour height, tumour size, tumour mini-diameter, lymph node long axis, lymph node short axis, and LN-tumour ratio. The definitions and classification criteria of the above features are shown in Supplementary Table 2. Values of the selected features were standardised with the z-score method.
These morphological features were reviewed independently by two radiologists (Y.Z.L and P.L with 9 and 13 years of experience in gynaecologic MR imaging, respectively). Prior to evaluation, the criteria for tumour and lymph node measurements and the determination of lymph node metastasis were standardised for the two radiologists. A variable with p < 0.05 according to Bland–Altman analysis or a κ value less than 0.60 was considered poor and removed.
Histogram features were first assessed by the t test or the Mann-Whitney U-test. Univariate analyses were performed to define the histogram features. The Spearman correlation coefficient was used as an indicator of the correlation among these features, and features with a correlation coefficient of 0.90 or higher were considered redundant and eliminated (Supplementary Figures S3 and S4). All the significant factors were introduced into stepwise logistic regression to select the independent features for the model. Akaike’s information criterion (AIC) was employed as the stopping rule. The retained features were analysed through multivariate logistic regression to build the clinical-morphological model, histogram model, and combined model.
Performance assessment of models
Receiver operating characteristic (ROC) curve analysis was conducted, and the area under the ROC curve (AUC), which describes the discrimination abilities of the model, was obtained as the primary indicator of model performance in SCNECC diagnosis. The Hosmer–Lemeshow test was used to evaluate the goodness of fit of the model. Threefold cross-validation was repeated 10 times to test the diagnostic performance of the models.
Evaluation of clinical applicability
A combined clinical-morphological-histogram nomogram was constructed for assessing its clinical applicability in predicting the probability of SCNECC. Decision curve analysis (DCA) was adopted to assess the clinical usefulness of the models by estimating the net benefits at a range of threshold probabilities. 19 Three decision curves based on the clinical-morphological model, histogram model, and combined model were plotted.
The entire model-building process is illustrated by the flowchart in Figure 1.
Figure 1.

Feature workflow and study flowchart
Statistical analysis
R software (https://www.rproject.org, V 4.0.4) was used for statistical analyses. To compare the proportional differences between the SCNECC group and the non-SCNECC group, the Mann–Whitney U-test was used for continuous variables, and Pearson’s chi-squared test was used for categorical variables. Differences in AUC values between different models were compared using the DeLong test. An AUC value above 0.75 was considered to be good. 20 A Hosmer–Lemeshow test p < 0.05 was considered to indicate good fitness. Two-tailed p < 0.05 was considered statistically significant.
Results
Patient characteristics
The study flowchart is shown in Figure 1. The demographic characteristics of the patients are summarized in Table 1. The study group consisted of 70 non-SCNECC patients, including 35 adenocarcinoma (AC) patients and 35 squamous cell carcinoma (SCC) patients, with a mean age of 48.77 ± 7.61 years, and 35 SCNECC patients with a mean age of 50.09 ± 1.81 years. SCNECC subtypes included pure type (n = 18), mixed with SCCC (n = 3) and mixed with AC (n = 14). The squamous cell carcinoma type was squamous cell carcinoma (n = 35). The adenocarcinoma subtypes were mucous (n = 32), clear cell (n = 2), and micropapillary (n = 1).
According to the FIGO staging system, the 35 SCNECC patients were classified as stage I (n = 17), II (n = 12), III (n = 4), and IV (n = 2), and the 70 non-SCNECC patients were classified as stage I (n = 36), II (n = 30), III (n = 2), and IV (n = 2). Twenty-nine patients with SCNECC and 62 patients with non-SCNECC underwent radical hysterectomy and retroperitoneal lymph node dissection. According to the preoperative FIGO staging and postoperative risk factors, chemotherapy, pelvic EBRT, or brachytherapy were selectively implemented at the proper time. No significant difference was observed in age, FIGO staging, tumour LR axis, tumour AP axis, tumour height, tumour mini diameter, tumour size, or tumour size >= 4 cm (all p > 0.05).
Clinical-morphological model
The clinical MR morphological features included LNM, tumour LR axis, tumour AP axis, tumour height, tumour size, tumour size >= 4 cm, tumour size >= 5 cm, tumour mini-diameter, lymph node long axis, lymph node short axis, and LN-tumour ratio.
After applying the t-test, Mann–Whitney U-test, or Pearson’s chi-squared test, HPV18, LNM, lymph node long axis, lymph node short axis, tumour size >= 5 cm, and LN-tumour ratio remained as significant clinical MR morphological features (p < 0.05). These significant features were subjected to stepwise logistic regression, and the AIC was employed as the stopping rule; the parameter with the lowest AIC value was selected. HPV18, tumour size >= 5 cm and LN-tumour ratio remained, and variables with p > 0.05 according to Bland–Altman analysis (Supplementary Figure S2) and LNM, with a κ value of 0.76, were retained to build a clinical-morphological model by multivariate logistic regression.
The regression coefficients of LN-tumour ratio, tumour size, and HPV18 were 1.72, 2.50, and 2.22, respectively (p < 0.01) (Table 2). The constructed clinical-morphological model achieved an AUC of 0.869 with a 95% confidence interval (CI) of 0.788–0.949 (Table 3).
Table 2.
Comparison of the models by multivariate logistic regression analysis
| Model | Coefficients | OR (95% CI) | p value |
|---|---|---|---|
| Clinical-morphological model | |||
| LN-tumour ratio | 1.7201 | 5.585 (1.857–21.434) | 0.0059 |
| Tumour size >= 5 cm | 2.5006 | 12.190 (3.509–49.226) | 0.0001 |
| HPV18 | 2.2211 | 9.217 (2.845–33.143) | 0.0003 |
| Histogram model | |||
| ADCMinimum | −0.7426 | 0.476 (0.206–1.050) | 0.0701 |
| ADCInhomogeneity | 1.5657 | 4.786 (1.874–14.939) | 0.0029 |
| Combined model | |||
| LN-tumour ratio | 1.2913 | 3.637 (1.157–15.202) | 0.0479 |
| Tumour size >= 5 cm | 1.914 | 6.780 (1.488–35.729) | 0.0165 |
| HPV18 | 2.6191 | 13.723 (2.778–86.664) | 0.0023 |
| ADCMinimum | −1.0156 | 0.362 (0.118–0.980) | 0.0565 |
| ADCInhomogeneity | 1.0735 | 2.926 (0.850–12.387) | 0.1141 |
ADC: Apparent diffusion coefficient; HPV: human papillomavirus; LN: lymph node;OR: odds ratio.
Table 3.
Comparison of the diagnostic performance of the different models
| Model | AUC (95% CI) | ACC | SEN | SPE | PPV | NPV | Cut off |
|---|---|---|---|---|---|---|---|
| Histogram | 0.872 (0.792–0.951) | 0.867 | 0.771 | 0.914 | 0.818 | 0.889 | 0.362279 |
| Clinical-morphological | 0.869 (0.788–0.949) | 0.857 | 0.743 | 0.914 | 0.812 | 0.877 | 0.418755 |
| Combine | 0.937 (0.887–0.987) | 0.848 | 0.914 | 0.814 | 0.711 | 0.95 | 0.229597 |
ACC: accuracy,AUC: area under the curve, NPV: negative predictive value; PPV: positive predictive value, SEN: sensitivity, SPE: specificity.
Histogram model
First, after application of the Mann-Whitney U-test, ADCminimum, ADCmean, ADCmedian, ADCstandard deviation (SD), ADCinhomogeneity, ADC5th, ADC10th, ADC15th, and ADC20th were identified as significant histogram features (p < 0.05) (Supplementary Table S3). Second, the Spearman correlation coefficient was used as an indicator of the correlation among these histogram features, and features with a correlation coefficient of 0.90 or higher were considered redundant and eliminated (Supplementary Figure S3). Subsequently, ADCminimum, ADCmedian, ADCSD, ADCinhomogeneity, ADC5th, and ADC20th remained (Supplementary Figure S3). Third, the ADC histogram percentile features were subjected to collinearity analysis to identify potential independent variable collinearity problems. The analysis shows that the histogram percentile features were collinear (Supplementary Figure 5). Therefore, ADC20th was removed, and ADC5th was retained. Fourth, ADC5th, ADCminimum, ADCmedian, ADCSD, and ADCinhomogeneity were subjected to stepwise logistic regression, and AIC was employed as the stopping rule. Finally, ADCminimum and ADCinhomogeneity remained, and a histogram model was built by multivariate logistic regression. For the histogram model, the regression coefficients were −0.7426 for ADCminimum, which was significant (p < 0.05), and 1.5657 for ADCinhomogeneity, which was highly significant (p < 0.01) (Table 2). The histogram model achieved an AUC of 0.872 with a 95% CI of 0.792–0.951 (Table 3).
Combined model
The combined model was built based on both the clinical-morphological and histogram features (Table 2, Supplementary Figure 6). The correlation among the five independent variables used in the combined model, i.e., LN-tumour ratio, tumour size, HPV18, ADCminimum, and ADCinhomogeneity, is shown in the chord diagram in Figure 2.
Figure 2.
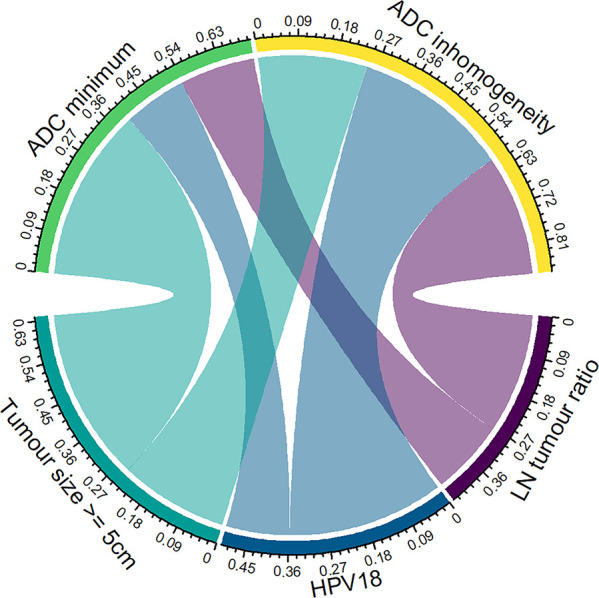
Chord diagram shows the correlation between three clinical-morphological features (Tumour size, HPV18, LN tumour ratio) and two histogram features (ADCminimum and ADCinhomogeneity), but there were no significant correlation within the two groups of features. The values around the circle represent the correlation coefficients. Each link represents a significant correlation according to Pearson’s correlation analysis (p < 0.05). The width of the link and the contact area between an arc and a circle indicate the relative strength between two features.
The results of the comparison between the SCNECC group and the non-SCNECC group regarding their values of ADCminimum, ADCinhomogeneity, and LN-tumour ratio in the combined model are presented in Figure 3. ADCminimum was significantly lower in the SCNECC group than in the non-SCNECC group, whereas ADCinhomogeneity and LN-tumour ratio were significantly higher in the SCNECC group than in the non-SCNECC group (Figure 3).
Figure 3.

Violin plot of the comparison of features (a) ADCminimum, (b) ADCinhomogeneity and (c) LN-tumour ratio. There were significant differences in these features between SCNECC and non-SCNECC in the combined model (p < 0.05). The width of the violin plot represents the probability density. The box plots represent the Q3, median, Q1 (the top, middle, and bottom lines of the box, respectively), the 95% CI (the vertical line on the two sides of the box) and outliers (black dots).
The combined model achieved an AUC of 0.937 (95% CI: 0.887–0.987, accuracy: 0.848, sensitivity: 0.914, specificity: 0.814, PPV: 0.711, NPV: 0.950, cut-off value: 0.2295) (Table 3).
Comparison of diagnostic performance
The diagnostic accuracy and AUC of the combined model were better than those of the clinical-morphological model and histogram model (Table 3). The ROC curves of the three models are presented in Figure 4a. According to the DeLong test, the differences between the combined model and the clinical-morphological model (p = 0.0339) and between the combined model and the histogram model (p = 0.0411) were both statistically significant. The difference in the AUC between the clinical-morphological model and histogram model was not significant (p = 0.9527).
Figure 4.

(a) The ROC curves of the clinical-morphological model, histogram model and combined model. (b) The calibration curves of the three models in predicting SCNECC. The different coloured lines represent the performance of the three models, in which a closer fit to the ideal line represents a better prediction. P values of the Hosmer-Lemeshow test are shown in the legend, and p > 0.05 indicates that the model has a good fitting degree. (c) Decision curve analysis for the three models. Across the various threshold probabilities, the combined model curve showed great net benefit.
The calibration plots of Figure 4b show good accordance between the predicted values and the actual outcomes for SCNECC and non-SCNECC for all three models (Figure 4b). The Hosmer-Lemeshow test suggested that there were no statistically significant differences between the predicted and actual values for the clinical-morphological model (p = 0.117), the histogram model (p = 0.148), and the combined model (p = 0.667), which indicates that all three models had good fitness (Figure 4b).
Three-fold cross-validation showed that the clinical-morphological, histogram, and combined models had good performance, with mean AUCs of 0.8507, 0.8455, and 0.8920, mean sensitivities of 0.9011, 0.9334, and 0.8862, and mean specificities of 0.6220, 0.6156, and 0.6763, respectively. (Supplementary Figure 6)
Clinical applicability of the models
Decision curve analysis (DCA) demonstrated that within a threshold probability range of 9–83%, the combined model showed the greatest net benefit over the treat-all and treat-none schemes in predicting SCNECC, although the two other models also showed good benefit over the treat-all and treat-none schemes (Figure 4c). The nomogram was successfully constructed based on the combined model, allowing easy application of the model in the clinic for diagnosing SCNECC (Figure 5).
Figure 5.

The developed nomogram for predicting the probability of SCNECC. By summing the points of each feature and locating the sum on the total points scale, the estimated probability of SCNECC can be determined.
Discussion
The combined model had high diagnostic performance (AUC = 0.937, sensitivity = 0.914, specificity = 0.814), a good fitting degree (HL p = 0.667), and great net benefit results for clinical decision-making. The superior performance of the combined model may be attributed to the combination of clinical-morphological features and ADC histogram features, allowing the inclusion of more information about SCNECC in the model.
In this study, a nomogram was used to diagnostically differentiate SCNECC from non-SCNECC. The nomogram provides an easy-to-use clinical diagnostic tool and may be useful for preoperatively identifying SCNECC patients who might benefit from early and preoperative diagnosis through the determination of the most appropriate treatment plan. As a result, the improved SCNECC diagnosis method may benefit from cisplatin combined with etoposide chemotherapy that is recommended for SCNECC patients, which may reduce SCNECC mortality due to a delayed or an incorrect diagnosis. 21,22
In the present study, the ADC histogram parameters displayed good discriminability between SCNECC from non-SCNECC, as shown by the following four observations:
First, the ADCmean showed a significant difference (p < 0.001) between the SCNECC group (ADCmean = 0.799×10⁻³ mm2/s) and the non-SCNECC (ADCmean = 0.912×10⁻³ mm2/s) group. Duan et al 12 reported that the ADCmean value of cervical NECC was significantly lower than that of SCC and AC; the cut-off value was 0.900 × 10⁻³ mm2/s, which is different from our results, possibly because the more accurate three-dimensional (3D) whole-lesion ROI analysis was used in our study, whereas a two-dimensional (2D) ROI lesion analysis was used in their study. Moriya et al 23 noted that the arbitrariness of setting the ROI may increase bias and that whole-lesion ADC values were more representative of tumour heterogeneity, which supports our argument that the whole-lesion three-dimensional (3D) ROI setting in this study may have yielded a more accurate diagnosis.
Second, ADC values are inversely related to tumour cellularity. 24,25 The ADCMinimum and low-percentile ADCs may reflect the hypercellular components in the tumour. 26 Small cell neuroendocrine carcinomas are characterized by high cellularity with the presence of small blue cells with very scant or null cytoplasm. 27 Our study showed that the ADCMinimum (p < 0.001) and low-percentile ADCs (ADC5th: p < 0.001; ADC20th: p = 0.015) were significantly lower in the SCNECC group than in the non-SCNECC group. ADCMinimum (OR = 0.362, 95% CI: 0.118–0.980, p = 0.0565) could be an independent diagnostic factor for SCNECC.
Third, the two histogram parameters ADCSD (standard deviation) and ADCInhomogeneity (ADCSD divided by the mean) quantitatively reflect the homogeneity of cellularity distribution in tumours. In our study, both ADCSD (p = 0.001) and ADCInhomogeneity (p < 0.001) showed good performance in identifying SCNECC. This was probably related to an increase in diversification of cellularity, which might have been caused by different subtypes of SCNECC. Matoba et al 28 indicated that the degree of necrosis and/or microstructural change that precedes necrosis may be a factor that influences ADC values in small cell lung carcinoma. The change can be reflected in the parameters of ADC inhomogeneity, which can be observed on T 2-weighted images 29 in SCNECC.
Fourth, some studies have reported that ADCSkewness and ADCKurtosis are useful for differentiating cervical cancers from normal cervical tissues 30 ; however, Guan Y et al reported that ADCskewness was limited in its ability to differentiate cervical adenosquamous carcinoma from squamous cell carcinoma. 31 Our research results were similar to Guan Y et al.’s study. In the present study, ADCSkewness (0.86 vs 0.84, p = 0.833) and ADCKurtosis (1.22 vs 0.94, p = 0.492) were not significant in differentiating SCNECC from non-SCNECC. This may be because both SCNECC and non-SCNECC are malignant tumours that are relatively inhomogeneous.
In addition to the ADC histogram parameters, the MR morphological features revealed in this study were also good indicators for discriminating SCNECC from non-SCNECC, as demonstrated by the following three findings:
First, tumour size is an important prognostic factor in cervical cancer, but there was no significant difference in tumour size between the SCNECC and non-SCNECC groups (p = 0.274) in this study. Duan et al 12 also reported no significant difference (p = 0.763) in tumour size as reflected by MR results between NECC, SCC and AC. However, the tumour size analysis in this study showed a significant difference (p = 0.002) for tumour size >5 cm between the SCNECC and non-SCNECC groups, suggesting that a tumour size greater than 5 cm was a risk factor for SCNECC. Nonetheless, more large-scale research will be needed in the future.
Second, the SCNECC group showed a larger LN short axis than the non-SCNECC group (p = 0.001). This is in line with the clinical observation that SCNECC can easily invade the lymph nodes. This finding supports the hypothesis that it may be easier for SCNECC tumour cells to acquire an immune escape mechanism to avoid the host immune system. 32
Third, primary cervical cancers with small tumour sizes are accompanied by larger metastatic lymph nodes, which is another imaging characteristic observed in this study. The LN-tumour ratio showed a significant difference (p = 0.001) between SCNECC and non-SCNECC, and therefore could be considered a risk factor for SCNECC.
Finally, clinical features also played an important role in distinguishing SCNECC and non-SCNECC. Takayanagi et al 33 reported that 76% of patients with NECC were positive for HPV18. Alejo et al also reported that 41% of NECC patients had HPV18, while only 10% of patients with other histological types of cervical cancer had HPV18. 34 The results of this study are similar in that there was a significant difference (p < 0.001) between the SCNECC (60%) and non-SCNECC groups (13%) in terms of HPV18 positivity. Moreover, HPV18 positivity was significantly more common among the lymphatic permeation predictors of relapse. 35 This might explain why SCNECC has a high rate of lymph node metastases.
Due to the rarity of SCNECC, the patient pool was not as large as we had desired. Nevertheless, it was sufficient to allow meaningful statistical analyses for our model-building process. The power of the combined model and its corresponding nomogram in SCNECC diagnosis may be further improved if resources allow us to incorporate data from more SCNECC patients into the model-building process.
This study has some limitations. As a retrospective multicentre study, selection conditions were needed to ensure a relatively homogeneous patient sample. However, some of the selection conditions, such as the need for a 1.5 T magnetic resonance field, reduced the number of cases in this study. Partially due to the rarity of SCNECC, the sample size of the present study was relatively small, making it difficult to conduct subgroup analysis. External validation would be very beneficial for further generalization of the clinical use of the nomogram.
Conclusions
In conclusion, the nomogram built by whole lesion ADC histogram parameters combined with clinical and morphological features may serve as a non-invasive, reliable tool for individualized preoperative SCNECC prediction in clinical practice.
Footnotes
Acknowledgements: The authors would like to thank Prof Yonglin Chen from Pathology department of the first hospital of Lanzhou University for his help with the pathological diagnosis relevant knowledge of small cell neuroendocrine carcinoma of cervix. We also would like to thank Prof Yun Dang from Gynecologic Oncology Department of the Gansu maternity and child-care hospital for his help with the clinical treatment knowledge of carcinoma of uterine cervix.
The authors Yun-Zhi Li and Peng Liu contributed equally to the work.
Contributors: Yun-Zhi Li, MD, Peng-Liu, MD contributed equally to this research.
Contributor Information
Yun-Zhi Li, Email: liyz-shanshang@163.com.
Peng Liu, Email: liupeng6123@sina.com.
Bao-Hong Mao, Email: mbh2001@163.com.
Li-Li Wang, Email: wanglilihq@163.com.
Jia-Liang Ren, Email: renjialiang@vip.qq.com.
Yong-Sheng Xu, Email: xuys1990@163.com.
Guang-Yao Liu, Email: lgy362263779@163.com.
Zhong-Hong Xin, Email: xinzhonghong2012@163.com.
Jun-Qiang Lei, Email: leijq2011@126.com.
REFERENCES
- 1. Sung H, Ferlay J, Siegel RL, Laversanne M, Soerjomataram I, Jemal A, et al . Global cancer statistics 2020: globocan estimates of incidence and mortality worldwide for 36 cancers in 185 countries . CA Cancer J Clin 2021. ; 71 : 209 – 49 . doi: 10.3322/caac.21660 [DOI] [PubMed] [Google Scholar]
- 2. Albores-Saavedra J, Larraza O, Poucell S, Rodríguez Martínez HA . Carcinoid of the uterine cervix: additional observations on a new tumor entity . Cancer 1976. ; 38 : 2328 – 42 . doi: 10.1002/1097-0142(197612)38:6<2328::aid-cncr2820380620>3.0.co;2-j [DOI] [PubMed] [Google Scholar]
- 3. Scully RE, Aguirre P, DeLellis RA . Argyrophilia, serotonin, and peptide hormones in the female genital tract and its tumors . International Journal of Gynecological Pathology 1984. ; 3 : 51 – 70 . doi: 10.1097/00004347-198403010-00005 [DOI] [PubMed] [Google Scholar]
- 4. Miller B, Dockter M, el Torky M, Photopulos G . Small cell carcinoma of the cervix: a clinical and flow-cytometric study . Gynecol Oncol 1991. ; 42 : 27 – 33 . doi: 10.1016/0090-8258(91)90225-t [DOI] [PubMed] [Google Scholar]
- 5. van Nagell JR, Donaldson ES, Parker JC, van Dyke AH, Wood EG . The prognostic significance of pelvic lymph node morphology in carcinoma of the uterine cervix . Cancer 1977. ; 39 : 2624 – 32 . doi: 10.1002/1097-0142(197706)39:6<2624::aid-cncr2820390648>3.0.co;2-f [DOI] [PubMed] [Google Scholar]
- 6. Gadducci A, Carinelli S, Aletti G . Neuroendrocrine tumors of the uterine cervix: a therapeutic challenge for gynecologic oncologists . Gynecol Oncol 2017. ; 144 : 637 – 46 . doi: 10.1016/j.ygyno.2016.12.003 [DOI] [PubMed] [Google Scholar]
- 7. Burzawa J, Gonzales N, Frumovitz M . Challenges in the diagnosis and management of cervical neuroendocrine carcinoma . Expert Rev Anticancer Ther 2015. ; 15 : 805 – 10 . doi: 10.1586/14737140.2015.1047767 [DOI] [PubMed] [Google Scholar]
- 8. Nccn.org [homepage on the Internet] . NCCN Clinical Practice Guidelines in Oncology (NCCN Guidelines®) Cervical Cancer . Available from : https://www.nccn.org
- 9. Gardner GJ, Reidy-Lagunes D, Gehrig PA . Neuroendocrine tumors of the gynecologic tract: a Society of gynecologic oncology (sgo) clinical document . Gynecol Oncol 2011. ; 122 : 190 – 98 . doi: 10.1016/j.ygyno.2011.04.011 [DOI] [PubMed] [Google Scholar]
- 10. Manganaro L, Lakhman Y, Bharwani N, Gui B, Gigli S, Vinci V, et al . Staging, recurrence and follow-up of uterine cervical cancer using MRI: updated guidelines of the European Society of urogenital radiology after revised FIGO staging 2018 . Eur Radiol 2021. ; 31 : 7802 – 16 . doi: 10.1007/s00330-020-07632-9 [DOI] [PubMed] [Google Scholar]
- 11. Yang DH, Kim JK, Kim KW, Bae SJ, Kim KH, Cho KS . Mri of small cell carcinoma of the uterine cervix with pathologic correlation . AJR Am J Roentgenol 2004. ; 182 : 1255 – 58 . doi: 10.2214/ajr.182.5.1821255 [DOI] [PubMed] [Google Scholar]
- 12. Duan X, Ban X, Zhang X, Hu H, Li G, Wang D, et al . Mr imaging features and staging of neuroendocrine carcinomas of the uterine cervix with pathological correlations . Eur Radiol 2016. ; 26 : 4293 – 4302 . doi: 10.1007/s00330-016-4327-1 [DOI] [PubMed] [Google Scholar]
- 13. Elsherif S, Odisio EGLC, Faria S, Javadi S, Yedururi S, Frumovitz M, et al . Imaging and staging of neuroendocrine cervical cancer . Abdom Radiol (NY) 2018. ; 43 : 3468 – 78 . doi: 10.1007/s00261-018-1667-0 [DOI] [PubMed] [Google Scholar]
- 14. Kitajima K, Kihara T, Kawanaka Y, Kido A, Yoshida K, Mizumoto Y, et al . Neuroendocrine carcinoma of uterine cervix findings shown by MRI for staging and survival analysis-Japan multicenter study . Oncotarget 2020. ; 11 : 3675 – 86 . doi: 10.18632/oncotarget.27613 [DOI] [PMC free article] [PubMed] [Google Scholar]
- 15. Chu C, Feng Q, Zhang H, Zhu Y, Chen W, He J, et al . Whole-volume ADC histogram analysis in parotid glands to identify patients with Sjögren ’ S syndrome . Sci Rep 2019. ; 9 ( 1 . doi: 10.1038/s41598-019-46054-6 [DOI] [PMC free article] [PubMed] [Google Scholar]
- 16. Yang L, Liu D, Fang X, Wang Z, Xing Y, Ma L, et al . Rectal cancer: can T2WI histogram of the primary tumor help predict the existence of lymph node metastasis? Eur Radiol 2019. ; 29 : 6469 – 76 . doi: 10.1007/s00330-019-06328-z [DOI] [PubMed] [Google Scholar]
- 17. Pecorelli S, Zigliani L, Odicino F . Revised FIGO staging for carcinoma of the cervix . Int J Gynaecol Obstet 2009. ; 105 : 107 – 8 . doi: 10.1016/j.ijgo.2009.02.009 [DOI] [PubMed] [Google Scholar]
- 18. Bhatla N, Berek JS, Cuello Fredes M, Denny LA, Grenman S, Karunaratne K, et al . Revised FIGO staging for carcinoma of the cervix uteri . Int J Gynaecol Obstet 2019. ; 145 : 129 – 35 . doi: 10.1002/ijgo.12749 [DOI] [PubMed] [Google Scholar]
- 19. Vickers AJ, van Calster B, Steyerberg EW . A simple, step-by-step guide to interpreting decision curve analysis . Diagn Progn Res 2019. ; 3 : 18 . doi: 10.1186/s41512-019-0064-7 [DOI] [PMC free article] [PubMed] [Google Scholar]
- 20. Ying G, Maguire M, Quinn G, Kulp MT, Cyert L, Vision In Preschoolers (VIP) Study Group . Roc analysis of the accuracy of noncycloplegic retinoscopy, retinomax autorefractor, and suresight vision screener for preschool vision screening . Invest Ophthalmol Vis Sci 2011. ; 52 : 9658 – 64 . doi: 10.1167/iovs.11-8559 [DOI] [PMC free article] [PubMed] [Google Scholar]
- 21. Salvo G, Gonzalez Martin A, Gonzales NR, Frumovitz M . Updates and management algorithm for neuroendocrine tumors of the uterine cervix . Int J Gynecol Cancer 2019. ; 29 : 986 – 95 . doi: 10.1136/ijgc-2019-000504 [DOI] [PubMed] [Google Scholar]
- 22. Ishikawa M, Kasamatsu T, Tsuda H, Fukunaga M, Sakamoto A, Kaku T, et al . Prognostic factors and optimal therapy for stages I-II neuroendocrine carcinomas of the uterine cervix: a multi-center retrospective study . Gynecol Oncol 2018. ; 148 : 139 – 46 . doi: 10.1016/j.ygyno.2017.10.027 [DOI] [PubMed] [Google Scholar]
- 23. Moriya T, Saito K, Tajima Y, Harada TL, Araki Y, Sugimoto K, et al . 3D analysis of apparent diffusion coefficient histograms in hepatocellular carcinoma: correlation with histological grade . Cancer Imaging 2017. ; 17 : 1 . doi: 10.1186/s40644-016-0103-3 [DOI] [PMC free article] [PubMed] [Google Scholar]
- 24. Sala E, Rockall AG, Freeman SJ, Mitchell DG, Reinhold C . The added role of Mr imaging in treatment stratification of patients with gynecologic malignancies: what the radiologist needs to know . Radiology 2013. ; 266 : 717 – 40 . doi: 10.1148/radiol.12120315 [DOI] [PubMed] [Google Scholar]
- 25. Nakamura K, Joja I, Nagasaka T, Fukushima C, Kusumoto T, Seki N, et al . The mean apparent diffusion coefficient value (adcmean) on primary cervical cancer is a predictive marker for disease recurrence . Gynecol Oncol 2012. ; 127 : 478 – 83 . doi: 10.1016/j.ygyno.2012.07.123 [DOI] [PubMed] [Google Scholar]
- 26. Zhang Y-D, Wu C-J, Wang Q, Zhang J, Wang X-N, Liu X-S, et al . Comparison of utility of histogram apparent diffusion coefficient and r2* for differentiation of low-grade from high-grade clear cell renal cell carcinoma . AJR Am J Roentgenol 2015. ; 205 : W193 – 201 . doi: 10.2214/AJR.14.13802 [DOI] [PubMed] [Google Scholar]
- 27. Raso MG, Bota-Rabassedas N, Wistuba II . Pathology and classification of SCLC . Cancers (Basel) 2021. ; 13 : 820 . doi: 10.3390/cancers13040820 [DOI] [PMC free article] [PubMed] [Google Scholar]
- 28. Matoba M, Tonami H, Kondou T, Yokota H, Higashi K, Toga H, et al . Lung carcinoma: diffusion-weighted MR imaging -- preliminary evaluation with apparent diffusion coefficient . Radiology 2007. ; 243 : 570 – 77 . doi: 10.1148/radiol.2432060131 [DOI] [PubMed] [Google Scholar]
- 29. Herneth AM, Guccione S, Bednarski M . Apparent diffusion coefficient: a quantitative parameter for in vivo tumor characterization . Eur J Radiol 2003. ; 45 : 208 – 13 . doi: 10.1016/s0720-048x(02)00310-8 [DOI] [PubMed] [Google Scholar]
- 30. Guan Y, Shi H, Chen Y, Liu S, Li W, Jiang Z, et al . Whole-lesion histogram analysis of apparent diffusion coefficient for the assessment of cervical cancer . J Comput Assist Tomogr 2016. ; 40 : 212 – 17 . doi: 10.1097/RCT.0000000000000349 [DOI] [PubMed] [Google Scholar]
- 31. Xiao M, Ma X, Ma F, Li Y, Zhang G, Qiang J . Whole-tumor histogram analysis of apparent diffusion coefficient for differentiating adenosquamous carcinoma and adenocarcinoma from squamous cell carcinoma in patients with cervical cancer . Acta Radiol 2022. ; 63 : 1415 – 24 . doi: 10.1177/02841851211035915 [DOI] [PubMed] [Google Scholar]
- 32. Ferns DM, Heeren AM, Samuels S, Bleeker MCG, de Gruijl TD, Kenter GG, et al . Classical and non-classical HLA class I aberrations in primary cervical squamous- and adenocarcinomas and paired lymph node metastases . J Immunother Cancer 2016. ; 4 : 78 . doi: 10.1186/s40425-016-0184-3 [DOI] [PMC free article] [PubMed] [Google Scholar]
- 33. Takayanagi D, Hirose S, Kuno I, Asami Y, Murakami N, Matsuda M, et al . Comparative analysis of genetic alterations, HPV-status, and PD-L1 expression in neuroendocrine carcinomas of the cervix . Cancers (Basel) 2021. ; 13 : 1215 . doi: 10.3390/cancers13061215 [DOI] [PMC free article] [PubMed] [Google Scholar]
- 34. Alejo M, Alemany L, Clavero O, Quiros B, Vighi S, Seoud M, et al . Contribution of human papillomavirus in neuroendocrine tumors from a series of 10,575 invasive cervical cancer cases . Papillomavirus Research 2018. ; 5 : 134 – 42 . doi: 10.1016/j.pvr.2018.03.005 [DOI] [PMC free article] [PubMed] [Google Scholar]
- 35. Lai C-H, Chang C-J, Huang H-J, Hsueh S, Chao A, Yang J-E, et al . Role of human papillomavirus genotype in prognosis of early-stage cervical cancer undergoing primary surgery . J Clin Oncol 2007. ; 25 : 3628 – 34 . doi: 10.1200/JCO.2007.11.2995 [DOI] [PubMed] [Google Scholar]
Associated Data
This section collects any data citations, data availability statements, or supplementary materials included in this article.