

Abstract
Objective:
Investigate the performance of multiparametric MRI radiomic features, alone or combined with current standard-of-care methods, for pulmonary nodule classification. Assess the impact of segmentation variability on feature reproducibility and reliability.
Methods:
Radiomic features were extracted from 74 pulmonary nodules of 68 patients who underwent nodule resection or biopsy after MRI exam. The MRI features were compared with histopathology and conventional quantitative imaging values (maximum standardized uptake value [SUVmax] and mean Hounsfield unit [HU]) to determine whether MRI radiomic features can differentiate types of nodules and associate with SUVmax and HU using Wilcoxon rank sum test and linear regression. Diagnostic performance of features and four machine learning (ML) models were evaluated with area under the receiver operating characteristic curve (AUC) and 95% confidence intervals (CIs). Concordance correlation coefficient (CCC) assessed the segmentation variation impact on feature reproducibility and reliability.
Results:
Elevn diffusion-weighted features distinguished malignant from benign nodules (adjusted p < 0.05, AUC: 0.73–0.81). No features differentiated cancer types. Sixty-seven multiparametric features associated with mean CT HU and 14 correlated with SUVmax. All significant MRI features outperformed traditional imaging parameters (SUVmax, mean HU, apparent diffusion coefficient [ADC], T1, T2, dynamic contrast-enhanced imaging values) in distinguishing malignant from benign nodules with some achieving statistical significance (p < 0.05). Adding ADC and smoking history improved feature performance. Machine learning models demonstrated strong performance in nodule classification, with extreme gradient boosting (XGBoost) having the highest discrimination (AUC = 0.83, CI=[0.727, 0.932]). We found good to excellent inter- and intrareader feature reproducibility and reliability (CCC≥0.80).
Conclusion:
Eleven MRI radiomic features differentiated malignant from benign lung nodules, outperforming traditional quantitative methods. MRI radiomic ML models demonstrated good nodule classification performances with XGBoost superior to three others. There was good to excellent inter- and intrareader feature reproducibility and reliability.
Advances in knowledge:
Our study identified MRI radiomic features that successfully differentiated malignant from benign lung nodules and demonstrated high performance of our MR radiomic feature-based ML models for nodule classification. These new findings could help further establish thoracic MRI as a non-invasive and radiation-free alternative to standard practice for pulmonary nodule assessment.
Introduction
Over 130,000 Americans will die of lung cancer in 2022, accounting for more deaths than any other cancer. 1 With increasing use and improved resolution of computed tomography (CT) growing numbers of lung nodules are detected with the crucial question being whether these nodules are cancerous. 2 The current lung cancer detection and management paradigm relies heavily on CT and/or positron emission tomography (PET). Neither CT nor PET accurately distinguish benign from malignant lung nodules 3–7 while exposing patients to cumulative radiation, high cost of PET-CT and invasive biopsies and lung resections. 8–14 Magnetic resonance imaging (MRI) is an attractive alternative to CT and PET due to its potential to provide physiologic and morphologic information noninvasively without radiation exposure. 15 Recent studies demonstrate MRI is comparable or superior to current imaging modalities for pulmonary nodule characterization and management while being more economical compared to PET. 12,16–20
Radiomics, using machine learning (ML) methods to extract data from images that are otherwise undetectable visually, is gaining attention in medicine. 21 While radiomic techniques have been applied to CT and PET, 22–25 there is scarcity of studies on MRI radiomics for pulmonary nodule evaluation. Recently, a few studies have shown promising results on MRI radiomics’ capability in differentiating malignant from benign nodules. However, the majority of these studies only included unenhanced T1- and T2- weighted sequences with few, if any, investigating diffusion-weighted (DWI) and contrast-enhanced radiomics. 21,25,26 While nearly all of these studies utilized manual nodule segmentation, it is unknown whether segmentation variations affect the extracted MRI radiomic features. Therefore, we provide a comprehensive study investigating the performance of multiparametric-MRI radiomic features derived from unenhanced and enhanced T1 (T1WI, T1WI + C)-, T2 (T2WI)- and DWI images: (1) to establish the MR radiomic features that distinguish malignant from benign lung nodules, differentiate types of lung cancers and associate with conventional CT and PET-CT quantitative values; (2) to examine whether MRI radiomic features alone or in combination with conventional MRI parameters, PET-CT findings, and/or clinical data can improve MRI’s diagnostic performance; (3) to examine the nodule classification diagnostic performance of MRI radiomic features using ML models and (4) to assess the effect of intra- and interreader segmentation variability on reproducibility and reliability of MRI radiomics.
Methods and materials
The requirement for written informed consent was waived for this institutional review board approved, Health Insurance Portability and Accountability Act compliant retrospective study.
Data curation
Magnetic resonance images obtained between May 2016 and May 2018 for 68 patients who satisfied our inclusion criteria (adults 18 years or older with one or more pulmonary nodules < 3 cm in diameter on CT and/or PET-CT scheduled for surgical resection or biopsy) were utilized. Exclusion criteria included claustrophobia, contraindication for intravenous contrast, and non-MRI-compatible implanted objects. All MRIs were obtained using a single 3.0 T whole body scanner (Siemens Magnetom Skyra, Siemens Medical Solutions, Erlangen, Germany) utilizing previously published methods. 12 Fat-saturated T2-weighted imaging using periodically rotated overlapping parallel lines with enhanced reconstruction (PROPELLER), T1-weighted 3D volumetric interpolated breath-hold examination (VIBE) using CAIPIRINHA (controlled aliasing in parallel imaging results in a higher acceleration) with and without contrast and respiratory triggered diffusion-weighted 2D single shot echoplanar imaging with diffusion-sensitizing gradients in three orthogonal directions and various b-values (b = 0, 50, 100, 400 and 600 s/mm2) were acquired for all patients (Table 1). Additional dynamic contrast-enhanced (DCE) images were acquired for 37 patients following baseline T1 estimate with unenhanced axial VIBE at three flip angles (2°, 5°, 12°). Multiple acquisitions with the same sequence using a 12 degree flip angle was performed to image the contrast agent dynamics with a 20-s temporal resolution (10 s for breath-hold data acquisition [3.85 ms TR X 169 phase encoding steps X 32 slice encoding steps X 1.625 slice oversampling X ½ slice resolution reduction X 5/8 slice partial k-space] followed by 10 s for catch-up breath). Following two acquisitions, a bolus of gadobutrol (0.1 mmol per kg body weight; Gadavist, Bayer, Berlin, Germany) was administered to all patients at a rate of 1.5 ml s−1Twenty acquisitions were acquired per study.
Table 1.
Magnetic Resonance Imagingparameters
| Sequences | TR/TE (ms/ms) | Flip angles (degrees) | Slice thickness (mm) | Parallel imaging mode | Matrix | FOV |
|---|---|---|---|---|---|---|
| T2 weighted HASTE localization | 1000/85 | 159 | 6 | GRAPPA 2 | 256 × 256 | 43 |
| T2 weighted multishot 2D TSE with fat saturation | 2470/90 | 123 | 4 | GRAPPA 3 | 256 × 256 | 38 |
| DWI 2D SS-EPI | 2000/56 | 9.5 | 5 | GRAPPA 3 | 128 × 128 | 38 |
| Precontrast 3D VIBE-Dixon | 3.85/2.36 | 2/5/12 | 3 | CAIPIRINHA 2 | 256 × 256 | 35 |
| DCE 3D VIBE | 3.85/2.36 | 12 | 3 | CAIPIRINHA 2 | 256 × 256 | 35 |
CAIPIRINHA = Controlled Aliasing in Parallel Imaging Results in Higher Acceleration; DCE = dynamic contrast enhancement;FOV = field of view; GRAPPA = GeneRalized Autocalibrating Partial Parallel Acquisition; HASTE = half-Fourier single-shot turbo spin echo; SS-EPI = single shot echoplanar imaging; TSE = turbo spin echo; VIBE = volumetric interpolated breath-hold examination.
To calculate the apparent diffusion coefficient (ADC), a region of interest (ROI) encompassing the entire lesion was first placed on each DWI by a thoracic radiologist with 10 years of thoracic imaging experience (CWK), keeping the ROIs constant over the range of b values. The signal intensities derived from the ROI as a function of b value were then fitted to the monoexponential decay model whose decay rate was the ADC as derived from the equation with ADC and S0 as free parameters: Sb = S0 exp (-b x ADC) where Sb is the signal intensity for a given b factor and S0 is the signal intensity without diffusion weighting. Diffusion distortion correction was not performed prior to ADC calculation as such methods were experimental and unavailable at the time of ADC calculation. The DCE data were analyzed by the MR Tissue 4D software (Syngo.via, Siemens Healthcare, Erlangen, Germany) to yield the Tofts model-based wash-in, washout and arrival times (AT), time-to-peak (TTP), peak enhancement intensity (PEI), Ktrans, Kep, Ve. Nodule to muscle signal intensity ratios in T1WI (T1/M) and T2WI (T2/M) were calculated and the mean Hounsfield units (HUs) were derived from the unenhanced CT by placing ROI directly on the nodules as described previously. 12 Histopathology and 18FDG-PET information were extracted from patient’s medical records. A maximum standardized uptake value ≥2.5 was considered as positive.
Utilizing an open-source 3D segmentation software (ITK-SNAP, v. 3.8.0, USA), a medical image analyst (AJV), blinded to clinical data, performed manual volumetric segmentation of all lung nodules on all MRI (Figure 1) under the guidance of an experienced thoracic radiologist with >10 years of thoracic MRI experience (CWK).
Figure 1.

A part-solid right upper lobe pathologically proven invasive adenocarcinoma outlined on computed tomography (a) was negative on positron emission tomography (b) but was correctly identified as malignant by magnetic resonance imaging (MRI) radiomics (true positive). The lesion demonstrated enhancement on post-contrast MRI (c) and hyperintensity on diffusion-weighted MRI (d). Sample of 3D-segmentation, which encompassed the entire volume of the nodule (e). Gray-level co-occurrence matrix maximum correlation texture map overlaid on the same malignant nodule (f).
Radiomic feature extraction
The MR images were intensity normalized to have the same 99th percentile grayscale value and were discretized using a fixed bin-width so that each bin captured the same intensity range after intensity normalization. First-order texture features were extracted from the entire segmented volume of interest (VOI). Texture feature filters were calculated in a slice-by-slice fashion for every slice to account for the anisotropic nature of voxel size. For each image, four gray level co-occurrence matrix (GLCM) corresponding to four directions were calculated, and six features (contrast, dissimilarity, homogeneity, energy, correlation and angular second moment) were derived from the GLCMs. We extracted first- and second-order features because these features were shown to be stable and repeatable on MRI compared to low repeatability of higher order features. 27 Shape-based features were not extracted as air may affect DWI leading to unreliable lesion edges and shapes. 28 Texture-filtered maps of the images were created with a small window size (filter radius of 2) to minimize border effects. In the case of second-order features, averaging over the four directions was performed, rendering the derived textures direction-invariant. For each of the nodule segmentation VOI, the mean, median, standard deviation (SD), skewness, and the 25th and 75th percentiles were calculated for the filtered textures. For DWI, feature extraction was performed on DWI only (not on the ADC maps) across all acquired b-values. All feature extraction was performed using an in-house tool, built using the Python programming language (v. 3.9.1; Python Software Foundation, Wilmington, DE), and with image biomarker standardization initiative recommendations, particularly the use of fixed bin-width after standardization of image intensity. All image features were calculated using the scikit-image software library.
Radiomic analysis
Feature association with pathology and conventional imaging-derived parameters
Each feature was tested separately using Wilcoxon rank sum test for binary outcomes with pathology as the ground truth and univariable linear regression for continuous outcomes to determine the individual MRI radiomic features that distinguish malignant from benign nodules, differentiate types of lung cancers, and associate with available quantitative values derived from conventional imaging (maximum standardized uptake value [SUVmax] and mean HU). Two individual significant features were then grouped in various combinations into bivariable logistic regression models and the likelihood ratio test was used to examine if addition of a second feature improved association. No more than two features were grouped due to sample size limitation. All analyses were performed at the lesion level and intrasubject correlation was discounted given the rare occurrence of multiple lesions per patient. Given the high dimensionality of the MRI radiomic feature space, we employed false discovery rate (FDR) control methods to mitigate Type I error inflation while preserving discovery power. The MRI features were considered significantly associated with nodule characteristics at FDR < 0.05, using the Benjamini-Hochberg step-up procedure on regression-based p-values.
MRI radiomic feature diagnostic performance
Diagnostic performance of the individual significant features was assessed with area under the receiver operating characteristic curve (AUC) and associated 95% confidence intervals (CIs). Conventional MRI biomarkers, PET, CT and clinical data were evaluated for diagnostic performance using AUC and compared to the significant MRI radiomic features using DeLong’s test. Adjustment for multiple comparisons was not performed. The conventional markers were also added to the radiomic features using bivariable logistic regression and the discriminatory potential of these models for malignant nodules was quantified using AUC statistic. Multiple imputation procedure was performed for the missing DCE values using predictive mean matching (mice package in R). Twenty imputations were performed for each variable and logistic regression models were fitted for each imputed data set. The results were pooled using Rubin’s Rules (psfmi package in R) and the pooled AUC and 95% CI were presented.
Machine learning model diagnostic performance
Four models commonly used for classification (elastic net [Enet], random forest [RF], least squares support vector machine with radial basis function kernel [SVM] and extreme gradient boosting [XGBoost]) were employed (caret package in R) to evaluate diagnostic performance of malignant and benign nodule classification using all radiomic features. Data pre-processing included feature centering and scaling. A nested cross-validation (NCV) procedure was used for model fitting and performance evaluation. The outer layer had a fivefold stratified random cases and controls splits, such that each model was trained and evaluated on leave out test-set five distinct times. Outer fold cohorts were compared for the outcome, gender, and smoking status via χ2 test to ensure that there were no significant differences between the cohorts. Repeated 10-fold CV with five repeats trained, validated and tuned the hyperparameters within the inner layer of the NCV with the goal of maximizing the AUC. Cross-validated AUC and 95% CI using LeDell et al’s methods (cvAUC package in R) evaluated the overall performance. 29 Two additional XGBoost models were fitted, one using only non-radiomic features and another using all radiomic as well as all non-radiomic features. Variable importance for each XGBoost model was calculated using the default Gain measurement from the caret package, which are scaled from 0 to 100.
Reproducibility and reliability of MRI radiomic feature extraction
In addition to the medical image analyst, a medical trainee (JHY), blinded to clinical data, independently segmented all lung nodules manually under a thoracic radiologist’s (CWK) supervision. Each reader repeated nodule segmentation after at least 3 weeks (to avoid memory bias) to assess reliability of radiomic feature extraction with variable nodule segmentation. Lin’s concordance correlation coefficient (CCC) evaluated intra- and interreader segmentation agreement. Growing consensus in the radiomics literature indicates a CCC of >0.8 or >0.9 is reflective of good overall concordance. 30,31 Therefore, we summarize the counts of features such that a CCC of >0.90 represented excellent, 0.9–0.8 good and <0.80 poor concordance. p-values of ≤0.05 represented significance, accounting for multiple testing correction where appropriate. All statistical analyses, imputation and model development were completed using R v. 4.0.3 (R Foundation for Statistical Computing, Vienna, Austria). MRI radiomic feature pulmonary nodule classification is summarized in Figure 2.
Figure 2.

Summary of MR radiomic feature evaluation for pulmonary nodule classification. (I) Image acquisition and lesion segmentation; (II) extraction of first- and second-order quantitative radiomic features; (III) MR feature-based machine learning model development, performance evaluation of radiomic features alone or in combination with clinical and/or traditional imaging data and machine learning models; (IV) significant MR radiomic feature identification, performance of features and machine learning classifier models. Enet = elastic net; RF = random forest; SVM = support vector machine; XGBoost = extreme gradient boosting.
Results
Seventy-four nodules (59 solid, 14 part-solid, and 1 pure ground-glass) from 68 patients (40 females, mean age of 61.9 ± 11 years [range: 27–80 years]) were available (3 patients had >1 nodule). The mean nodule size was 1.7 cm (range: 0.4–2.9 cm), with the majority (74%) < 2 cm. Forty-nine nodules were pathologically proven malignant (see Supplementary Table 1 for nodule pathology). There were no statistically significant differences between the number of malignant and benign nodules amongst all five cross-validation folds (p > 0.05). The mean nodule HU was −45.585 (range −386.6 to 69.2). Thirty-one of 64 nodules with available PET data demonstrated PET positivity.
Radiomic features analysis
Seventy-two texture features were extracted from each MRI sequence, yielding a total of 360 candidate radiomic features. After applying the Benjamini-Hochberg FDR control, 11 DWI features significantly distinguished malignant from benign nodules (adjusted p < 0.05, AUC: 0.73–0.81), including 7 second-order GLCM features (homogeneity SD, energy SD, correlation skew, correlation mean, correlation median, correlation maximum and correlation 75th percentile) from DWI with b = 0 (DWI B0) and 4 GLCM features (correlation mean, correlation median, correlation maximum and correlation 75th percentile) from DWI with b = 50 (DWI B50) (Figure 3, Table 2). All discriminating features demonstrated nearly perfect intrareader reliability and good to excellent interreader reproducibility (Table 2). Discriminating radiomic features increased to 22 when 2 of the aforementioned features were combined (Supplementary Table 1). The T1WI, T1WI + C and T2WI radiomic features were not significantly different between benign and malignant nodules (adjusted p > 0.05). For the 49 malignant lesions, there were no significant feature differences between primary and metastatic nodules (adjusted p > 0.05). For the 32 primary lung cancers, none of the radiomic features, alone or in combination, differentiated between adenocarcinoma and non-adenocarcinomas (adjusted p > 0.05). Sixteen unenhanced T1WI, 9 T1WI + C, 2 T2WI, 24 DWI B0, 16 DWI B50 radiomic features significantly associated with mean CT HU (Table 3). Two T1WI, 5 T1WI + C and 3 T2WI radiomic features significantly associated with PET positivity. One T1WI, 11 T1WI + C and 1 DWI B0 associated with SUVmax.
Figure 3.
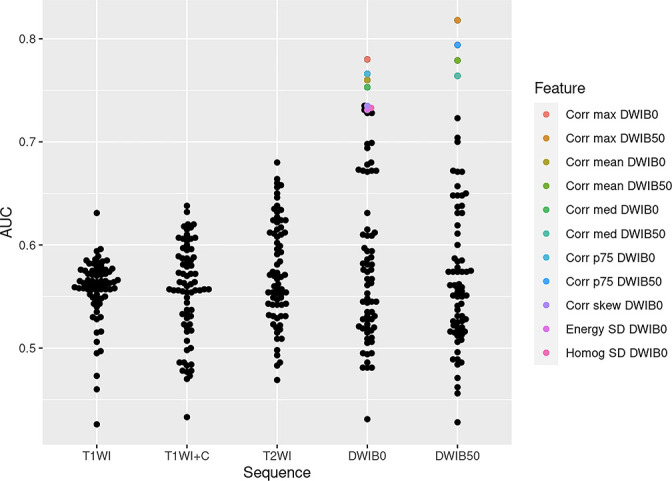
Performance of individual radiomic features for differentiating malignant from benign pulmonary nodules. Each dot in this beeswarm plot represents an individual AUC value for each radiomic feature stratified by MRI sequence. The significant features (adjusted p < 0.05) are highlighted in color while features not statistically significant are in black. Note the AUC of the significant features are higher than those for the non-significant features. AUC = area under the receiver operating characteristic curve; Corr max DWIB0 = Correlation maximum DWI B0; Corr max DWIB50 = Correlation maximum DWI B50; Corr mean DWIB0 = Correlation mean DWI B0; Corr mean DWIB50 = Correlation mean DWI B50; Corr med DWIB0 = Correlation median DWI B0; Corr med DWIB50 = Correlation median DWI B50; Corr p75 DWIB0 = Correlation 75th percentile DWI B0; Corr p75 DWIB50 = Correlation 75th percentile DWI B50; Corr skew DWIB0 = Correlation skew DWIB0; Energy SD DWIB0 = Energy SD DWI B0; Homog SD DWIB0 = Homogeneity SD DWI B0; T1WI = T1-weighted image; T1WI + C=enhanced T1-weighted image; T2WI = T2-weighted image; DWI = diffusion-weighted image
Table 2.
Performance, reproducibility and reliability of individual radiomic features capable of differentiating malignant from benign pulmonary nodules
| Radiomic features | AUC (95% CI) | p-values | R1 CCC (95% CI) | R2 CCC (95% CI) | R12 CCC (95% CI) |
|---|---|---|---|---|---|
| Correlation maximum DWI B0 | 0.780 (0.672, 0.887) | 0.004 | 0.998 (0.998, 0.999) | 0.918 (0.873, 0.947) | 0.919 (0.876, 0.948) |
| Correlation maximum DWI B50 | 0.818 (0.718, 0.917) | <0.001 | 0.999 (0.998, 0.999) | 0.925 (0.883, 0.952) | 0.842 (0.763, 0.897) |
| Correlation mean DWI B0 | 0.760 (0.645, 0.876) | 0.001 | 0.999 (0.998, 0.999) | 0.979 (0.967, 0.987) | 0.946 (0.915, 0.966) |
| Correlation mean DWI B50 | 0.779 (0.663, 0.895) | <0.001 | 0.997 (0.996, 0.998) | 0.980 (0.969, 0.988) | 0.944 (0.913, 0.965) |
| Correlation median DWI B0 | 0.753 (0.636, 0.869) | 0.001 | 0.999 (0.998, 0.999) | 0.981 (0.970, 0.988) | 0.932 (0.894, 0.957) |
| Correlation median DWI B50 | 0.764 (0.645, 0.883) | <0.001 | 0.998 (0.997, 0.999) | 0.984 (0.974, 0.990) | 0.941 (0.908, 0.963) |
| Correlation 75th percentile DWI B0 | 0.766 (0.651, 0.881) | 0.001 | 0.999 (0.999, 0.999) | 0.979 (0.968, 0.987) | 0.959 (0.936, 0.974) |
| Correlation 75th percentile DWI B50 | 0.794 (0.682, 0.907) | <0.001 | 0.996 (0.994, 0.998) | 0.963 (0.942, 0.976) | 0.880 (0.816, 0.923) |
| Correlation skew DWIB0 | 0.735 (0.616, 0.855) | 0.004 | 0.995 (0.992, 0.997) | 0.897 (0.845, 0.933) | 0.866 (0.795, 0.914) |
| Energy SD DWI B0 | 0.731 (0.609, 0.852) | 0.015 | 0.997 (0.995, 0.998) | 0.926 (0.884, 0.953) | 0.822 (0.734, 0.883) |
| Homogeneity SD DWI B0 | 0.733 (0.616, 0.851) | 0.003 | 0.997 (0.995, 0.998) | 0.890 (0.830, 0.929) | 0.842 (0.765, 0.896) |
AUC = area under the receiver operating characteristic curve; CCC = Lin’s concordance correlation coefficient; CI = confidence interval; DWI = diffusion-weighted imaging; R1 = Reader 1 intrareader; R2 = Reader 2 intrareader; R12 = interreader-reader.
Table 3.
MRI radiomic features associated significantly with standard imaging parameters (p < 0.05)
| Standard imaging | T1WI | T1WI + C | T2WI | DWI B0 | DWI B50 |
|---|---|---|---|---|---|
| CT HU | Asymmetry median Asymmetry minimum Asymmetry 25th percentile Entropy mean Entropy median Entropy maximum Entropy 25th percentile Entropy 75th percentile Gradient SD Homogeneity minimum Energy minimum Energy 25th percentile Correlation skew Correlation median Correlation maximum Correlation 25th percentile |
Entropy mean Entropy median Entropy maximum Entropy 75th percentile Correlation mean Correlation median Correlation maximum Correlation 25th percentile Correlation 75th percentile |
Contrast SD Contrast max |
Entropy maximum Entropy seventh percentile Gradient mean Gradient mean Gradient SD Gradient maximum Gradient 25th percentile Gradient 75th percentile Contrast mean Contrast SD Contrast 75th percentile Dissimilarity mean Dissimilarity median Dissimilarity SD Dissimilarity maximum Dissimilarity 25th percentile Dissimilarity 75th percentile Homogeneity mean Homogeneity median Homogeneity minimum Homogeneity 25th percentile Energy minimum Energy 25th percentile Asymmetry mean |
Gradient mean Gradient median Gradient maximum Gradient 25th percentile Gradient 75th percentile Contrast SD Dissimilarity mean Dissimilarity median Dissimilarity SD Dissimilarity maximum Dissimilarity 25th percentile Dissimilarity 75th percentile Homogeneity mean Homogeneity median Homogeneity minimum Homogeneity 25th percentile |
| PET positivity | Entropy maximum Correlation SD |
Entropy kurtosis Entropy skew Energy minimum Asymmetry minimum Correlation maximum |
Correlation mean Correlation SD Correlation 25th percentile |
||
| SUVmax | Gradient SD | Entropy kurtosis Entropy skew Entropy minimum Homogeneity kurtosis Homogeneity skew Energy skew Energy maximum Correlation maximum Asymmetry kurtosis Asymmetry skew Asymmetry maximum |
Gradient kurtosis |
T1WI + C=T 1 weighted imaging with contrast; DWI = diffusion-weighted imaging; HU = mean Hounsfield unit; SD = standard deviation;SUVmax = maximum standardized uptake unit; T1WI = T 1 weighted imaging without contrast; T2WI = T 2 weighted imaging; skew = skewness.
The order of the abbreviations is wrong and I am not able to modify it. The T1W1 + C abbreviation should be with the other T1 and T2 abbreviations and the skewness abbreviations should go before SD.
All significant MRI radiomic features outperformed traditional MRI parameters in distinguishing malignant from benign nodules, with some achieving statistical significance (Figure 4, Supplementary Table 3). Nearly all significant MRI radiomic features outperformed T1/M and T2/M (p < 0.05). Correlation median, correlation maximum and correlation 75th percentile for DWI B0 and DWI B50, correlation mean DWI B0 surpassed SUVmax performance (p < 0.05, Figure 1). Correlation mean DWI B50, correlation maximum DWI B50 and correlation 75th percentile DWI B50 statistically outperformed mean CT HU. Correlation skewness DWI B0 had statistically better performance than dynamic contrast wash-in while correlation maximum DWI B50 statistically outperformed ADC.
Figure 4.
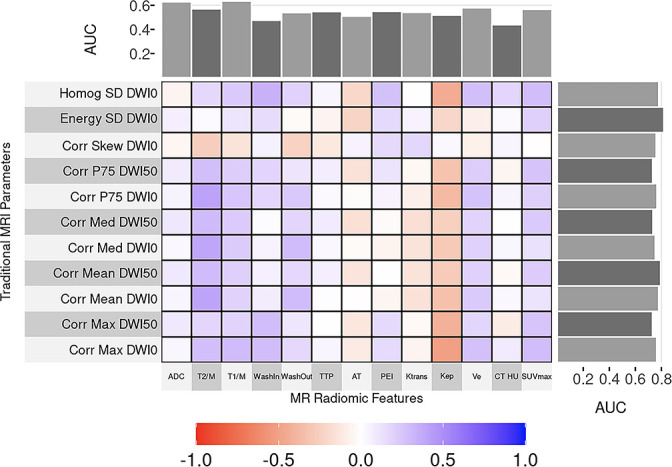
Correlation and comparison of MR radiomic features and traditional quantitative imaging parameters performance. The heat map displays correlations between radiomic and traditional imaging parameters where the closer one is to purple, the better the correlation. The AUC values are included as marginal plots, with the traditional quantitative imaging parameter AUC on the top and the MR radiomic AUC on the side-of the map. Note that all MR radiomic AUC are higher than those for traditional quantitative parameters. AUC = area under the receiver operating characteristic curve; Homog SD DWI0 = Homogeneity SD DWI B0; Energy SD DWI0 = Energy SD DWI B0; Corr skew DWI0 = Correlation skew DWIB0; Corr p75 DWI50 = Correlation 75th percentile DWI B50; Corr p75 DWI0 = Correlation 75th percentile DWI B0; Corr med DWI50 = Correlation median DWI B50; Corr med DWI0 = Correlation median DWI B0; Corr mean DWI50 = Correlation mean DWI B50; Corr mean DWI0 = Correlation mean DWI B0; Corr max DWI50 = Correlation maximum DWI B50; Corr max DWI0 = Correlation maximum DWI B0; ADC = apparent diffusion coefficient; T2M = nodule to muscle signal intensity ratios in T2-weighted images; T1M = nodule to muscle signal intensity ratios in T1-weighted images; Washin = dynamic contrast wash-in; Washout = dynamic contrast washout; TTP = time to peak; AT = arrival times; PEI = peak enhancement intensity; HU = mean Hounsfield unit; SUVmax = maximum standardized uptake value
The addition of various clinical (gender, smoking status) or imaging parameters (ADC, T2/M, T1/M, wash-in, washout, TTP, AT, PEI, ktrans, kep, ve, mean HU and SUVmax) variably impacted the discriminating performance of MRI radiomics for benign and malignant nodules (Supplementary Table 4), with the addition of smoking history and ADC values consistently improved discrimination, although such improvements did not achieve statistical significance (p > 0.05).
Of the four MRI radiomic feature ML models, XGBoost model demonstrated the best performance in distinguishing malignant from benign nodules (Table 4, Figure 5), with AUC of 0.83 (95% CI 0.727 to 0.932). We found similar good performance for the other three models: RF AUC = 0.771(CI = 0.651 to 0.891); Enet AUC = 0.761(CI = 0.642 to 0.881); SVM = 0.717 (CI 0.583 to 0.851). The five most important features in the radiomic XGBoost model in order were: correlation max DWIB0, homogeneity kurtosis T1WI + C, homogenous SD DWIB0, correlation 75th percentile DWIB0, and correlation kurtosis DWIB0 (Figure 6). Note that in the combined radiomics and non-radiomics model, none of the traditional quantitative imaging parameters was listed as a top importance feature except for contrast wash-in.
Table 4.
Machine learning model performance in distinguishing malignant from benign nodules
| Machine learning models | AUC | 95% confidence intervals |
|---|---|---|
| Extreme gradient boosting | 0.830 | 0.727, 0.932 |
| Random forest | 0.771 | 0.651, 0.891 |
| Elastic net | 0.761 | 0.642, 0.881 |
| Support vector machine | 0.717 | 0.583, 0.851 |
AUC = area under the receiver operating characteristic curve
Figure 5.

Diagnostic performance of machine learning models for classifying malignant and benign pulmonary nodules based on MR radiomic features. The number adjacent to each machine learning model is the area under the receiver operating characteristic curve. Enet = elastic net; SVM = support vector machine; RF = random forest; XGBoost = extreme gradient boosting.
Figure 6.
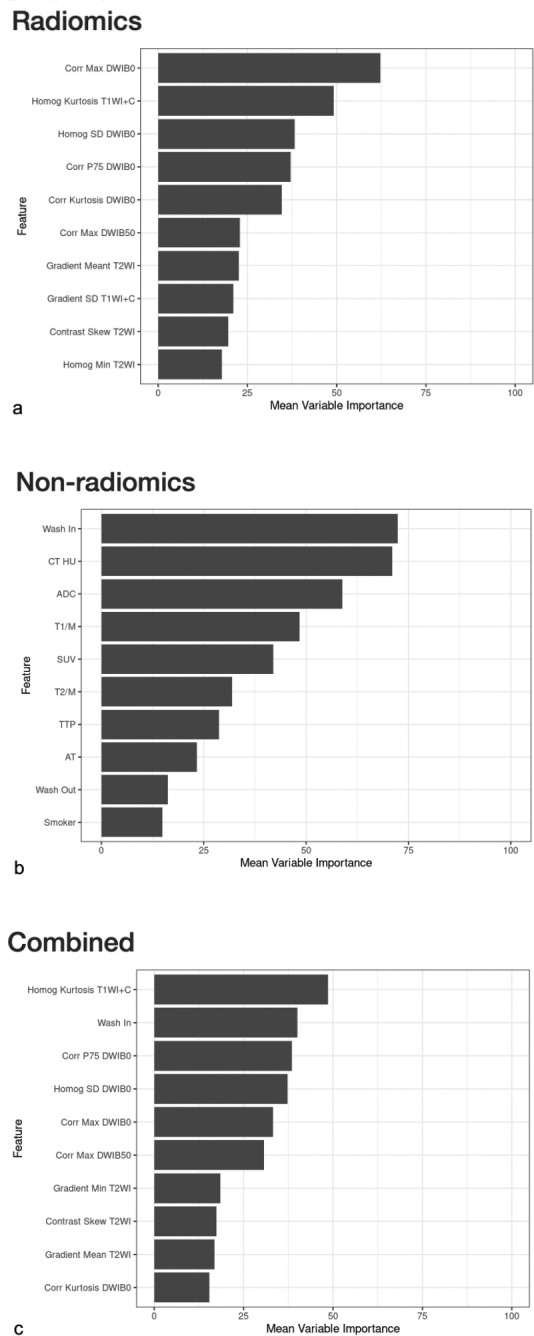
Radiomic feature importance with and without addition of clinical and traditional imaging data. Mean feature importance was plotted across folds on relative scales for radiomic features (a), non-radiomic features (clinical and traditional imaging data) (b), combined radiomic and non-radiomic features (c). Note that in the combined radiomics and non-radiomics model, neither clinical data nor any of the traditional quantitative imaging parameters was listed as a top importance feature except for contrast wash-in. Wash in = dynamic contrast wash-in; HU = mean Hounsfield unit; ADC = apparent diffusion coefficient; T1/M = nodule to muscle signal intensity ratios in T1-weighted images; SUVmax = maximum standardized uptake value; T2/M = nodule to muscle signal intensity ratios in T2-weighted images; TTP = time-to-peak; AT = arrival times; Wash-out = dynamic contrast wash-out; Corr Max DWI0 = Correlation maximum DWI B0; Homog Kurtosis T1WI + C=Homogeneity kurtosis T1WI + C; Homog SD DWIB0 = Homogeneity SD DWI B0; Corr p75 DWI0 = Correlation 75th percentile DWI B0; Corr Kurtosis DWIB0 = Correlation kurtosis DWI B0; Corr Max DWI50 = Correlation maximum DWI B50; Homog Min T2WI = Homogeneity minimum T2WI.
Impact of segmentation variability on feature reproducibility and reliability
Feature reproducibility was generally good to excellent from interreader segmentation variability with 69% T2WI, 68% DWIB0, 66.7% DWIB50, 29.1% T1WI + C and 23.6% T1WI features having interreader CCC ≥0.80 (Figure 7, Supplementary Table 5). Reader 1 achieved near perfect intrareader feature reliability with majority of the features (93.1% T1WI, 100% T1W + C, 94.4% T2WI, 98.6% DWIB0 and 95.8% DWIB50) having excellent (CCC >0.9) concordance. Reader 2’s intrareader agreement was more variable with 93% DWIB50, 86.2% DWIB0, 88.9% T2WI, 75% T1WI + C and 56.9% T1WI features having good to excellent concordance (CCC ≥0.8).
Figure 7.

Boxplot of MR radiomic feature reproducibility and reliability from inter- and intrareader segmentation variation. While Reader 1 (R1) achieved near perfect intrarater concordance with the majority of feature correlation coefficients well above the 0.8 threshold (dotted line), reader 2 (R2) demonstrated less intrarater consistency. Similarly, the interrater correlation was less than excellent. T1WI = T1 weighted image; T1WI + C=enhanced T1-weighted image; T2WI = T2-weighted image; DWI = diffusion-weighted image.
Discussion
To our knowledge, our MRI radiomic study is the first to utilize the full spectrum of MRI sequences (contrast and non-contrast enhanced T1WI, T2WI and DWI) and the full range of pulmonary nodule morphology (pure ground-glass, part solid and solid nodules). We found multiple DWI radiomic features that differentiate malignant from benign nodules while radiomics of other MRI sequences were not discriminating. All significant DWI features outperformed traditional MRI parameters (ADC, T1/M and T2/M). These results are not surprising given DWI’s known high specificity for malignant pulmonary nodules, 16 and such discriminatory performance is likely enhanced by the radiomic extraction. Unlike previous studies, 21,32 we did not extract radiomics from ADC, given post-processing influence on ADC map variability. 33 Dissimilar to Tang et al.’s study, 32 our features did not differentiate adenocarcinoma from other cancer types; this is likely secondary to subgroup sample size limitation. However, many of our features did associate with established imaging values (mean HU and SUVmax) and some even outperformed SUVmax and mean HU in classifying pulmonary nodules, rendering these features potential alternatives to traditional quantification methods. We found that addition of smoking history and ADC consistently improved the discriminating ability of all significant features. These findings are concordant with Tang et al, whose radiomics-clinical nomogram outperformed their radiomics-only model. 32
We are the first to use MRI radiomic based XGBoost to classify pulmonary nodules. XGBoost achieved the highest overall performance while other algorithms performing comparably. Previous studies have shown similar high performance in lung nodule classification using MR radiomics-based ML models. 21,26,28 Comparable XGBoost performance has been demonstrated for lesions in other organs as well. 34 It is known that the best models can vary for different applications and thus it has been recommended to explore several models. 21 Although our SVM’s AUC (0.717) was not as high as that reported in a previous study (0.88) 21 for pulmonary nodule classification, it is similar to that reported by Wang et al. (0.68). 28 The discrepancy is likely multifactorial. For instance, the study with AUC of 0.88 used 3-fold cross-validation (CV) without nesting, 21 which is known to generate strongly biased performance estimates even with sample size as large as 1000. 35 The studies by Wang et al 28 and our group used nested CV, which is known to generate unbiased performance estimates regardless of sample size and thus more realistic results. In our application of ML algorithms, we avoided various potential biases by leveraging nested cross-validation to assess model performance and using algorithms with embedded feature selection methods where possible to prevent overfitting. This example emphasizes the importance of using the appropriate evaluation method to assess an algorithm’s capability so as to prevent overinflation of a model’s performance. Previous studies also included solid lesions only while our study included the entire spectrum of lung nodules, including pure ground-glass, part-solid and solid nodules which may affect heterogeneity of our cohort. Moreover, previous studies included larger pulmonary lesions (our nodules are <3 cm while lesions in other studies measured up to 11 cm and 24 cm), which are more likely necrotic and thus more heterogenous, contributing to per lesion discrimination and adding to differences in our findings.
We are the first to evaluate segmentation variation effects on MRI radiomic feature reproducibility and reliability for lung nodule classification. While one reader demonstrated near perfect intrareader concordance, the other had less intrareader consistency. There was good to excellent interreader correlation. These results are not entirely unexpected, as studies of other organs have shown highly variable interreader manual segmentation agreements. 36,37 Such variability might be obviated using automated ML segmentation models. While such models are being developed for various organs and modalities, 38–40 none have been developed specifically for pulmonary nodule segmentation on MRI which might be an area worth exploring.
The main limitations of this study are the modest sample size and data originating from a single center, preventing us from establishing statistical significance for several subanalyses. Because MRI of thoracic nodules is currently not standard of care, accumulation of such data sets is challenging and external data sources within the United States are limited. It is our hope that publishing our encouraging preliminary results will inspire others to begin incorporating MRI as part of their lung nodule evaluation process, which will aid in further accumulating evidence and perhaps allow eventual pooling of data toward external validation. Secondly, we did not assess intralesion heterogeneity effects as in a previous study, 28 but our lesions are much smaller than the masses evaluated by Wang et al (<3 cm in the current study compared to up to 11 cm) and thus the chance of tumor necrosis and therefore heterogeneity might be lower. Nonetheless, evaluation of intralesion heterogeneity will be included in future investigations. It is known that respiratory motion can result in lesion blurring in thoracic MRI, most significantly affecting diffusion weighted images and ADC calculation. 41 Recently, several methods correcting distortion in DWI, including those caused by respiratory motion, have been described. 41–45 We did not employ such distortion correction for our diffusion images since these methods were experimental and unavailable at the time of image acquisition. Although one might think that the lack of distortion correction might have limited some of the radiomics’ performance; the incremental value of utilizing these correction techniques is uncertain as these methods are used mostly to increase ADC accuracy but our radiomics were derived directly from the diffusion images (not from the ADC maps). Additionally, how artificial distortion correction affects voxel heterogeneity evaluation by radiomics is unclear. Nevertheless, distortion corrections will be utilized and its usefulness will be assessed in future endeavors. As multiple recent reports described the success of CT radiomics in distinguishing malignant from benign pulmonary nodules, the lack of direct comparison of MRI and CT radiomics might be seen as a drawback. However, CT radiomics has not been standardized, is not widely utilized due to generalizability issues, and is not currently considered standard of care. As the focus of this study is to assess performance of MRI radiomics, alone or in combination with standard of care CT and PET derived metrics, a direct comparison of MRI and CT radiomics performance is beyond the scope of our study but would be interesting to examine in the future. Lastly, the use of conventional machine learning algorithms may be regarded as a limitation given the increasing availability of deep learning algorithms; however, the dataset for training such algorithms would require hundreds of thousands of cases, a threshold which would be difficult to reach as MRI of thoracic nodules is currently not standard of care.
In conclusion, our study demonstrated the ability of DWI MRI radiomic features to differentiate malignant from benign lung nodules, with some features outperforming traditional quantitative imaging methods. We have also shown improved MRI radiomics performance with the addition of ADC and smoking history and demonstrated strong diagnostic performance of four commonly used ML algorithms for nodule classification with XGBoost having the highest performance. Lastly, we illustrated good to excellent MRI feature reproducibility and reliability from intra- and interreader segmentation variability.
Footnotes
Acknowledgment: We would like to acknowledge Dr Lucy Bahn for editorial assistance.
Contributor Information
Chi Wan Koo, Email: koo.chiwan@mayo.edu.
Timothy L Kline, Email: Kline.Timothy@mayo.edu.
Joo Hee Yoon, Email: Yoon.JooHee@mayo.edu.
Andrew J Vercnocke, Email: Vercnocke.Andrew@mayo.edu.
Mathew P Johnson, Email: Johnson.Matthew5@mayo.edu.
Garima Suman, Email: Suman.Garima@mayo.edu.
Aiming Lu, Email: Lu.Aiming@mayo.edu.
Nicholas B Larson, Email: Larson.Nicholas@mayo.edu.
REFERENCES
- 1. Common Cancer Types NIH . National Cancer Institutie . Available from : https://www.cancer.gov/types/common-cancers
- 2. Gould MK, Tang T, Liu I-LA, Lee J, Zheng C, Danforth KN, et al . Recent trends in the identification of incidental pulmonary nodules . Am J Respir Crit Care Med 2015. ; 192 : 1208 – 14 . doi: 10.1164/rccm.201505-0990OC [DOI] [PubMed] [Google Scholar]
- 3. Kawakami S, Sone S, Takashima S, Li F, Yang ZG, Maruyama Y, et al . Atypical adenomatous hyperplasia of the lung: correlation between high-resolution CT findings and histopathologic features . Eur Radiol 2001. ; 11 : 811 – 14 . doi: 10.1007/s003300000790 [DOI] [PubMed] [Google Scholar]
- 4. Yang PS, Lee KS, Han J, Kim EA, Kim TS, Choo IW . Focal organizing pneumonia: CT and pathologic findings . J Korean Med Sci 2001. ; 16 : 573 – 78 . doi: 10.3346/jkms.2001.16.5.573 [DOI] [PMC free article] [PubMed] [Google Scholar]
- 5. Kim HY, Shim YM, Lee KS, Han J, Yi CA, Kim YK . Persistent pulmonary nodular ground-glass opacity at thin-section CT: histopathologic comparisons . Radiology 2007. ; 245 : 267 – 75 . doi: 10.1148/radiol.2451061682 [DOI] [PubMed] [Google Scholar]
- 6. Oh J-Y, Kwon S-Y, Yoon H-I, Lee SM, Yim J-J, Lee J-H, et al . Clinical significance of a solitary ground-glass opacity (GGO) lesion of the lung detected by chest CT . Lung Cancer 2007. ; 55 : 67 – 73 . doi: 10.1016/j.lungcan.2006.09.009 [DOI] [PubMed] [Google Scholar]
- 7. Chun EJ, Lee HJ, Kang WJ, Kim KG, Goo JM, Park CM, et al . Differentiation between malignancy and inflammation in pulmonary ground-glass nodules: the feasibility of integrated (18) F-FDG PET/CT . Lung Cancer 2009. ; 65 : 180 – 86 . doi: 10.1016/j.lungcan.2008.11.015 [DOI] [PubMed] [Google Scholar]
- 8. Fazel R, Krumholz HM, Wang Y, Ross JS, Chen J, Ting HH, et al . Exposure to low-dose ionizing radiation from medical imaging procedures . N Engl J Med 2009. ; 361 : 849 – 57 . doi: 10.1056/NEJMoa0901249 [DOI] [PMC free article] [PubMed] [Google Scholar]
- 9. Team TACSmaec . Understanding radiation risk from imaging tests . Cancer.org: : The American Cancer Society; ; 2018. . [Google Scholar]
- 10. DoHaS Care . Review of radiation dose issues from the use of CT in the UK . In : Volume COMARE COMARE . Reports: : UK Government; ; 2014. . [Google Scholar]
- 11. Fernandez-Antoran D, Piedrafita G, Murai K, Ong SH, Herms A, Frezza C, et al . Outcompeting p53-mutant cells in the normal esophagus by redox manipulation . Cell Stem Cell 2019. ; 25 : 329 – 341 . S1934-5909(19)30275-9 . doi: 10.1016/j.stem.2019.06.011 [DOI] [PMC free article] [PubMed] [Google Scholar]
- 12. Koo CW, Lu A, Takahashi EA, Simmons CL, Geske JR, Wigle D, et al . Can MRI contribute to pulmonary nodule analysis? J Magn Reson Imaging 2019. ; 49 : e256 – 64 . doi: 10.1002/jmri.26587 [DOI] [PubMed] [Google Scholar]
- 13. National Lung Screening Trial Research Team , Aberle DR, Adams AM, Berg CD, Black WC, Clapp JD, et al . Reduced lung-cancer mortality with low-dose computed tomographic screening . N Engl J Med 2011. ; 365 : 395 – 409 . doi: 10.1056/NEJMoa1102873 [DOI] [PMC free article] [PubMed] [Google Scholar]
- 14. Deppen SA, Blume JD, Kensinger CD, Morgan AM, Aldrich MC, Massion PP, et al . Accuracy of FDG-PET to diagnose lung cancer in areas with infectious lung disease: a meta-analysis . JAMA 2014. ; 312 : 1227 – 36 . doi: 10.1001/jama.2014.11488 [DOI] [PMC free article] [PubMed] [Google Scholar]
- 15. Biederer J, Hintze C, Fabel M . Mri of pulmonary nodules: technique and diagnostic value . Cancer Imaging 2008. ; 8 : 125 – 30 . doi: 10.1102/1470-7330.2008.0018 [DOI] [PMC free article] [PubMed] [Google Scholar]
- 16. Mori T, Nomori H, Ikeda K, Kawanaka K, Shiraishi S, Katahira K, et al . Diffusion-Weighted magnetic resonance imaging for diagnosing malignant pulmonary nodules/masses: comparison with positron emission tomography . J Thorac Oncol 2008. ; 3 : 358 – 64 . doi: 10.1097/JTO.0b013e318168d9ed [DOI] [PubMed] [Google Scholar]
- 17. Koo CW, White DB, Lingineni RK, Peikert T, McGee KP, Sigmund EE, et al . Magnetic resonance imaging of part-solid nodules: a pilot study . J Thorac Imaging 2016. ; 31 : 2 – 10 . doi: 10.1097/RTI.0000000000000176 [DOI] [PubMed] [Google Scholar]
- 18. Ohno Y, Koyama H, Yoshikawa T, Matsumoto K, Aoyama N, Onishi Y, et al . Diffusion-Weighted MRI versus 18F-FDG PET/CT: performance as predictors of tumor treatment response and patient survival in patients with non-small cell lung cancer receiving chemoradiotherapy . AJR Am J Roentgenol 2012. ; 198 : 75 – 82 . doi: 10.2214/AJR.11.6525 [DOI] [PubMed] [Google Scholar]
- 19. Ohno Y, Nishio M, Koyama H, Seki S, Tsubakimoto M, Fujisawa Y, et al . Solitary pulmonary nodules: comparison of dynamic first-pass contrast-enhanced perfusion area-detector CT, dynamic first-pass contrast-enhanced MR imaging, and FDG PET/CT . Radiology 2015. ; 274 : 563 – 75 . doi: 10.1148/radiol.14132289 [DOI] [PubMed] [Google Scholar]
- 20. Basso Dias A, Zanon M, Altmayer S, Sartori Pacini G, Henz Concatto N, Watte G, et al . Fluorine 18-FDG PET/CT and diffusion-weighted MRI for malignant versus benign pulmonary lesions: a meta-analysis . Radiology 2019. ; 290 : 525 – 34 . doi: 10.1148/radiol.2018181159 [DOI] [PubMed] [Google Scholar]
- 21. Wang X, Wan Q, Chen H, Li Y, Li X . Classification of pulmonary lesion based on multiparametric MRI: utility of radiomics and comparison of machine learning methods . Eur Radiol 2020. ; 30 : 4595 – 4605 . doi: 10.1007/s00330-020-06768-y [DOI] [PubMed] [Google Scholar]
- 22. Chen S, Harmon S, Perk T, Li X, Chen M, Li Y, et al . Diagnostic classification of solitary pulmonary nodules using dual time 18F-FDG PET/CT image texture features in granuloma-endemic regions . Sci Rep 2017. ; 7 ( 1 ): 9370 . doi: 10.1038/s41598-017-08764-7 [DOI] [PMC free article] [PubMed] [Google Scholar]
- 23. Chen C-H, Chang C-K, Tu C-Y, Liao W-C, Wu B-R, Chou K-T, et al . Radiomic features analysis in computed tomography images of lung nodule classification . PLoS One 2018. ; 13 ( 2 ): e0192002 . doi: 10.1371/journal.pone.0192002 [DOI] [PMC free article] [PubMed] [Google Scholar]
- 24. Mehta K, Jain A, Mangalagiri J, Menon S, Nguyen P, Chapman DR . Lung nodule classification using biomarkers, volumetric radiomics, and 3D cnns . J Digit Imaging 2021. ; 34 : 647 – 66 . doi: 10.1007/s10278-020-00417-y [DOI] [PMC free article] [PubMed] [Google Scholar]
- 25. Yang S, Wang Y, Shi Y, Yang G, Yan Q, Shen J, et al . Radiomics nomogram analysis of T2-fblade-TSE in pulmonary nodules evaluation . Magn Reson Imaging 2022. ; 85 : 80 – 86 : S0730-725X(21)00177-6 . doi: 10.1016/j.mri.2021.10.010 [DOI] [PubMed] [Google Scholar]
- 26. Yan Q, Yi Y, Shen J, Shan F, Zhang Z, Yang G, et al . Preliminary study of 3 t-MRI native T1-mapping radiomics in differential diagnosis of non-calcified solid pulmonary nodules/masses . Cancer Cell Int 2021. ; 21 ( 1 ): 539 . doi: 10.1186/s12935-021-02195-1 [DOI] [PMC free article] [PubMed] [Google Scholar]
- 27. Gourtsoyianni S, Doumou G, Prezzi D, Taylor B, Stirling JJ, Taylor NJ, et al . Primary rectal cancer: repeatability of global and local-regional MR imaging texture features . Radiology 2017. ; 284 : 552 – 61 . doi: 10.1148/radiol.2017161375 [DOI] [PMC free article] [PubMed] [Google Scholar]
- 28. Wang X, Li X, Chen H, Peng Y, Li Y . Pulmonary MRI radiomics and machine learning: effect of intralesional heterogeneity on classification of lesion . Acad Radiol 2022. ; 29 Suppl 2 : S73 – 81 : S1076-6332(21)00006-4 . doi: 10.1016/j.acra.2020.12.020 [DOI] [PubMed] [Google Scholar]
- 29. LeDell E, Petersen M, van der Laan M . Computationally efficient confidence intervals for cross-validated area under the ROC curve estimates . Electron J Stat 2015. ; 9 : 1583 – 1607 . doi: 10.1214/15-EJS1035 [DOI] [PMC free article] [PubMed] [Google Scholar]
- 30. Baeßler B, Weiss K, Pinto Dos Santos D . Robustness and reproducibility of radiomics in magnetic resonance imaging: a phantom study . Invest Radiol 2019. ; 54 : 221 – 28 . doi: 10.1097/RLI.0000000000000530 [DOI] [PubMed] [Google Scholar]
- 31. Bernatz S, Zhdanovich Y, Ackermann J, Koch I, Wild PJ, Dos Santos DP, et al . Impact of rescanning and repositioning on radiomic features employing a multi-object phantom in magnetic resonance imaging . Sci Rep 2021. ; 11 ( 1 ): 14248 . doi: 10.1038/s41598-021-93756-x [DOI] [PMC free article] [PubMed] [Google Scholar]
- 32. Tang X, Xu X, Han Z, Bai G, Wang H, Liu Y, et al . Elaboration of a multimodal MRI-based radiomics signature for the preoperative prediction of the histological subtype in patients with non-small-cell lung cancer . Biomed Eng Online 2020. ; 19 ( 1 ): 5 . doi: 10.1186/s12938-019-0744-0 [DOI] [PMC free article] [PubMed] [Google Scholar]
- 33. Ghosh A, Singh T, Singla V, Bagga R, Khandelwal N . Comparison of absolute apparent diffusion coefficient (ADC) values in ADC maps generated across different postprocessing software: reproducibility in endometrial carcinoma . AJR Am J Roentgenol 2017. ; 209 : 1312 – 20 . doi: 10.2214/AJR.17.18002 [DOI] [PubMed] [Google Scholar]
- 34. Hamerla G, Meyer H-J, Schob S, Ginat DT, Altman A, Lim T, et al . Comparison of machine learning classifiers for differentiation of grade 1 from higher gradings in meningioma: a multicenter radiomics study . Magn Reson Imaging 2019. ; 63 : 244 – 49 : S0730-725X(19)30111-0 . doi: 10.1016/j.mri.2019.08.011 [DOI] [PubMed] [Google Scholar]
- 35. Vabalas A, Gowen E, Poliakoff E, Casson AJ . Machine learning algorithm validation with a limited sample size . PLoS One 2019. ; 14 ( 11 ): e0224365 . doi: 10.1371/journal.pone.0224365 [DOI] [PMC free article] [PubMed] [Google Scholar]
- 36. Liechti MR, Muehlematter UJ, Schneider AF, Eberli D, Rupp NJ, Hötker AM, et al . Manual prostate cancer segmentation in MRI: interreader agreement and volumetric correlation with transperineal template core needle biopsy . Eur Radiol 2020. ; 30 : 4806 – 15 . doi: 10.1007/s00330-020-06786-w [DOI] [PubMed] [Google Scholar]
- 37. Laukamp KR, Pennig L, Thiele F, Reimer R, Görtz L, Shakirin G, et al . Automated meningioma segmentation in multiparametric MRI: comparable effectiveness of a deep learning model and manual segmentation . Clin Neuroradiol 2021. ; 31 : 357 – 66 . doi: 10.1007/s00062-020-00884-4 [DOI] [PubMed] [Google Scholar]
- 38. Laukamp KR, Thiele F, Shakirin G, Zopfs D, Faymonville A, Timmer M, et al . Fully automated detection and segmentation of meningiomas using deep learning on routine multiparametric MRI . Eur Radiol 2019. ; 29 : 124 – 32 . doi: 10.1007/s00330-018-5595-8 [DOI] [PMC free article] [PubMed] [Google Scholar]
- 39. Rickman J, Struyk G, Simpson B, Byun BC, Papanikolopoulos N . The growing role for semantic segmentation in urology . Eur Urol Focus 2021. ; 7 : 692 – 95 : S2405-4569(21)00197-8 . doi: 10.1016/j.euf.2021.07.017 [DOI] [PubMed] [Google Scholar]
- 40. Fulton L, McLeod A, Dolezel D, Bastian N, Fulton CP . Deep vision for breast cancer classification and segmentation . Cancers (Basel) 2021. ; 13 ( 21 ): 5384 . doi: 10.3390/cancers13215384 [DOI] [PMC free article] [PubMed] [Google Scholar]
- 41. Wang X, Chen H, Wan Q, Li Y, Cai N, Li X, et al . Motion correction and noise removing in lung diffusion-weighted MRI using low-rank decomposition . Med Biol Eng Comput 2020. ; 58 : 2095 – 2105 . doi: 10.1007/s11517-020-02224-7 [DOI] [PubMed] [Google Scholar]
- 42. Hao L, Huang Y, Gao Y, Chen X, Wang P . Nonrigid registration of prostate diffusion-weighted MRI . J Healthc Eng 2017. ; 2017 : 9296354 . doi: 10.1155/2017/9296354 [DOI] [PMC free article] [PubMed] [Google Scholar]
- 43. Sanz-Estébanez S, Rabanillo-Viloria I, Royuela-Del-Val J, Aja-Fernández S, Alberola-López C . Joint groupwise registration and ADC estimation in the liver using a B-value weighted metric . Magn Reson Imaging 2018. ; 46 : 1 – 9 : S0730-725X(17)30218-7 . doi: 10.1016/j.mri.2017.10.002 [DOI] [PubMed] [Google Scholar]
- 44. Usman M, Kakkar L, Matakos A, Kirkham A, Arridge S, Atkinson D . Joint B0 and image estimation integrated with model based reconstruction for field map update and distortion correction in prostate diffusion MRI . Magn Reson Imaging 2020. ; 65 : 90 – 99 : S0730-725X(19)30037-2 . doi: 10.1016/j.mri.2019.09.008 [DOI] [PMC free article] [PubMed] [Google Scholar]
- 45. Besson FL, Fernandez B, Faure S, Mercier O, Seferian A, Blanchet É, et al . Diffusion-Weighted imaging voxelwise-matched analyses of lung cancer at 3.0-T PET/MRI: reverse phase encoding approach for echo-planar imaging distortion correction . Radiology 2020. ; 295 : 692 – 700 . doi: 10.1148/radiol.2020192013 [DOI] [PubMed] [Google Scholar]
Associated Data
This section collects any data citations, data availability statements, or supplementary materials included in this article.