

Abstract
Improving current models and hypotheses of cellular pathways is one of the major challenges of systems biology and functional genomics. There is a need for methods to build on established expert knowledge and reconcile it with results of new high-throughput studies. Moreover, the available sources of data are heterogeneous, and the data need to be integrated in different ways depending on which part of the pathway they are most informative for. In this paper, we introduce a compartment specific strategy to integrate edge, node and path data for refining a given network hypothesis. To carry out inference, we use a local-move Gibbs sampler for updating the pathway hypothesis from a compendium of heterogeneous data sources, and a new network regression idea for integrating protein attributes. We demonstrate the utility of this approach in a case study of the pheromone response MAPK pathway in the yeast S. cerevisiae.
Keywords: Multi-level modeling, statistical network analysis, Bayesian inference, regulation and signaling dynamics
1. Introduction.
Cellular mechanisms are driven by interactions between DNA, RNA, and proteins working together in cellular pathways. However, the current knowledge of information flow in the cell is still quite incomplete [Kirouac et al. (2012)]. Even in well-established signaling pathways, studied for decades in model organisms, new approaches can discover novel components [Müller et al. (2005)] or unanticipated cross-talk with other pathways [McClean et al. (2007), Vaga et al. (2014)]. In cancer, finding pathways underlying disease development can lead to new drug targets [Balbin et al. (2013)]. This makes the dissection of cellular pathways one of the major challenges of systems biology and functional genomics. We can conceptualize the current working model of a cellular pathway using a network. In such a network, edges (established through careful perturbation experiments) typically represent frequent physical contact relationships between pairs of molecules, as well as the existence of causal effects of changes in abundance of a molecule on changes in abundance of another molecule. The challenge is how to refine our beliefs about the edges that specify the current working model for a pathway, in light of high-throughput data produced by a new collection of perturbation experiments, possibly coming from multiple studies.
1.1. Signaling pathways.
In this paper, we focus on signaling pathways, which are of particular importance because they encode how a cell reacts to external stimuli [Alberts et al. (2002)]. Starting from receptor proteins in the cell membrane, these pathways traverse the cytoplasm by relaying the signal from one protein to the next, often by phosphorylation in so-called MAPK cascades. At the end of these cascades lie transcription factors, which are specialized proteins that move from the cytoplasm into the cell nucleus, bind there to DNA and regulate gene expression as a response to the external stimulus. Signaling pathways thus traverse and connect the major compartments of the cell: the membrane, cytoplasm, and the nucleus.
One of the main obstacles to utilize high-throughput data in refining known pathway models is the gap between the relatively unbiased and hypothesis-free nature of generating genome-scale datasets and the need for very focused, hypothesis-driven research to test biological models in small or medium scale experiments [Hibbs et al. (2008)]. While researchers in computational biology usually start with a collection of data and reconstruct pathways from it, experimental biologists often start with a specific network hypothesis in mind and try to reconcile it with the evidence from high-throughput screens.
1.2. Proposed approach.
Here, we contribute to bridging this gap by introducing a comprehensive data integration strategy to refine a given network hypothesis. Our approach is characterized by three key features, which set it apart from previous approaches: First, we start with a specific pathway model (represented by a network) and assess how well it is supported in a collection of complementary datasets. These datasets are heterogeneous and informative for distinct cellular locations. Second, we exploit this fact by introducing a compartment-specific probabilistic model, which distinguishes different cellular locations (the membrane, cytoplasm, and nucleus) and where data types are only used for reconstructing the parts of the network they are informative about. Third, we explicitly include node properties in the model. This allows us to use data on the properties of the molecules like protein phosphorylation states or protein domains, which have so far been underutilized for pathway structure learning [Ryan et al. (2013)].
In this paper, we show that the proposed modeling approach can assist experimentalists in planning future studies by assessing which parts of a biological model are not well supported by data, and by proposing testable extensions and refinements of a given pathway hypotheses. We demonstrate the power of this approach in a case study in the yeast S. cerevisiae.
1.3. Related work.
Pathway reconstruction is a well-established field in computational biology and statistics [Hyduke and Palsson (2010), Markowetz and Spang (2007)]. Several features distinguish the proposed pathway refinement methodology from existing network reconstruction methods.
Comprehensive data integration strategies on large data collections were shown to be very successful in predicting protein function and interactions [Guan et al. (2008, 2012), Llewellyn and Eisenberg (2008), Myers et al. (2005)]. These methods are very helpful for describing the global landscape of protein function, but offer less insight into individual molecular mechanisms and pathways. The proposed approach differs from methods to refine pathway hypotheses from expression profiles of downstream regulated genes [Gat-Viks and Shamir (2007)], because we integrate heterogeneous data sources in a compartment-specific way.
We also differ from previous research on de-novo pathway reconstruction. These methods can be classified by how they use information about edges, paths, and nodes in the pathway diagram for structure learning.
Edge data.
Most approaches incorporate evidence for individual edges in the network using correlation measures [Li et al. (2013), Mulder et al. (2012a), Wang et al. (2012)] or higher-order graphical models [Schäfer and Strimmer (2005b), Friedman (2004), Segal et al. (2003)], sometimes integrating additional data sources into the model [Balbin et al. (2013), Bernard and Hartemink (2005), Gitter et al. (2013), Nariai et al. (2004), Segal, Wang and Koller (2003), Werhli and Husmeier (2007)].
Path data.
Cause-effect relationships indicating paths from perturbed genes to observed effects are exploited in methods like SPINE [Ourfali et al. (2007)], physical network models [Yeang et al. (2005)], nested effects models [Tresch and Markowetz (2008), Wang et al. (2014), Markowetz et al. (2007), Fröhlich et al. (2007, 2008a)], and others [Lo et al. (2012), Yip et al. (2010)], with applications including DNA damage repair [Workman et al. (2006)] and cancer signaling [Knapp and Kaderali (2013), Stelniec-Klotz et al. (2012b)].
Node data.
Features of individual proteins or genes provide data for nodes and have been found useful for predicting that a protein contributes to a pathway [Fröhlich et al. (2008b), Hahne et al. (2008)] but have so far been underutilized in reconstructing pathway structure [Ryan et al. (2013)].
In summary, the proposed approach differs from existing methods in several important aspects: First of all, we are the first to integrate data about edges and paths as well as nodes in the pathway diagram. Additionally, in contrast to de-novo network reconstruction, we start with a hypothesis network and identify which hypothesized edges are supported by the data. We also differ from other methods which evaluate formal one- and two-sample network hypothesis tests [Yates and Mukhopadhyay (2013)]. The primary objective of our analysis is not to determine whether the current working pathway model is correct—on the contrary, we assume that the working model specified a priori can be further improved upon. Our objective is to provide a list of edge probabilities that can assist experimentalists in their future studies. We assess which parts of the current biological model are not well supported by data, and we identify new edges that are supported by the data but that are not part of the initial working model.
1.4. Overview.
We describe a compartment-specific probabilistic graphical model for posterior inference on cellular pathways in Section 2, which can be used to extend and refine a given biological model and predict novel parts of the pathway graph. The proposed model comprehensively integrates the three general types of data on edges, paths, and nodes. We demonstrate the utility of the proposed methods in a case study in S. cerevisae, in Section 3, by first exploring how informative different data sources are individually, in Section 3.2, and then evaluating results of posterior draws using both full data and leave-one-out data, in Section 3.4.
2. An integrative model of a cellular pathway.
Given a set of a gene products, that is, putative pathway members, we infer an undirected network model using a local-move Gibbs sampler. The network model is defined in terms of N nodes and the edges between these pairs of nodes, (n, m). The edges are encoded by a binary random variable, Xnm. The collection of edge-specific random variables defines the adjacency matrix, X, of the pathway model.
2.1. Parameter estimation and posterior inference.
The adjacency matrix X corresponding to the pathway model is latent since we cannot directly observe the edges, though we have prior belief about many edges. Thus, the primary goal of our analysis is to do posterior inference on the adjacency matrix, X, from a collection of datasets, and an initial pathway hypothesis. Although we treat X as latent, we differ from de-novo pathway reconstruction by incorporating this informative hypothesis pathway which we use to train the models for datasets (see Section 3).
By Bayes’ rule, the posterior distribution on a pathway model,
| (2.1) |
is proportional to the prior distribution on the pathway times the likelihood. Here, Θ is a collection of parameters that parametrize the likelihood components for edge, path, and node data, introduced below.
We use a local Gibbs sampling strategy to sample plausible pathway models under the posterior distribution in equation (2.1). The sampler explores the space of pathway models by adding or removing edges in turn, one at a time. Specifically, the edge Xnm between gene products (n, m) is sampled according to a Bernoulli distribution, with probability of success
| (2.2) |
where X(−nm) represents the set of edges without Xnm.
2.2. Context-specific data contributions through a compartment map.
Importantly, different datasets are typically quite informative in specific cellular locations while completely uninformative in others. We consider five complementary data types: physical binding of protein pairs (including yeast-two hybrid, mass spectrometry, and literature-curated data), transcription factor-DNA binding assays, gene knockout data, gene coexpression data, and node information (including protein domains and differential phosphorylation arrays). Before defining the likelihood components in Section 2.3, we detail how we propose to encode in our model the specificity of the information in different data sources to only a subset of cellular locations.
To instantiate the notion that different data are informative in different cellular locations, we introduce an additional modeling element: the compartment map, which contains three conceptual pathway compartments directly based on the organisation of the cell [Alberts et al. (2002)]: First, the cell membrane, where receptor proteins sense signals from outside the cell; second, the cytoplasm, where protein cascades relay these signals to transcription factor proteins that enter the third compartment, the nucleus, to regulate the activity of target genes. The compartment map, , is a 5 × 3 binary matrix that associates the three pathway compartments with the five data types to indicate which data type is informative about molecular interactions in which compartments (see Table 1).
Table 1.
List of learned parameters for high-throughput data. Prior to pathway refinement, we first infer all parameters using the hypothesis pathway or a distinct “training pathway”
| Data type | Parameters |
|---|---|
|
| |
| Protein interaction | α, β |
| Protein-DNA binding | γ |
| Gene knock-out | σ0, σ1 |
| Gene coexpression | κ, δ |
| Node attributes | λ, |
In particular, each dataset is described by a pair Dk = (Yk, Tk), where Yk denotes the collection of measurements, and Tk is five-level factor that denotes the data type (and indexes the relevant row of ). We can now revise the form of the conditional distributions in equation (2.2),
| (2.3) |
Overloading notation, we let be an indicator reflecting whether data type t is informative for the protein pair (n, m), based on the compartment map and the localizations of proteins n and m. This leads to the following likelihood specification:
| (2.4) |
| (2.5) |
where the role of the indicator is to discard data collections from data types that are expected to carry little information about the protein pair of interest, according to information in . That is, for any pair (n, m), implies dataset Yk is conditionally independent of edge (n, m) given the rest of the pathway. In this case, the data in Yk have no effect on the conditional posterior probability of Xnm.
In Algorithm 1, we outline the steps of the local-move Gibbs sampler. First, we use the initial pathway hypothesis to learn model parameters for the likelihoods described in Section 2.3. These parameters are learned from the hypothesis pathway or another held-out training pathway. For instance, for pheromone pathway inference (Section 3) we can infer these parameters using the hypothesis pheromone pathway or the osmolarity, hypotonic, or starvation sub-pathways (Section 3.5). A summary of all data model parameters can be found in Table 1.
After inferring these data parameters, we proceed with the main pathway refinement algorithm. For each pair of vertices in the network (in a randomly chosen order), we sample the presence or absence of an edge from the conditional distribution, given all other edges. As described above, the conditional distribution is a based only on the informative data types for the proposed vertices which are determined by the compartment map and cellular locations of the relevant genes.

2.3. Likelihoods for high-throughput data on edges, paths, and nodes.
Data of different types need to be modeled differently. We focus on modeling five main data types: protein interaction data, protein-DNA binding data, gene coexpression data, gene perturbation data, and node attribute data (differential phosphorylation and protein domains). Below, we describe the likelihood specifications corresponding to the main data types of interest. These likelihood specifications are components are all conditional on the current pathway model, which during inference is also used to estimate the parameters. Please note that the proposed data integration approach is fairly general and easy to extend or expand. The specifications below are stated for illustration purposes, and are tailored to the MAPK case study.
Likelihood for protein interaction data.
Here, we consider a single dataset YN×N aimed at measuring physical protein binding events (PPI). We reduce the likelihood of the data, Y, to a function the false positive and false negative rates, α and β. Given the pathway, X, we evaluate
| (2.6) |
where Sxy counts the number of edges for which Xnm = x and Ynm = y. For instance, S10 is the number of false positives. We estimate α and β as the maximum likelihood estimates of the appropriate binomial likelihood, for example, and where S can come from the target hypothesis pathway or a different training network.
Likelihood for protein-DNA binding data.
Here, we consider a single dataset YN×M aimed at measuring transcription factor-DNA binding events (TF) of N genes on M < N transcription factors. Rather than hybridization levels (for ChIP-chip) or peaks (for ChIP-seq), we model the p-values corresponding to binding events, which makes our model independent of the technology used to detect the binding event. We develop a mixture model for the p-values, directly. Given the pathway, X, we expect to see a small p-value for protein n binding nucleotide sequence m whenever the edge Xnm is present. On the contrary, the p-values are uniformly distributed under the null hypothesis of no binding events, Xnm = 0. We evaluate
| (2.7) |
where 0 < Ynm < 1 (p-value), and 0 < γ < 1. See a related beta-uniform mixture model introduced by Pounds and Morris (2003) in the context of multiple testing for differential expression. For pathway refinement, we take γ to be the maximum likelihood estimate derived from the set of p-values corresponding to edges in the training pathway.
Likelihood for knock-out data.
Here, we consider a dataset YN×M with M < N knockouts, where Ymn is the log-two-fold change in expression of gene n, when gene s is knocked out. Let Zmn be a binary variable representing the existence of a directed path from gene n to gene m, through a transcription factor. While we consider the set of undirected pathway models, we temporarily impute directionality using the fact that the cellular signal should flow from the cytoplasm to the nucleus. We model the knockout data as a mixture of normals:
| (2.8) |
The standard deviations for change in expression are represented by σ0 (when there is no path between the knockout and a target) and σ1 (there is a path). Empirically, σ1 > σ0 since there is generally a larger change in expression of a node, n, for knockout m when n and m are connected in the pathway. We take σ1 to be the maximum likelihood estimate based on the set of log-two-fold changes for which there is a direct pathway between the knockout and target in the hypothesis/training pathway. Similarly, we take σ2 to be the maximum likelihood estimate based on the set data for which there is no path between knockout and target.
Likelihood for gene coexpression data.
Here, we consider a single dataset YN×N aimed at measuring gene expression. Rather than hybridization levels (for microarrays) or the number of reads (for mRNA sequencing), we model correlations among the profiles of pairs of genes, which again makes our model independent of the details of the measurement technology. We develop a mixture model for the correlations, directly. Given the pathway, X, we expect to see correlation between the expression profiles of two genes whenever they are coregulated. Similar to Schäfer and Strimmer (2005a), we use a mixture model for the distribution of the sample correlation coefficient of the form
| (2.9) |
When Xnm = 0, we expect the two gene profiles to be uncorrelated. Differently from Schäfer and Strimmer (2005a), however, we chose a distribution that puts more emphasis on higher correlation if we see an edge in the model, Xnm = 1, using a one-parameter beta distribution,
| (2.10) |
As in the model for protein-DNA binding data, we estimate δ using maximum likelihood on the set of gene pairs which share a transcription factor in the hypothesis/training pathway.
Likelihood for node attributes data.
Here, we consider a single dataset YN that lists node-specific attributes such as protein domains from PFAM [Punta et al. (2012)] and SMART [Letunic, Doerks and Bork (2012), Schultz et al. (1998)] databases, and differential phosphorylation data [Gruhler et al. (2005)]. We develop novel techniques to model protein attributes. Specifically, we model the likelihood of an attribute conditional on the given pathway X. We term our models for node attributes “network regression.” For differential phosphorylation data, YN×1,
| (2.11) |
In other words, the differential phosphorylation, Yn, is assumed to be linearly related to the mean differential phosphorylation of the neighbors of node n. Similarly, for the protein domain data, DN×S, we use an auto-logistic regression to model the data. Specifically, for Dns, a binary variable indicating the presence of domain s in protein n,
| (2.12) |
where
Here, logit(Pns) is linearly related to the presence of domains in neighboring genes. In both the normal and logistic regressions, we again fit the parameters , using training/initial hypothesis pathway. In the logistic model, we use a weakly-informative Cauchy prior for the coefficients [Gelman et al. (2008)]. This controls for any overfitting and separation problems.
2.4. Prior distribution on the space of pathway models.
In this study, our focus lies on assessing the extent to which the data support a pathway model X. We choose a block model prior P(X) over binary matrices of size N × N with edge density fixed by compartment. In general, any informative prior distribution on graphs could be used here to encode biological knowledge [Isci et al. (2014), Mukherjee and Speed (2008), Pham et al. (2011, 2016)].
3. Case study: Pheromone response pathway in S. cerevisiae.
To demonstrate the utility of our approach, we examine the pheromone response MAPK pathway in the yeast S. cerevisiae. It offers the opportunity to combine a large collection of datasets with a solid understanding of the pathway structure. The pheromone pathway is the subject of intense research efforts in computational biology as well as experimental biology [Hara et al. (2012), Kofahl and Klipp (2004), Scott et al. (2006)] and shows cross-talk to other MAPK pathways [Gat-Viks and Shamir (2007), McClean et al. (2007), Nagiec and Dohlman (2012)].
3.1. Initial pathway construction.
To start our analysis in a way relevant to refining and extending existing knowledge of signaling pathways, we extracted a model of the pheromone response pathway from the summary of MAPK pathways (sce04010) in the database KEGG [Kanehisa and Goto (2000)] and combined it with known transcription factor (TF) targets from two independent studies [Ren et al. (2000), Simon et al. (2001)].
We split the pathway into three parts: the membrane compartment containing the receptor proteins, the cytoplasm compartment containing the MAPK cascade to activate the transcription factors (TF), and the nuclear compartment containing the TFs and their targets. Figure 1A depicts the pathway hypothesis. Proteins mediating between two compartments (like TFs) are contained in two subgraphs and marked by grey boxes. TF targets that are also members of other compartments are indicated in bold.
Fig. 1.
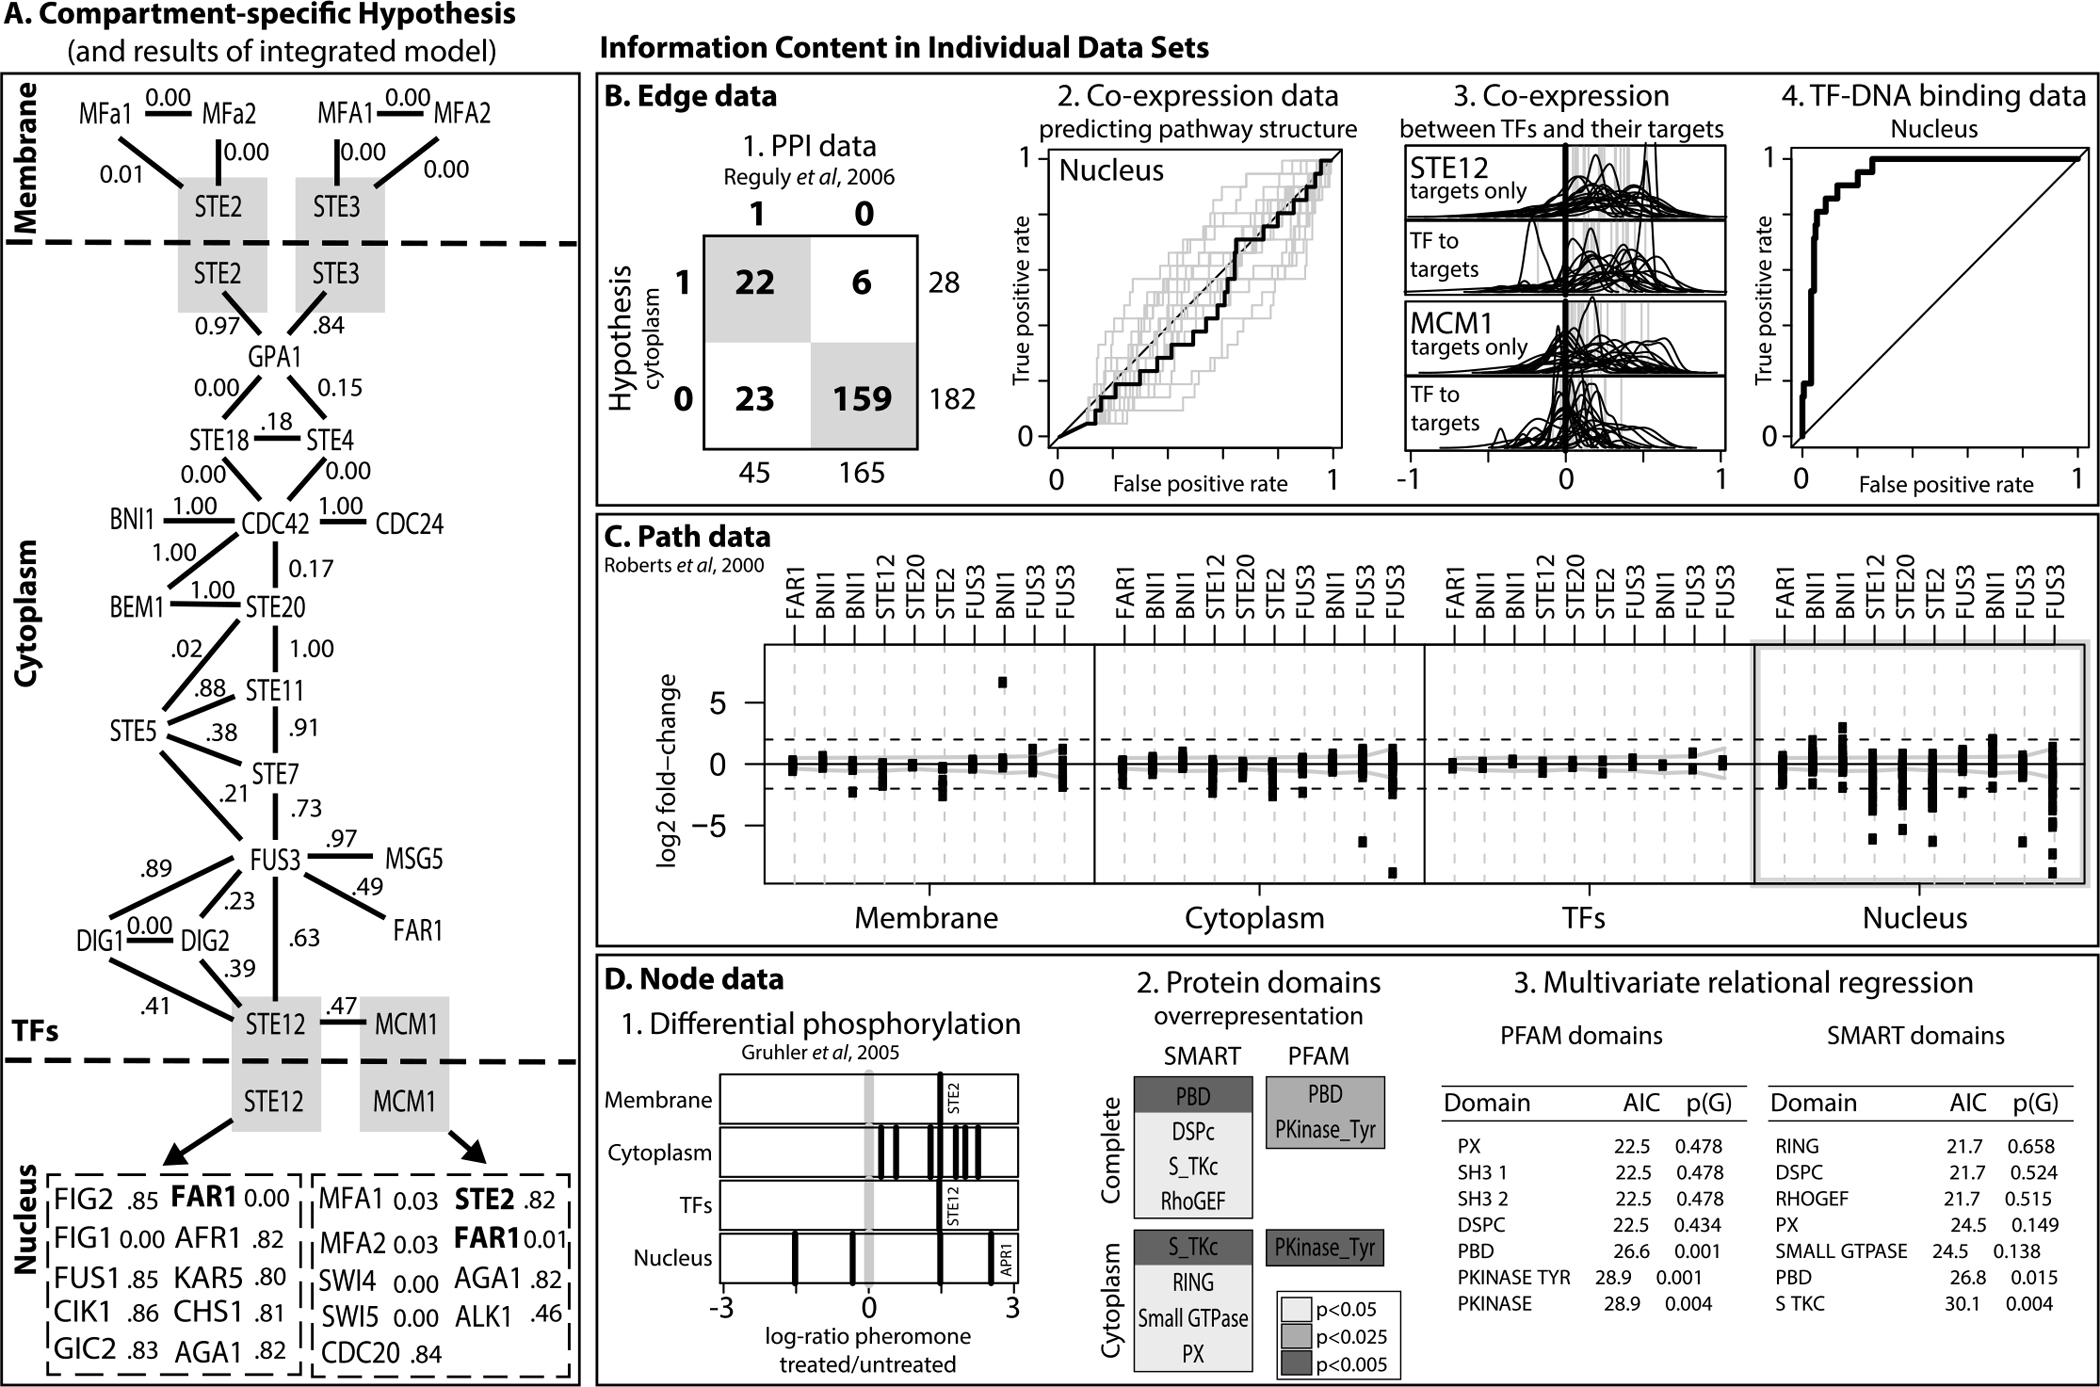
Compartment-specific pathway hypothesis, posterior probabilities, and evaluation of support in the data. A. Pathway hypothesis and posterior edge probabilities for the Yeast pheromone response pathway. Dashed lines delineate compartments and grey boxes show pathway members active in more than one compartment. Panels B–D summarize to which extent the hypothesis is reflected in individual data types. B. Edge data: (1) protein-protein interactions in the cytoplasm, (2) ROC curve using gene co-expression in the nucleus, (3) co-expression of TFs with their targets is lower than between targets, and (4) ROC curve using TF binding data in the nucleus. C. Cause-effect data shows different transcriptional effects in the four compartments, with nuclear effects being most prominent. D. Node data: (1) Differential phosphorylation, (2) Overrepresentation of protein-domains in different compartments, (3) goodness-of-fit of auto-logistic models on protein domains from PFAM and SMART.
3.2. Exploratory data analysis of individual data sources.
Before inferring the full model from all data, we explored the information content in each type of data individually (Figure 1B, C, D).
Protein-protein interactions (PPI).
We compared data from several complementary high-throughput assays, all available from BioGRID [Stark et al. (2006)] as well as a literature-curated dataset [Reguly et al. (2006)]. We analyzed the overlap between the protein interactions and the pathway hypothesis of Figure 1A. None of the datasets are informative for the membrane and nuclear compartments. Surprisingly, in the cytoplasm compartment we found that all of the high-throughput datasets show only ≤3 interactions between any of the proteins in the pathway. The situation was very different for the literature-curated data. Here, 45 interactions in the cytoplasm compartment covered 22 out of the 28 edges there (sensitivity > 78%, specificity > 87%, see Figure 1B1).
TF-DNA binding data.
We used the transcription factor binding data of [Harbison et al. (2004)], which was not used to define the TF targets in the pathways hypothesis. However, the ROC in Figure 1B4 shows this data contains a very clear signal that distinguishes the targets posited in the biological model from all other pathway genes.
Coexpression data.
For gene expression data, we examined datasets in which the pathway genes showed a significant difference in correlation structure from all other yeast genes (using the SPELL algorithm of [Hibbs et al. (2007)]) resulting in 20 datasets from 15 publications [including Brem and Kruglyak (2005), Gasch et al. (2000), Roberts et al. (2000)]. Figure 1B2 shows ROCs for predicting edges in the nuclear compartment for all datasets (grey lines) and the concatenated data (black line). No curve improves much on random prediction (the main diagonal). The reason is biological: Because expression data are a poor surrogate for protein activity, TFs are often less well correlated to their targets than the targets are between each other (Figure 1B3). For STE12, which regulates itself, all correlation coefficients exhibit a strong trend toward high positive correlation. Whereas MCM1, which is not self-regulating, is far less strongly correlated to its targets than the targets are between each other. Thus, in general it is more informative to use the correlation between targets for inference, which is consistently high whether or not a TF is transcriptionally regulated itself.
Gene perturbation data.
Paths in the graph are visible in cause-effect datasets [Hughes et al. (2000), Roberts et al. (2000)]. We find only very small effects of perturbations in the pathway on the expression of members of the membrane and cytoplasm compartment including TFs. Figure 1C summarizes this result for the Roberts et al. (2000) data. Very similar results were found for the Hughes et al. (2000) data. The four boxes correspond to the three compartments plus TFs. In each box, a vertical line corresponds to a perturbation in the pathway (some replicated). The dots show the fold-changes of the pathway genes in this compartment. Only in the nuclear compartment are wide-spread large fold-changes visible. This observation motivates the construction of our likelihood around the presence of paths between the knockout and genes in the nuclear compartment (see Section 2). In this way, when the knockout is far enough upstream, there is information about edges in the cytoplasm as well, even if the proteins there show no effect on the transcriptional level.
Protein phosphorylation.
A first example of node information is protein phosphorylation. The study of Gruhler et al. (2005) assessed differential phosphorylation of proteins in response to pheromone. Figure 1D1 shows the log-ratios between the pheromone treated and untreated conditions. Almost all proteins of the pheromone pathway measured by Gruhler et al. (2005) are up-regulated, which makes sense for a kinase cascade. The phosphorylation we observe for proteins corresponding to genes only attributed to the nuclear compartment in our model must be due to other kinase pathways in the cell. We further assessed to what extent the differential phosphorylation is correlated with the pathway model by fitting an auto-logistic regression. As a measure of correlation we computed the variance explained, R2 = 0.76, using the bootstrap. The variance explained by the auto-logistic regression was found statistically significant, when compared to the correlation of differential phosphorylation with randomized pathway models, p ≈ 0.062, and with randomized protein permutations on the true pathway model, p ≈ 0.059.
Protein domains.
A second example of node information are protein domains. We retrieved protein domains from PFAM [Punta et al. (2012)] and SMART [Letunic, Doerks and Bork (2012)]. First, we sought to quantify which domains, if any, were over-represented in the set of proteins involved in the complete pheromone response pathway as well as in each compartment, in turn. Figure 1D2 lists the domains that were found to be over-represented in the complete pathway and in the cytoplasm; darker shades of gray indicate a more significant p-value for the over-representation test.
Second, we sought to quantify to what extent the presence or absence of specific protein domains in proteins interacting with a given protein, P, was informative about the presence or absence of the same domain in such protein, P. This analysis was carried out using auto-logistic models, which summarize the informativeness of protein domains between interacting proteins on average, across all proteins in a given pathway. We fit auto-logistic regressions using each protein P in the cytoplasm compartment of the pheromone response pathway as data point, and the presence or absence of domains D1:K in any one protein among those interacting with P as covariates.
We fit multivariate models, which assume that the presence or absence of either the same or complementary domains is a factor that facilitates protein physical interactions. The two tables in 1D3 summarize the goodness-of-fit of the multivariate models, and report bootstrap p-values to assess the significance of the AIC scores. Figure 1D3 shows the p-values obtained by fitting the multivariate auto-logistic regression to randomized pathway models. The domains identified by the multivariate models as putatively carrying signal about the pheromone pathway in the cytoplasm overlap with the domains identified by the over-representation analysis above; namely, P21 rho-binding domains, S-TKc domains, and tyrosine-specific catalytic domains.
In summary, node attributes of the proteins involved in the pheromone response pathways are informative about mechanistic elements of the kinase cascade, across cellular localizations and in the cytoplasm. These findings suggest that integrating node attributes such as protein domains and cellular localization should increase the likelihood of pathway models that encode real biological signal about the inner working of a target pathway.
3.3. Data integration.
The previous results suggest that some datasets are indeed more informative in certain cellular locations. For example, protein interactions can explain wide parts of the kinase cascade in the cytoplasm, while co-expression is very strong for TF targets. However, no dataset is informative in all compartments: Neither protein interactions nor knockout data can explain a complete pathway. The pheromone response pathway is an archetypical MAPK pathway, so we expect these observations also to be valid for other MAPK and signaling pathways. These results suggest that the compartment-specific modeling approach we take here is sensible.
As a proof of concept, we use the results of exploratory data analysis to construct the compartment map, (Table 2). That is, we fix the compartment map based on basic biological principles and the above exploratory analysis (see Figure 1). We briefly explore a sensitivity analysis on the compartment map in the Supplementary Material [Franks, Markowetz and Airoldi (2018)].
Table 2.
The compartment map, , associates pathway compartments with those data types that are informative for such compartments. Prior information is informative for all compartments
| Membrane | Cytoplasm | Nucleus | |
|---|---|---|---|
|
| |||
| PPI | 1 | 1 | 0 |
| TF | 0 | 0 | 1 |
| Expr | 0 | 0 | 1 |
| Kout | 0 | 1 | 1 |
| Node | 0 | 1 | 0 |
| Prior | 1 | 1 | 1 |
3.4. Validation of the integrative pathway refinement strategy.
We evaluated how well the joint model, which combines all the complementary data types discussed above, supports the pathway hypothesis in Section 3.1 by sampling 1000 possible pathways using MCMC and tabulating the posterior probabilities over the edges. In the Supplementary Material, we demonstrate reasonable MCMC convergence [Franks, Markowetz and Airoldi (2018)].
Note that the logistic regression model for domain data may be subject to overfitting and separation. This can occur since there are many different protein domains present, yet the frequency of any single domain is fairly low. To mitigate this issue, we used a Cauchy prior on the coefficients for the suto-logistic regression, which is a sensible default prior for this model [Gelman et al. (2008)]. Since the domain information in the pheromone pathway is relatively sparse, we also collected protein domain data from other MAPK pathways and used the hypothesized structure of those pathways to help learn the regression coefficients. Figure 1A includes the posterior probabilities for the edges in our initial hypothesis.
Further, we used a leave-one-out strategy to evaluate the predictive power of our model. We evaluated 37 separate fits where each node was in turn left out of the training pathway. The edges connected to this node were propagated to the neighboring nodes of the left-out node. We left out the nodes rather than edges, because specifically leaving out edges is equivalent to assuming that we know there is no edge present. We needed to construct our model in a way that encodes ignorance about the presence of an edge. Leaving out the nodes, instead of the edges, is one way of being agnostic about the presence of edges attached to that node. Only the coefficients in the auto-logistic regression were learned from the pathway hypothesis, so only the node likelihoods were affected. Table 3 shows the posterior probabilities for edges (under simulations in which a node was removed from the prior hypothesis pathway). This table presents posterior probabilities for edges involved in knockout experiments.
Table 3.
Posterior edge probabilities for leave-one-out trials involving edges in knockout experiments. Since we use a leave-node-out scheme, there are two posterior probabilities for an edge (corresponding to which of the two node endpoints were left out for that particular simulation). Posterior probabilities for all MAPK edges are available in the Supplementary Material [Franks, Markowetz and Airoldi (2018)]
| Real data |
In silico |
|||||
|---|---|---|---|---|---|---|
| Min | Average | Max | Min | Average | Max | |
|
| ||||||
| STE11/STE7 | 0.01 | 0.01 | 0.01 | 0.26 | 0.31 | 0.36 |
| MCM1/STE2 | 0.00 | 0.01 | 0.02 | 0.03 | 0.12 | 0.20 |
| MF(ALPHA)1/STE2 | 0.00 | 0.00 | 0.01 | 0.01 | 0.19 | 0.36 |
| FUS1/STE12 | 0.80 | 0.83 | 0.87 | 0.39 | 0.66 | 0.92 |
| CDC42/STE18 | 0.00 | 0.00 | 0.00 | 0.00 | 0.16 | 0.31 |
| FUS3/STE12 | 0.01 | 0.01 | 0.01 | 0.01 | 0.10 | 0.19 |
| STE5/STE7 | 0.13 | 0.13 | 0.13 | 0.00 | 0.14 | 0.27 |
| BNI1/CDC42 | 0.49 | 0.55 | 0.61 | 0.20 | 0.24 | 0.28 |
| FAR1/MCM1 | 0.00 | 0.00 | 0.00 | 0.24 | 0.26 | 0.27 |
| FAR1/STE12 | 0.00 | 0.00 | 0.00 | 0.00 | 0.37 | 0.73 |
| STE12/CHS1 | 0.80 | 0.82 | 0.83 | 0.01 | 0.02 | 0.03 |
| STE12/FIG2 | 0.84 | 0.84 | 0.85 | 0.04 | 0.24 | 0.43 |
| MCM1/AGA1 | 0.10 | 0.23 | 0.37 | 0.07 | 0.17 | 0.27 |
| STE12/FIG1 | 0.00 | 0.00 | 0.00 | 0.42 | 0.70 | 0.98 |
| STE12/CIK1 | 0.83 | 0.84 | 0.85 | 0.94 | 0.96 | 0.98 |
| STE12/KAR5 | 0.83 | 0.83 | 0.84 | 0.23 | 0.30 | 0.37 |
| STE12/GIC2 | 0.83 | 0.83 | 0.84 | 0.12 | 0.54 | 0.95 |
| MCM1/SWI4 | 0.00 | 0.00 | 0.00 | 0.16 | 0.29 | 0.41 |
For comparison, we also fit the model to in silico data. We constructed the “true pathway” to match the hypothesized MAPK pheromone pathway of Figure 1A. That is, we fixed a pathway with the matching nodes and edges. We then generated in silico datasets from the models specified in Section 2. The one exception is the data generation for the node data.
Here, we generate the presence of domains in a way such that short chains in the pathway are more likely to share domains than are random non-neighboring nodes. Specifically, we randomly chose chains of length 1 to 4 and added a common “domain” to every node in that chain. In this way, the domain data realistically reflect the notion that genes sharing common protein domains are more likely to interact.
The in silico leave-one-out results are also given in Table 3 beside the results for the true data. Figure 2 shows the precision-recall curve averaged over 30 simulated datasets. As in the true data analysis, the results demonstrate high precision and recall, especially in the “nucleus” and “cytoplasm.” The “membrane” shows the worst precision-recall because we have the fewest informative data types there, but when simulating from the true data generating process, we still do quite well.
Fig. 2.

Precision/Recall curves overall and by compartment for the MAPK pathway (left) and simulated data (right). Thresholds are set on the posterior mean probability of an edge. In truth, the membrane compartment, which has the fewest genes, performs poorly because only the PPI dataset is (weakly) informative there. The simulated data reflects the average Precision/Recall over 30 simulated datasets (Section 3.4).
Finally, Figure 2 shows the precision-recall curve for our model, by compartment. For the membrane compartment, only the PPI data is informative, and weakly so. Thus, it performs the most poorly, although there are also by far the fewest genes in this compartment. By contrast, the nuclear and cytoplasm compartments both have high precision and recall.
3.5. Inferring cross-talk with other pathways.
With our model, we are also able to identify possible cross-talk between pathways. In this paper, we focus on the pheromone response pathway, but our model can easily be used on other pathways, as long as we specify the relevant genes and transcription factors, and their corresponding cellular locations.
For instance, the MAPK pathway consists of the pheromone sub-pathway, as well as hypotonic shock, osmolarity, and starvation sub-pathways. The degree of interaction between components of these MAPK pathways is not currently known. To identify cross-talk between the pheromone pathway and other MAPK pathways, we can simply include a new set of genes from the other sub-pathways and fit the model as usual. The results for the cross-talk evaluations are displayed in Table 4.
Table 4.
Number of inferred edges between the pheromone pathway and one of the other three sub-pathways with posterior probabilities above 0.3
| Osmolarity | Hypotonic | Starvation | |
|---|---|---|---|
|
| |||
| Cytoplasm–cytoplasm | 16 | 25 | 11 |
| Cytoplasm–membrane | 12 | 17 | 8 |
| Cytoplasm–nucleus | 22 | 17 | 3 |
| Cytoplasm–TF | 0 | 2 | 3 |
| Membrane–membrane | 2 | 2 | 2 |
| Membrane–nucleus | 19 | 13 | 3 |
| Membrane–TF | 0 | 1 | 2 |
| Nucleus–nucleus | 4 | 7 | 0 |
| Nucleus–TF | 1 | 6 | 10 |
| TF–TF | 0 | 0 | 2 |
4. Discussion.
The proposed methodology achieves fairly strong predictive power by integrating data in a compartment specific way. Importantly, we are able to evaluate how each data type contributes to the overall likelihood of any edge. Since each data type independently contributes to the probability of an edge, we can compute the fraction of the overall likelihood difference (between presence and absence of an edge) that is due to a particular data type. Thus, the proposed approach provides information about which parts of a pathway model are not well supported by available data, as illustrated in Figure 3.
Fig. 3.

Percentages of differential likelihood (presence vs. absence of an edge) due to specific data types, by compartment. Node data contribute the most in the cytoplasm (center), whereas TF-DNA binding data contribute the most in the nucleus (bottom).
In addition, the proposed methodology can identify if a particular data type tends to disagree with the other data types for sets of edges. This could indicate whether or not a data type is at all useful for modeling edges in a particular cellular location. A sensitivity analysis on the compartment map shows that indeed precision/recall degrades when noninformative data types are used to infer edges in certain cellular locations, as results in the Appendix illustrate. This suggests it should be possible to do inference on the compartment map from Table 2, rather than fix it a priori. Alternatively, one could consider placing a prior distribution over the entries in the compartment map to reflect any subjective uncertainty about locations in which specific data types are informative. Finally, this analysis could be used to check the validity of the individual likelihood components in Section 2.
Our work also suggests some statistical issues. One of the major challenges of statistical pathway modeling is that typically researchers only track information for observed interactions (i.e., edges), but information about unobserved interactions is rarely collected and seldom preserved. This makes supervised pathway inference very difficult. As a consequence, in the proposed framework, we can leverage a priori evidence for the presence of several edges edges, but we have no a priori evidence about the absence edges. As an alternative, it might be useful avoid specifying prior evidence for any interaction, and treat the unobserved interactions as missing data. Better documentation of experimentally verified lack of interactions between gene product pairs would also be useful in the data analysis.
Another nontrivial challenge relates to the sparsity of the protein domain data. While there is evidence of signal about the pathway model in this type of data, overfitting often becomes a concern that needs be addressed. With more domain data, or perhaps broader domain categories, one may be able to learn get more information out of the working pathway model and better calibrate the various prior distributions. In our case study, for example, more domain data would improve the leave-one-out results for the cytoplasm significantly. This is evident from our results which show how borrowing domain information from other MAPK sub-pathways significantly improved the posterior probabilities of edges in the leave-one-out simulations.
From an experimental design perspective, we also noticed that most of the knockouts in the gene perturbation dataset for MAPK we had access to were generally downstream in the pathway model. If the knockouts had been further upstream from perturbed genes in the nucleus, we could have learned about the possible presence of edges in a path between the knockout and other genes. While this type of design consideration is difficult to make for pathway models that are largely unknown, when working with more mature pathways they should be taken into account.
Lastly, we divided the pathway into its three main compartments: membrane, cytoplasm, and nucleus. However, the pathway could more finely divided into the over two dozen cellular components specified by the gene ontology (GO) for the yeast S. Cerevisae. By dividing the pathway into more compartments, one would also have a greater degree of control over which data types are used in various parts of the cell.
4.1. Concluding remarks.
In this paper, we introduced an approach for refining cellular pathway models by integrating heterogeneous data sources in a compartment-specific way, and explicitly included properties of genes and gene products in the model. The case-study on MAPK illustrates how this approach can be useful for discovering new interactions, or cross-talk with other pathways. The proposed modeling framework is also amenable to simple extensions that can add more cellular compartments, more data types, and novel perturbation experiments, which will ultimately provide finer grained control of the specificity of likelihood components.
Supplementary Material
Acknowledgments
Supported in part by NIH Grant R01 GM-096193, NSF CAREER Grant IIS-1149662, and by MURI Award W911NF-11–1-0036 to Harvard University.
Supported by the University of Cambridge, Cancer Research UK (C14303/A17197), and Hutchison Whampoa Limited.
Footnotes
SUPPLEMENTARY MATERIAL
Supplementary figures (DOI: 10.1214/16-AOAS915SUPP; .pdf). In this Appendix, we give convergence diagnostics for network statistics, we explore sensitivity of the results to variations in the compartment map, and we give more details about the simulation results.
Contributor Information
Alexander M. Franks, Department of Statistics and, Applied Probability, University of California, Santa Barbara, South Hall, Santa Barbara, California 93106, USA
Florian Markowetz, Cancer Research UK, Cambridge Institute, Li Ka Shing Centre, University of Cambridge, Robinson Way, Cambridge, CB2 0RE, United Kingdom.
Edoardo M. Airoldi, Fox School of Business, Department of Statistical Science, Temple University, Center for Data Science, 1810 Liacouras Walk, Philadelphia, Pennsylvania 19122, USA.
REFERENCES
- Alberts B, Johnson A, Lewis J, Raff M, Roberts K and Walter P (2002). Molecular Biology of the Cell, 4th ed. Garland Science, New York. [Google Scholar]
- Balbin OA, Prensner JR, Sahu A, Yocum A, Shankar S, Malik R, Fermin D, Dhanasekaran SM, Chandler B, Thomas D, Beer DG, Cao X, Nesvizhskii AI and Chinnaiyan AM (2013). Reconstructing targetable pathways in lung cancer by integrating diverse omics data. Nat. Commun. 4 Article ID 2617. DOI: 10.1038/ncomms3617. [DOI] [PMC free article] [PubMed] [Google Scholar]
- Bernard A and Hartemink AJ (2005). Informative structure priors: Joint learning of dynamic regulatory networks from multiple types of data. In Pacific Symposium on Biocomputing 459–470. [PubMed] [Google Scholar]
- Brem RB and Kruglyak L (2005). The landscape of genetic complexity across 5,700 gene expression traits in yeast. Proc. Natl. Acad. Sci. USA 102 1572–1577. [DOI] [PMC free article] [PubMed] [Google Scholar]
- Franks A, Markowetz F and Airoldi E (2018). Supplement to “Refining cellular pathway models using an ensemble of heterogeneous data sources.” DOI: 10.1214/16-AOAS915SUPP. [DOI] [PMC free article] [PubMed] [Google Scholar]
- Friedman N (2004). Inferring cellular networks using probabilistic graphical models. Science 303 799–805. [DOI] [PubMed] [Google Scholar]
- Fröhlich H, Fellmann M, Sültmann H, Poustka A and Beissbarth T (2007). Large scale statistical inference of signaling pathways from RNAi and microarray data. BMC Bioinform. 8 Article ID 386. [DOI] [PMC free article] [PubMed] [Google Scholar]
- Fröhlich H, Beissbarth T, Tresch A, Kostka D, Jacob J, Spang R and Markowetz F (2008a). Analyzing gene perturbation screens with nested effects models in R and Bioconductor. Bioinformatics 24 2549–2550. [DOI] [PMC free article] [PubMed] [Google Scholar]
- Fröhlich H, Fellmann M, Sültmann H, Poustka A and Beissbarth T (2008b). Predicting pathway membership via domain signatures. Bioinformatics 24 2137–2142. [DOI] [PMC free article] [PubMed] [Google Scholar]
- Gasch AP, Spellman PT, Kao CM, Carmel-Harel O, Eisen MB, Storz G, Botstein D and Brown PO (2000). Genomic expression programs in the response of yeast cells to environmental changes. Mol. Biol. Cell 11 4241–4257. [DOI] [PMC free article] [PubMed] [Google Scholar]
- Gat-Viks I and Shamir R (2007). Refinement and expansion of signaling pathways: The osmotic response network in yeast. Genome Res. 17 358–367. [DOI] [PMC free article] [PubMed] [Google Scholar]
- Gelman A, Jakulin A, Pittau MG and Su Y-S (2008). A weakly informative default prior distribution for logistic and other regression models. Ann. Appl. Stat. 2 1360–1383. MR2655663 [Google Scholar]
- Gitter A, Carmi M, Barkai N and Bar-Joseph Z (2013). Linking the signaling cascades and dynamic regulatory networks controlling stress responses. Genome Res. 23 365–376. [DOI] [PMC free article] [PubMed] [Google Scholar]
- Gruhler A, Olsen JV, Mohammed S, Mortensen P, Faergeman NJ, Mann M and Jensen ON (2005). Quantitative phosphoproteomics applied to the yeast pheromone signaling pathway. Mol. Cell. Proteomics 4 310–327. [DOI] [PubMed] [Google Scholar]
- Guan Y, Myers CL, Hess DC, Barutcuoglu Z, Caudy AA and Troyanskaya OG (2008). Predicting gene function in a hierarchical context with an ensemble of classifiers. Genome Biol. 9(Suppl. 1) S3. [DOI] [PMC free article] [PubMed] [Google Scholar]
- Guan Y, Gorenshteyn D, Burmeister M, Wong AK, Schimenti JC, Handel MA, Bult CJ, Hibbs MA and Troyanskaya OG (2012). Tissue-specific functional networks for prioritizing phenotype and disease genes. PLoS Comput. Biol. 8 Article ID e1002694. [DOI] [PMC free article] [PubMed] [Google Scholar]
- Hahne F, Mehrle A, Arlt D, Poustka A, Wiemann S and Beissbarth T (2008). Extending pathways based on gene lists using InterPro domain signatures. BMC Bioinform. 9 Article ID 3. DOI: 10.1186/1471-2105-9-3. [DOI] [PMC free article] [PubMed] [Google Scholar]
- Hara K, Ono T, Kuroda K and Ueda M (2012). Membrane-displayed peptide ligand activates the pheromone response pathway in Saccharomyces cerevisiae. J. Biochem. 151 551–557. [DOI] [PubMed] [Google Scholar]
- Harbison CT, Gordon DB, Lee TI, Rinaldi NJ, Macisaac KD, Danford TW, Hannett NM, Tagne J-B, Reynolds DB, Yoo J, Jennings EG, Zeitlinger J, Pokholok DK, Kellis M, Rolfe PA, Takusagawa KT, Lander ES, Gifford DK, Fraenkel E and Young RA (2004). Transcriptional regulatory code of a eukaryotic genome. Nature 431 99–104. [DOI] [PMC free article] [PubMed] [Google Scholar]
- Hibbs MA, Hess DC, Myers CL, Huttenhower C, Li K and Troyanskaya OG (2007). Exploring the functional landscape of gene expression: Directed search of large microarray compendia. Bioinformatics 23 2692–2699. [DOI] [PubMed] [Google Scholar]
- Hibbs MA, Myers CL, Huttenhower C, Hess DC, Li K, Caudy AA et al. (2009). Directing experimental biology: A case study in mitochondrial biogenesis. PLoS Comput. Biol. 5(3) Article ID e1000322. [DOI] [PMC free article] [PubMed] [Google Scholar]
- Hughes TR, Marton MJ, Jones AR, Roberts CJ, Stoughton R, Armour CD, Bennett HA, Coffey E, Dai H, He YD, Kidd MJ, King AM, Meyer MR, Slade D, Lum PY, Stepaniants SB, Shoemaker DD, Gachotte D, Chakraburtty K, Simon J, Bard M and Friend SH (2000). Functional discovery via a compendium of expression profiles. Cell 102 109–126. [DOI] [PubMed] [Google Scholar]
- Hyduke DR and Palsson BØ (2010). Towards genome-scale signalling network reconstructions. Nat. Rev. Genet. 11 297–307. [DOI] [PubMed] [Google Scholar]
- Isci S, Dogan H, Ozturk C and Otu HH (2014). Bayesian network prior: Network analysis of biological data using external knowledge. Bioinformatics 30 860–867. [DOI] [PMC free article] [PubMed] [Google Scholar]
- Kanehisa M and Goto S (2000). KEGG: Kyoto encyclopedia of genes and genomes. Nucleic Acids Res. 28 27–30. [DOI] [PMC free article] [PubMed] [Google Scholar]
- Kirouac DC, Saez-Rodriguez J, Swantek J, Burke JM, Lauffenburger DA and Sorger PK (2012). Creating and analyzing pathway and protein interaction compendia for modelling signal transduction networks. BMC Syst. Biol. 6 Article ID 29. [DOI] [PMC free article] [PubMed] [Google Scholar]
- Knapp B and Kaderali L (2013). Reconstruction of cellular signal transduction networks using perturbation assays and linear programming. PLoS ONE 8 Article ID e69220. [DOI] [PMC free article] [PubMed] [Google Scholar]
- Kofahl B and Klipp E (2004). Modelling the dynamics of the yeast pheromone pathway. Yeast 21 831–850. [DOI] [PubMed] [Google Scholar]
- Letunic I, Doerks T and Bork P (2012). SMART 7: Recent updates to the protein domain annotation resource. Nucleic Acids Res. 40 D302–D305. [DOI] [PMC free article] [PubMed] [Google Scholar]
- Li J, Wei H, Liu T and Zhao PX (2013). GPLEXUS: Enabling genome-scale gene association network reconstruction and analysis for very large-scale expression data. Nucleic Acids Res. 42 Article ID e32. [DOI] [PMC free article] [PubMed] [Google Scholar]
- Llewellyn R and Eisenberg DS (2008). Annotating proteins with generalized functional linkages. Proc. Natl. Acad. Sci. USA 105 17700–17705. [DOI] [PMC free article] [PubMed] [Google Scholar]
- Lo K, Raftery AE, Dombek KM, Zhu J, Schadt EE, Bumgarner RE and Yeung KY (2012). Integrating external biological knowledge in the construction of regulatory networks from time-series expression data. BMC Syst. Biol. 6 Article ID 101. [DOI] [PMC free article] [PubMed] [Google Scholar]
- Markowetz F and Spang R (2007). Inferring cellular networks—A review. BMC Bioinform. 8(Suppl. 6) S5. [DOI] [PMC free article] [PubMed] [Google Scholar]
- Markowetz F, Kostka D, Troyanskaya OG and Spang R (2007). Nested effects models for high-dimensional phenotyping screens. Bioinformatics 23 i305–i312. [DOI] [PubMed] [Google Scholar]
- Mcclean MN, Mody A, Broach JR and Ramanathan S (2007). Cross-talk and decision making in MAP kinase pathways. Nat. Genet. 39 409–414. [DOI] [PubMed] [Google Scholar]
- Mukherjee S and Speed TP (2008). Network inference using informative priors. Proc. Natl. Acad. Sci. USA 105 14313–14318. [DOI] [PMC free article] [PubMed] [Google Scholar]
- Mulder KW, Wang X, Escriu C, Ito Y, Schwarz RF, Gillis J, Sirokmány G, Donati G, Uribe-Lewis S, Pavlidis P, Murrell A, Markowetz F and Watt FM (2012a). Diverse epigenetic strategies interact to control epidermal differentiation. Nat. Cell Biol. 14 753–763. [DOI] [PubMed] [Google Scholar]
- Müller P, Kuttenkeuler D, Gesellchen V, Zeidler MP and Boutros M (2005). Identification of JAK/STAT signalling components by genome-wide RNA interference. Nature 436 871–875. [DOI] [PubMed] [Google Scholar]
- Myers CL, Robson D, Wible A, Hibbs MA, Chiriac C, Theesfeld CL, Dolinski K and Troyanskaya OG (2005). Discovery of biological networks from diverse functional genomic data. Genome Biol. 6 Article ID R114. [DOI] [PMC free article] [PubMed] [Google Scholar]
- Nagiec MJ and Dohlman HG (2012). Checkpoints in a yeast differentiation pathway coordinate signaling during hyperosmotic stress. PLoS Genet. 8 Article ID e1002437. [DOI] [PMC free article] [PubMed] [Google Scholar]
- Nariai N, Kim S, Imoto S and Miyano S (2004). Using protein-protein interactions for refining gene networks estimated from microarray data by Bayesian networks. In Pacific Symposium on Biocomputing 336–347. [DOI] [PubMed] [Google Scholar]
- Ourfali O, Shlomi T, Ideker T, Ruppin E and Sharan R (2007). SPINE: A framework for signaling-regulatory pathway inference from cause-effect experiments. Bioinformatics 23 i359–i366. [DOI] [PubMed] [Google Scholar]
- Pham L, Christadore L, Schaus S and Kolaczyk ED (2011). Network-based prediction for sources of transcriptional dysregulation using latent pathway identification analysis. Proc. Natl. Acad. Sci. USA 108 13347–13352. [DOI] [PMC free article] [PubMed] [Google Scholar]
- Pham LM, Carvalho L, Schaus S and Kolaczyk ED (2016). Perturbation detection through modeling of gene expression on a latent biological pathway network: A Bayesian hierarchical approach. J. Amer. Statist. Assoc. 111 73–92. MR3494639 [DOI] [PMC free article] [PubMed] [Google Scholar]
- Pounds S and Morris SW (2003). Estimating the occurrence of false positives and false negatives in microarray studies by approximating and partitioning the empirical distribution of p-values. Bioinformatics 19 1236–1242. [DOI] [PubMed] [Google Scholar]
- Punta M, Coggill PC, Eberhardt RY, Mistry J, Tate J, Boursnell C, Pang N, Forslund K, Ceric G, Clements J, Heger A, Holm L, Sonnhammer ELL, Eddy SR, Bateman A and Finn RD (2012). The Pfam protein families database. Nucleic Acids Res. 40 D290–D301. [DOI] [PMC free article] [PubMed] [Google Scholar]
- Reguly T, Breitkreutz A, Boucher L, Breitkreutz B-J, Hon GC, Myers CL, Parsons A, Friesen H, Oughtred R, Tong A, Stark C, Ho Y, Botstein D, Andrews B, Boone C, Troyanskya OG, Ideker T, Dolinski K, Batada NN and Tyers M (2006). Comprehensive curation and analysis of global interaction networks in Saccharomyces cerevisiae. J. Biol. 5 Article ID 11. [DOI] [PMC free article] [PubMed] [Google Scholar]
- Ren B, Robert F, Wyrick JJ, Aparicio O, Jennings EG, Simon I, Zeitlinger J, Schreiber J, Hannett N, Kanin E, Volkert TL, Wilson CJ, Bell SP and Young RA (2000). Genome-wide location and function of DNA binding proteins. Science 290 2306–2309. [DOI] [PubMed] [Google Scholar]
- Roberts CJ, Nelson B, Marton MJ, Stoughton R, Meyer MR, Bennett HA, He YD, Dai H, Walker WL, Hughes TR, Tyers M, Boone C and Friend SH (2000). Signaling and circuitry of multiple MAPK pathways revealed by a matrix of global gene expression profiles. Science 287 873–880. [DOI] [PubMed] [Google Scholar]
- Ryan CJ, Cimermani P, Szpiech ZA, Sali A, Hernandez RD and Krogan NJ (2013). High-resolution network biology: Connecting sequence with function. Nat. Rev. Genet. 14 865–879. [DOI] [PMC free article] [PubMed] [Google Scholar]
- Schäfer J and Strimmer K (2005a). A shrinkage approach to large-scale covariance matrix estimation and implications for functional genomics. Stat. Appl. Genet. Mol. Biol. 4 Article ID 32. MR2183942 [DOI] [PubMed] [Google Scholar]
- Schäfer J and Strimmer K (2005b). An empirical Bayes approach to inferring large-scale gene association networks. Bioinformatics 21 754–764. [DOI] [PubMed] [Google Scholar]
- Schultz J, Milpetz F, Bork P and Ponting CP (1998). SMART, a simple modular architecture research tool: Identification of signaling domains. Proc. Natl. Acad. Sci. USA 95 5857–5864. [DOI] [PMC free article] [PubMed] [Google Scholar]
- Scott J, Ideker T, Karp RM and Sharan R (2006). Efficient algorithms for detecting signaling pathways in protein interaction networks. J. Comput. Biol. 13 133–144. MR2255250 [DOI] [PubMed] [Google Scholar]
- Segal E, Wang H and Koller D (2003). Discovering molecular pathways from protein interaction and gene expression data. Bioinformatics 19(Suppl. 1) i264–i271. [DOI] [PubMed] [Google Scholar]
- Segal E, Shapira M, Regev A, Pe’er D, Botstein D, Koller D and Friedman N (2003). Module networks: Identifying regulatory modules and their condition-specific regulators from gene expression data. Nat. Genet. 34 166–176. [DOI] [PubMed] [Google Scholar]
- Simon I, Barnett J, Hannett N, Harbison CT, Rinaldi NJ, Volkert TL, Wyrick JJ, Zeitlinger J, Gifford DK, Jaakkola TS and Young RA (2001). Serial regulation of transcriptional regulators in the yeast cell cycle. Cell 106 697–708. [DOI] [PubMed] [Google Scholar]
- Stark C, Breitkreutz B-J, Reguly T, Boucher L, Breitkreutz A and Tyers M (2006). BioGRID: A general repository for interaction datasets. Nucleic Acids Res. 34 D535–D539. [DOI] [PMC free article] [PubMed] [Google Scholar]
- Stelniec-Klotz I, Legewie S, Tchernitsa O, Witzel F, Klinger B, Sers C, Herzel H, Blüthgen N and Schäfer R (2012b). Reverse engineering a hierarchical regulatory network downstream of oncogenic KRAS. Mol. Syst. Biol. 8 Article ID 601. [DOI] [PMC free article] [PubMed] [Google Scholar]
- Tresch A and Markowetz F (2008). Structure learning in nested effects models. Stat. Appl. Genet. Mol. Biol. 7 Article ID 9. MR2386326 [DOI] [PubMed] [Google Scholar]
- Vaga S, Bernardo-Faura M, Cokelaer T, Maiolica A, Barnes CA, Gillet LC, Hegemann B, Van Drogen F, Sharifian H, Klipp E, Peter M, Saez-Rodriguez J and Aebersold R (2014). Phosphoproteomic analyses reveal novel cross-modulation mechanisms between two signaling pathways in yeast. Mol. Syst. Biol. 10 Article ID 767. [DOI] [PMC free article] [PubMed] [Google Scholar]
- Wang X, Castro MA, Mulder KW and Markowetz F (2012). Posterior association networks and functional modules inferred from rich phenotypes of gene perturbations. PLoS Comput. Biol. 8 Article ID e1002566. MR2958374 [DOI] [PMC free article] [PubMed] [Google Scholar]
- Wang X, Yuan K, Hellmayr C, Liu W and Markowetz F (2014). Reconstructing evolving signalling networks by hidden Markov nested effects models. Ann. Appl. Stat. 8 448–480. MR3191998 [Google Scholar]
- Werhli AV and Husmeier D (2007). Reconstructing gene regulatory networks with Bayesian networks by combining expression data with multiple sources of prior knowledge. Stat. Appl. Genet. Mol. Biol. 6 Article ID 15. MR2349908 [DOI] [PubMed] [Google Scholar]
- Workman CT, Mak HC, Mccuine S, Tagne J-B, Agarwal M, Ozier O, Begley TJ, Samson LD and Ideker T (2006). A systems approach to mapping DNA damage response pathways. Science 312 1054–1059. [DOI] [PMC free article] [PubMed] [Google Scholar]
- Yates PD and Mukhopadhyay ND (2013). An inferential framework for biological network hypothesis tests. BMC Bioinform. 14 Article ID 94. [DOI] [PMC free article] [PubMed] [Google Scholar]
- Yeang C-H, Mak HC, Mccuine S, Workman C, Jaakkola T and Ideker T (2005). Validation and refinement of gene-regulatory pathways on a network of physical interactions. Genome Biol. 6 Article ID R62. [DOI] [PMC free article] [PubMed] [Google Scholar]
- Yip KY, Alexander RP, Yan K-K and Gerstein M (2010). Improved reconstruction of in silico gene regulatory networks by integrating knockout and perturbation data. PLoS ONE 5 Article ID e8121. [DOI] [PMC free article] [PubMed] [Google Scholar]
Associated Data
This section collects any data citations, data availability statements, or supplementary materials included in this article.