Abstract
In hazy days, several local authorities always implemented the strict traffic-restriction measures to improve the air quality. However, owing to lack of data, the quantitative relationships between them are still not clear. Coincidentally, traffic restriction measures during the COVID-19 pandemic provided an experimental setup for revealing such relationships. Hence, the changes in air quality in response to traffic restrictions during COVID-19 in Spain and United States was explored in this study. In contrast to pre-lockdown, the private traffic volume as well as public traffic during the lockdown period decreased within a range of 60−90%. The NO2 concentration decreased by approximately 50%, while O3 concentration increased by approximately 40%. Additionally, changes in air quality in response to traffic reduction were explored to reveal the contribution of transportation to air pollution. As the traffic volume decreased linearly, NO2 concentration decreased exponentially, whereas O3 concentration increased exponentially. Air pollutants did not change evidently until the traffic volume was reduced by less than 40%. The recovery process of the traffic volume and air pollutants during the post-lockdown period was also explored. The traffic volume was confirmed to return to background levels within four months, but air pollutants were found to recover randomly. This study highlights the exponential impact of traffic volume on air quality changes, which is of great significance to air pollution control in terms of traffic restriction policy.
Supplementary Information
The online version contains supplementary material available at 10.1007/s00477-022-02351-7.
Keywords: COVID-19 lockdown, Traffic volume, Air quality, System resilience, Urban management
Introduction
On March 11, 2020, the World Health Organization (WHO) declared that the COVID-19 disease had been characterized as a pandemic and could cause serious health problems (Shakil et al. 2020). The main transmission routes of COVID-19 are direct, aerosol, and contact transmission. Therefore, limiting human-to-human contact is an effective way of slowing the spread of the virus (Lal et al. 2020). Most countries and regions had implemented full or partial lockdown policies during the COVID-19 pandemic, such as travel, commerce, and traffic restrictions. These lockdown measures and other preventive measures (such as the use of masks, gloves, and disinfectants) play an important role in controlling the spread of the virus (GÜNER et al. 2020).
The transportation sector was significantly affected due to lockdown policies during the pandemic. The implementation of lockdown policies during the COVID-19 pandemic led to a reduction in vehicle use (Lal et al. 2020; Muhammad et al. 2020). Many studies have used satellite imagery or government-released traffic flow monitoring data to compare traffic changes before and after the lockdown to illustrate the impact of COVID-19 pandemic. NASA’s Planet Labs captured satellite images of traffic and parking lots near Wuhan Railway Station before and after the lockdown and found almost no vehicles on the Wuhan Yangtze River Bridge after the policy’s implementation (Wang and Su 2020). Traffic flow monitoring data in Bengbu and Changzhou released by the National Bureau of Statistics of China showed that traffic in Anhui and Zhejiang decreased by 75% (Li et al. 2020). A study of the Veneto region near the Northeast Adriatic sea showed that during the lockdown from March to April 2020, shipping volume decreased by 69% and passenger volume decreased by 78% compared with that in the same period in 2017 (Depellegrin et al. 2020). A similar trend was observed in Rio de Janeiro, Brazil; in the first two weeks of partial lockdown, passenger vehicle traffic reduced by 70−80% (Siciliano et al. 2020).
As a side effect, the changing characteristics of pollutants during the COVID-19 pandemic have also been widely studied. Remarkable changes in air quality were observed in various countries after the implementation of the lockdown policies. In Malaysia, during the lockdown period, the PM2.5 concentration reduced by up to 58.4% (Abdullah et al. 2020). In the Yangtze River Delta region of China, during the first-level response period, SO2, NOX, PM2.5, VOCs, and other major pollutants decreased by 26, 47, 46, and 57%, respectively (Li et al. 2020). In summary, plenty of evidence has confirmed that the COVID-19 lockdown resulted in improved air quality and lower concentrations of pollutants, such as nitrogen oxides and particulate matter, in many cities. Evidently, in contrast to the previous studies (Cai and Xie 2011; Chen et al. 2022), Covid-19 lockdown policy provides a good chance to use the natural experiment to explore the air quality change in restrictions policy.
Traffic is a major source of air pollutants, therefore, some scholars attempted to add the consideration of traffic to the study of air pollutants variations. During COVID-19 period, Wu et al. (Wu et al. 2021) investigated the air quality change on roadside air quality monition stations to reveal the impact of traffic on air pollutions variations. They found that in contrast to non-roadside stations, the air pollutants such as NOx and PM on roadside stations present obvious reduction during the lockdown period. Lin et al. (Lin et al. 2022) analyzed the impact of different vehicle types (passenger cars, light goods vehicles, heavy goods vehicles, and long HGVs) on PM2.5 and PM10 on the M25 motorway in the UK during the COVID-19 pandemic, and it was found that long HGVs had a greater impact on pollutants. Chen et al. (Chen et al. 2021) used the DID method to evaluate the relationship between different vehicle restrictions and air pollution during the COVID-19, and found that restricting fuel vehicles and restricting according to the last digit of the license plate number were more effective in reducing air pollution. Wang et al. (Wang et al. 2022) adopted traffic indices and air quality parameters to develop a complex network to analyze the impact of traffic on air pollution in different regions and at different stages of lockdown. Kovács and Haidu (2022) collected static traffic facility density data in French cities to study its impact on nitrogen dioxide concentrations during the pandemic and found a strong negative relationship (R²=0.808) between transport infrastructure and NO2 concentrations. Munir et al. (Munir et al. 2021) analyzed mobility and pollutant data during the COVID-19 and found a strong positive correlation between traffic and nitrogen oxides. Kumar et al. (2020) found a linear relationship between traffic flow and PM2.5 (R²=0.69).
Obviously, the emergence of lockdown policies during the COVID-19 pandemic has led to changes in traffic and pollutants, providing an opportunity to use actual data to study the characteristics of traffic and pollutants and their relationship. In previous studies, most scholars used the real data during the COVID-19 period to analyze the impact of traffic changes on pollutants and provide different viewpoints to understand it. However, most of the current studies only qualitatively pointed out whether there was a positive or negative correlation between traffic and pollutants, or started from the characteristics of vehicles and traffic facilities themselves to study the changes in pollutants under different types of vehicle restrictions and different facilities. Due to lack of the measurement data, the quantitative analysis of the specific relationships between urban traffic and air pollutants have been seldom conducted. The recovery process of urban traffic and pollutants after lockdown policy are also rarely investigated.
Hence, to address these research gaps, this study collected data on air pollutants and traffic volume in four large cities in Spain and United States. Traffic is the main source of nitrogen oxides in the atmosphere, and the concentration of O3 is affected by nitrogen oxides via titration reactions (Sicard et al. 2020; Menut et al. 2020). Therefore, NO2 and O3 were selected as the main research objects for this study. Firstly, the changes in NO2 and O3 concentrations and traffic volume during COVID-19 in these cities were analyzed. Then, the impact of urban traffic on air pollutants and the relationship between the two were discussed. Finally, the recovery process in the later stage of the COVID-19 pandemic was explored. The conclusions obtained will have far-reaching significance for formulating green and environmentally friendly traffic management policies and protecting human health.
Materials and methods
Study areas
The study area comprises of four metropolitan cities located in Spain and the United States, namely Madrid, Barcelona, Los Angeles, and Providence. Madrid is the capital and most populous city in Spain. Barcelona is the second most populous municipality in Spain and is a transport hub. Los Angeles is the second largest city in the United States, which has more than 10 million inhabitants. Providence is the capital and most populous city of the U.S. state of Rhode Island, with a population of over 190,000.
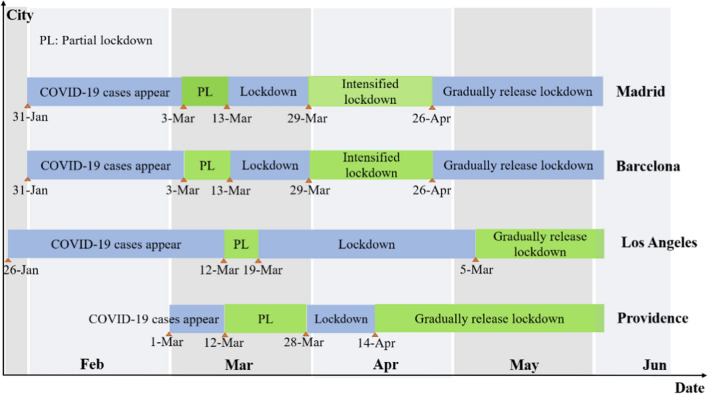
After the outbreak of COVID-19 in 2020, the governments of the study cities implemented different levels of lockdown policies to slow the spread of the virus. Madrid and Barcelona confirmed their first cases of COVID-19 on January 31, 2020 and proposed social distancing for residents on March 3. On March 14, 2020, Madrid and Barcelona started the lockdown and strengthened it on March 29, announcing that all non-essential workers to remain at home for the next 14 days. California, where Los Angeles is located, had the most confirmed cases of COVID-19 in the United States. It confirmed the first case of COVID-19 on January 26, 2020, and multiple cases were confirmed the following month. The government declared a state of emergency on March 4, and imposed a lockdown on March 19, issuing a statewide stay-at-home order. Rhode Island, where Providence is located, had its first two confirmed COVID-19 cases on March 1, 2020, and the governor declared a state of emergency on March 9. Since March 12, it was mandated to ban large-scale events and maintain social distancing in Providence. On March 28, the government issued a stay-at-home order that required residents who traveled non-essentially to stay at home. The lockdown timeline for each city is shown in the Fig. 1. The lockdown policies of the study cities mainly included the following: closing bars, restaurants, parks, cinemas, and other entertainment venues; schools and companies working in an online mode; prohibiting residents from gathering, enforcing social distancing norms; and requiring residents to stay at home except for essential travel.
Fig. 1.
Lockdown timeline and specific lockdown policies for the considered study cities
Data selection
The pollutant (NO2, O3) concentration data of the study cities during the COVID-19 pandemic in 2020 were obtained from the environmental monitoring stations in these countries (https://aqicn.org/data-platform/covid19). Monitoring stations in each study city are described in the Table 1. Average monitoring data from several monitoring stations in each country were used to represent the country’s air quality and meteorological conditions. The data provided by the monitoring stations were considered reliable (Kuerban et al. 2020; Lin et al. 2014), and there have been many studies based on monitoring station data (Abdullah et al. 2020; Nakada and Urban 2020; Siciliano et al. 2020). Pollutant data for 2019 were collected for subsequent comparison. Mobility data (private and public travel volume) from January 2020 to October 2021 were collected from Apple’s mobility data monitor (http://covid19.apple.com/mobility). Sannigrahi et al. (2020) and Munir et al. (Munir et al. 2021) used these data to study traffic changes during the COVID-19 and confirmed that these data was reliable and creditable. It should be noted that the data in this web is no longer available after April 14, 2022. We are willing to share it if other scholars need it in the future. More information about the data information can be found in the appendix file.
Table 1.
Information of monitoring stations in each study city
| City | Number of stations | Station’s name | Description of the data |
|---|---|---|---|
| Madrid | 10 | Torrejon de ardoz, Cuatro Caminos, Media Red, Fernandez Ladreda, alcorcon, Mendez Alvaro, Castellana, Plaza De Castilla, Escuelas Aguirre, Casa De Campo | The data is updated every 24 h, and the data is the average of monitoring stations in the city. |
| Barcelona | 14 | Poblenou, Eixample, Sant Adrià de Besòs, Sabadell (Av. Gran Via), Santa Perpètua de Mogoda, Sant Vicenç dels Horts, Gràcia-St. Gervasi, Barcelona, Palau Reial, l ' Hospitalet de Llobregat, Rubi (Ca n ' Oriol), Montcada i Reixac (Can Sant Joan), Parc Vall d ' Hebron, Montcada i Reixac | |
| Los Angeles | 5 | North Long Beach (Long Beach), Los Angeles-North Main Street, South Long Beach,Burbank, Long Beach-Route 710 Near Road | |
| Providence | 4 | Narragansett, E Providence, Near Road, Providence |
Besides, in order to remove the meteorology factors’ impact, the change of meteorology factors and air quality between 2020 and 2019 were compared (Table S1). According to the compassion of meteorology factors, the humidity as well as pressure, temperature and wind speed present small difference, that means the air quality change in 2020 were dominantly influenced by lockdown policy.
Methodology
The regression discontinuity design (RDD) method was first proposed by sociologists Thistlethwaite and Campbell in 1960 to evaluate social projects. Discontinuous regression designs are considered close to randomized controlled trials and have the greatest internal validity for alternative quasi-experimental estimators (Lee and Lemieux 2010; Qin et al. 2017; Zhu et al. 2022), which is a common and valid method for assessing policy effects. The RDD models can identify discontinuities in a variable by identifying jumps on either side of a breakpoint. If such discontinuities are tested and found to be statistically significant, a causal relationship between policy interventions and changes in that variable can be concluded. The main assumption of RDD is that only policy variables change significantly around the threshold, whereas other factors change continuously, and it is an effective and robust method for assessing policy effects (Zeng et al. 2020). RDD methods can be used to assess the impacts of policies on pollutants. Previous studies have used RDD to evaluate the changes in air quality after the promulgation of ecological protection-related regulations or after the implementation of the restriction policy during the G20 Hangzhou summit in China (Zeng et al. 2020; Wang et al. 2021).
In this study, after the COVID-19 outbreak, lockdown policies were implemented in each of the study cities, resulting in abrupt changes in traffic volumes and pollutant concentrations, largely consistent with the scenarios described in the RDD methodology. Therefore, this study applied a discontinuous regression design to assess the impact of lockdown on traffic volume and pollutants.
The dummy variable was defined to represent whether the lockdown policy was implemented, as shown in the Eq. (1). Further, the model for estimating the effect of the lockdown policy using RDD was defined as shown in the Eq. (2). Here, is the outcome variable representing the pollutant concentration or traffic volume at time . is a constant term, are coefficients, is the power of a polynomial, and the value of is usually between one and four. is a random error term and is the distance between time and the breakpoint (the time point when the lockdown policy is implemented).
| 1 |
| 2 |
The concept of resilience was first introduced in the field of ecology by Holling (1973) and later applied to various fields such as economics and psychology, which aroused the interest of many researchers (Hosseini et al. 2016). System resilience is used to evaluate the resilience of a system under disturbance events, and can be understood as the ability of the system to reduce the chances of a shock, absorb a shock if it occurs, and recover quickly after a shock (re-establish normal performance) (Bruneau et al. 2003). Under the disturbance of events, system performance can be divided in three stages: before disturbance, during disturbance, and after disturbance. Before a disturbance event occurs, the system operates under normal conditions, and the performance of the systems, such as capacity and demand, is not affected. When a disturbance event occurs, the system operates under the disturbance. During this period, the system is damaged, and its performance in providing various services degrades. The system begins to recover shortly after the disturbance event, a phase that can take a longer time compared to the duration of the disturbance event, during which the system performance begins to improve (Shafieezadeh and Burden 2014). The ratio of the area of the system performance curve under disturbance events to the area of the system performance curve under undisturbed conditions is often used to evaluate the system resilience (Shafieezadeh and Burden 2014; Ouyang et al. 2012; Barker et al. 2013). Urban transportation systems are prone to disruptions owing to natural disasters, human influences and so on. Although there is no unified definition of the resilience of transportation systems, various studies have analyzed it as normal urban transportation systems are important for smooth functioning of the cities (Ni et al. 2021). The lockdown policy during COVID-19 could also be regarded as a disturbance to the normal operation of a city. Some studies have examined the interruption-recovery patterns of urban air pollution under the impact of COVID-19 pandemic (Cai et al. 2021).
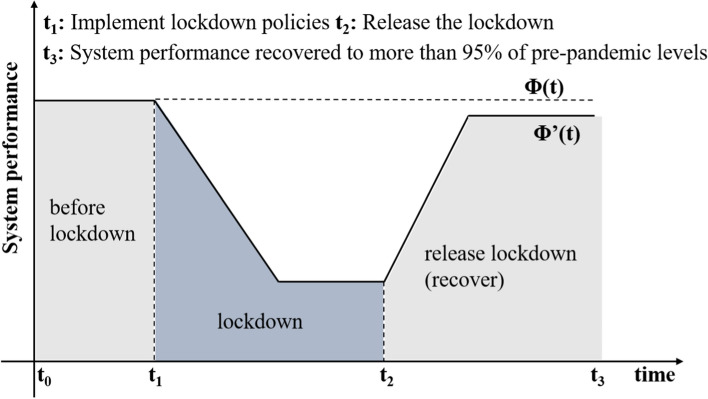
The lockdown policies implemented during the COVID-19 pandemic can be seen as disruptions to the system. In this study, based on the definition of system resilience (Barker et al. 2013), a similar model was developed to evaluate system performance during the COVID-19 pandemic, as shown in the Fig. 2. When not disturbed by lockdown policy, the system performance remains stable, and the performance curve is shown by the function , while under the influence of lockdown policy during COVID-19, the system performance curve is shown by the function . Time is the moment when the lockdown policy began to be implemented. After time , the system performance began to decline owing to the influence of the lockdown policy. After some time, it starts to recover from time , and the system performance improves and finally recovers to more than 95% of the system performance equivalent to the pre-lockdown at time . The definition of system resilience is shown in the Eq. 3, and is used to evaluate the resilience of transportation under the impact of COVID-19.
Fig. 2.
System performance curves under disturbance events [Φ(t): System function without event disturbance; Φ’(t): System function under disturbance event]
| 3 |
For convenience of discussion, the stages of traffic volume change in each study city were divided. Figure 3a shows the changing pattern of travel volume under the influence of the lockdown. Figure 3b shows the actual change curve of travel volume (taking Madrid as an example, the change curves of the other study cities are similar to Madrid, which will be described in detail later). For each study city, the period of rapid decline in travel volume is defined as the descending stage, and the period when travel volume rebounds is defined as the rising stage (recovery stage).
Fig. 3.
Variation modes of travel volume
Results and discussions
Change in traffic volume as a response to Covid-19 lockdown
During the COVID-19 pandemic in 2020, urban traffic volumes changed remarkably. To observe the impact of the lockdown policies on traffic, the RDD method was first used, and then the traffic volumes at different lockdown stages in each study city were compared. The different stages of the lockdown policy were as follows: pre-lockdown (no lockdown policy), partial lockdown (including social distancing, restrictions on large events), lockdown (stay-at-home order), and the release of lockdown.
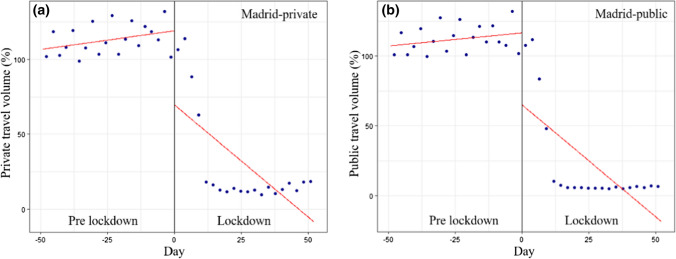
The lockdown time was a certain value, and all factors (pollutants and traffic) interfered after the lockdown. This fitted the situation described by the sharp RDD model; therefore, the sharp RDD model was used here. The date when each city started lockdown was the breakpoint (day 0), and the optimal parameters of the model were determined using the AIC criterion (Anderson and Burnham 2004; Akaike 1974). The regression discontinuity plots of travel volume in Madrid are shown in the Fig. 4. The black points represent the original variations of traffic volume in pre-lockdown and lockdown periods. The red line in the Fig. 4 shows the change trend of the travel volume fitted using the RDD method. Before the lockdown, public and private traffic volumes were relatively stable and rose slowly with time. Significant breakpoints in traffic volumes were observed after the lockdown, with both public and private traffic volumes falling significantly and remaining low for some time. As the scatter plots in Barcelona, Los Angeles, and Providence were similar to those in Madrid, they are not shown in this study.
Fig. 4.
Regression discontinuity plot of travel volumes in Madrid a Private travel, b Public travel
Besides, the envaulted results obtained by RDD for all the study cities are shown in the Table 2. As we known, RDD is generally used to assess the impacts of policies on variable change. The symbol “*” stands for significance. From the table, it can be found that the RDD values of traffic and NOx in four cities were negative, implied that the lockdown policy makes the traffic volume and NOx present obvious decrease. Conversely, the lockdown policy makes the O3 present increased trend. It can be mainly explained by an unprecedented reduction in NOx emissions leading to a lower O3 titration during COVID-19 period, which can also be confirmed with previous studies (Pierre Sicard et al. 2020).
Table 2.
RDD values for traffic volumes and air pollutants in four cities
| City | Private traffic | Public traffic | NO2 | O3 |
|---|---|---|---|---|
| Madrid | −0.728*** | −0.813*** | −0.138*** | 0.118*** |
| (0.159) | (0.165) | (0.043) | (0.044) | |
| Barcelona | −0.903*** | −0.987*** | −0.118*** | 0.163*** |
| (0.189) | (0.506) | (0.034) | (0.041) | |
| Los Angeles | −0.775*** | −0.856*** | −0.113** | 0.084** |
| (0.189) | (0.177) | (0.047) | (0.033) | |
| Providence | −0.303* | −0.492*** | −0.094*** | 0.104** |
| (0.155) | (0.160) | (0.032) | (0.040) |
The symbols *, **, and *** denote significance at the 10%, 5%, and 1% levels, respectively
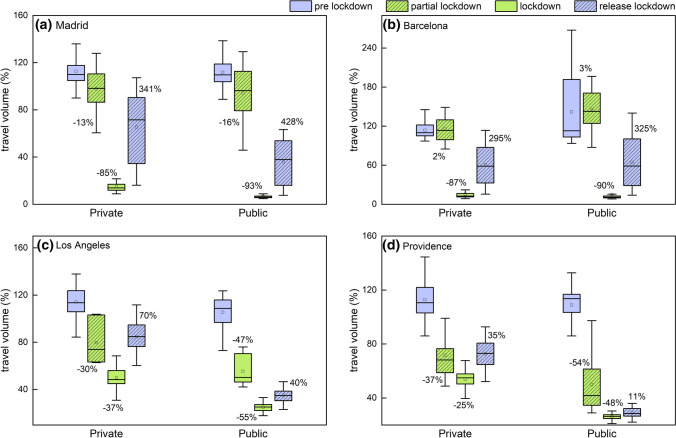
Specially, the change rates for traffic volumes and air pollutants during the different lockdown stages were investigated (Fig. 5). Both private and public travel volumes in Madrid, Los Angeles, and Providence decreased because of the implementation of the partial lockdown policy. Barcelona’s travel volume was close to that of the pre-lockdown period, which might be related to some essential activities in the city. After the implementation of full lockdown, compared with partial lockdown, the travel volume further decreased and reached the lowest value. At this time, the travel volume only reached approximately 10−40% of that before the lockdown. After the gradual release of the lockdown, traffic volume in each study city increased when compared with the time of lockdown but was still lower than before the lockdown. On comparing European cities and North American cities, it could be observed that travel volume decreased slightly after a partial lockdown in European cities, which decreased significantly after the full lockdown, while the traffic volume of North American cities after partial lockdown and full lockdown decreased by a similar amount. This was due to the different lockdown times and policies in these cities. In the Fig. 5, number next to the boxplot for each lockdown stage is the percentage change in travel volume in that phase relative to the travel volume in the previous phase. After the implementation of the lockdown, the decline in public travel volume in each study city was greater than that in private travel volume, indicating that public transport was more responsive to lockdown policies (Pozo et al. 2022; Shibayama et al. 2021; Corazza et al. 2021).
Fig. 5.
Travel volume in different lockdown stages (presented as a percentage calculated based on January 13, 2020)
Change in air quality as a response to Covid-19 lockdown
As a side effect of the lockdown, the pollutant concentrations changed significantly during this period. Similar to traffic, the RDD method was used to analyze pollutants, and the concentrations were compared at different stages of the lockdown.
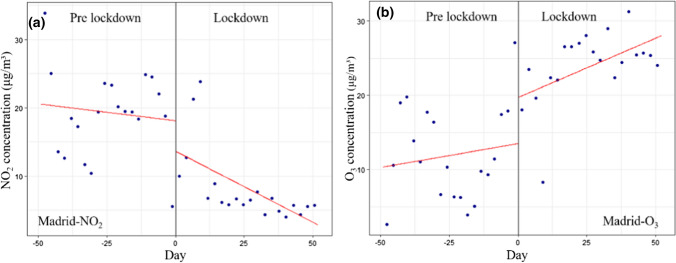
The regression discontinuity plots of pollutants (NO2, O3) and travel volume in Madrid are shown in the Fig. 6 (patterns found in Barcelona, Los Angeles, and Providence were similar to those in Madrid). Before the lockdown, the concentrations of NO2 and O3 fluctuated above and below the fitting line, the fluctuation range was large, and the pollutants did not show an obvious change with the date. After the lockdown, there were clear breakpoints in the concentration of the pollutants. The concentration of NO2 decreased and that of O3 increased and continued to decrease (NO2) or increase (O3) with time. The concentration also fluctuated above and below the fitting line; however, the fluctuation range was small. The regression discontinuity design results for the pollutants are presented in the Table 2. The lockdown policy had a significant promoting effect on the reduction of NO2 concentrations and an increase in O3 concentrations.
Fig. 6.
Regression discontinuity plot of pollutants in Madrid a NO2; b O3
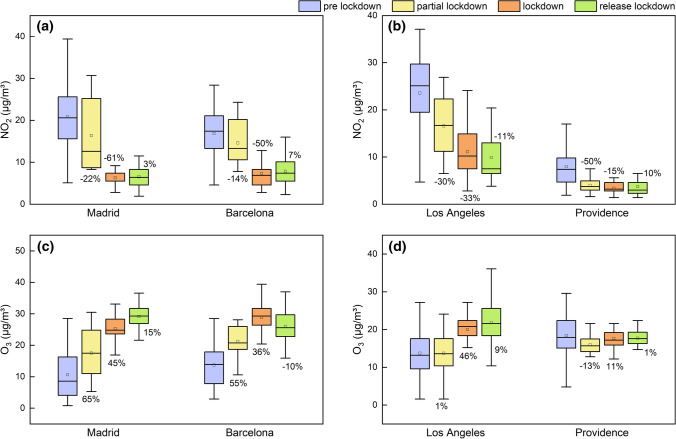
Figure 7 presents the concentrations of pollutants (NO2 and O3) in the study cities at different stages of the lockdown. Affected by the lockdown policy, the concentration of NO2 in the study cities decreased significantly after the partial lockdown and continued to decrease after the full lockdown. In contrast, the concentration of O3 increased during both the partial lockdown and lockdown phases. Traffic is the main source of NO2 in the atmosphere (Wang et al. 2020), and the reduction in travel volume is the main reason for the reduction in NO2 concentration. The increase in O3 concentration is related to its chemical reaction with NOx, and the reduction in nitrogen oxides (NO) reduces the consumption of O3 (titration, NO + O3 = NO2 + O2), resulting in an increase in O3 concentration (Tobías et al. 2020). In the Fig. 7, number next to the boxplot for each lockdown stage is the percentage change in pollutant concentration in that phase relative to the pollutant concentration in the previous phase. The NO2 concentration decreased by approximately 50%, and the O3 concentration increased by approximately 40% during the lockdown period. During the release of the lockdown period, NO2 concentrations slightly increased in Madrid, Barcelona, and Providence, whereas those in Los Angeles decreased slightly. O3 concentrations increased in Madrid and Los Angeles; and decreased in Barcelona and Providence. At this stage, the factors affecting the concentration of pollutants were not only the changes in travel volume but also the release of other activities and seasonal factors; therefore, the regularity of pollutants was not as obvious as in the lockdown stage.
Fig. 7.
Concentration of NO2 and O3 in different lockdown stages in study cities
Correlation between travel volume and air quality during Covid 19 lockdown
To further understand the impact of the lockdown policy on travel volume and pollutant concentrations during COVID-19, the functional relationship between the rate of change in travel volume and the rate of change in pollutant concentration was explored. The descending stage was studied according to the description shown in the Fig. 3.
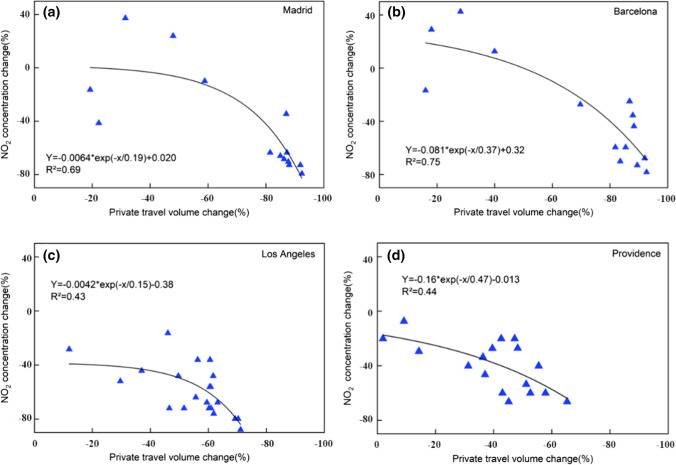
Figure 8 shows the fitting relationship between the rate of change of private traffic volume and the rate of change of NO2 concentration during the descending stage of travel volume. It can be seen from the Fig. 8 that in study cities, there was an exponential function relationship between these two (R²: 0.69 in Madrid, 0.75 in Barcelona, 0.43 in Los Angeles, 0.44 in Providence), and the more private travel volume decreased, the more NO2 concentration reduced. When the reduction rate of private traffic volume was less than 40%, the NO2 concentration decreased slowly. When the reduction rate of private traffic volume exceeded 40%, the NO2 concentration decreased rapidly. Such findings are different to the previous studies in which the linear relationships were obtained in it (Munir et al. 2021; Wang et al. 2020).
Fig. 8.
Relationship between private travel and NO2 in study cities
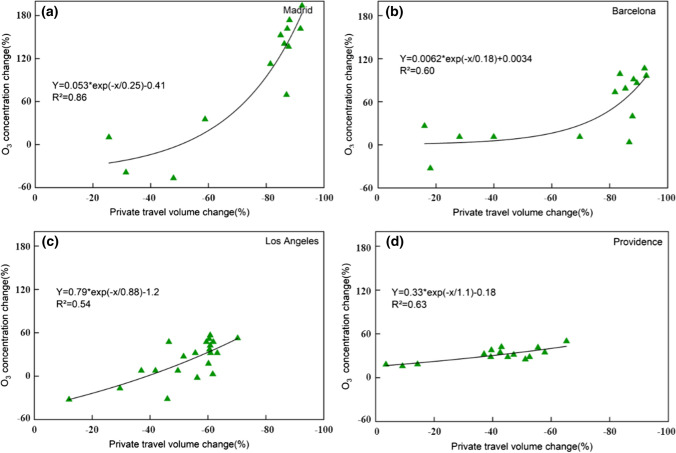
The relationship between the rate of change of O3 concentration and rate of change of private traffic volume was also fitted (Fig. 9), and it can be observed that the relationship between these two also followed an exponential function (R²:0.86 in Madrid, 0.60 in Barcelona, 0.54 in Los Angeles, 0.63 in Providence). Contrary to the relationship between NO2 and traffic volume, the greater the decrease in private traffic volume, the greater was the increase in O3 concentration. When the reduction rate of private traffic volume was higher than 40%, the O3 concentration increased significantly. From the fitting results, the fitting effect between private traffic volume and O3 concentration was slightly better than that of NO2.
Fig. 9.
Relationship between private travel and O3 in study cities
This function was also fitted to public travel volume and pollutant concentrations. All the fitting results are listed in the Table 3. The relationship between public travel volume and pollutants (NO2, O3) concentration also conformed to an exponential function [R² (NO2):0.67 in Madrid, 0.71 in Barcelona, 0.60 in Los Angeles, 0.42 in Providence; R² (O3):0.87 in Madrid, 0.56 in Barcelona, 0.51 in Los Angeles, 0.57 in Providence], similar to private travel volume, when the reduction rate of public travel volume was higher than 40%, significant changes in pollutant concentrations could be observed. The goodness of fit of the exponential function for European cities was slightly higher than that for North American cities, which might be due to the different lockdown policies in Spain and United States.
Table 3.
Relationship between public travel and pollutants in study cities (The numbers in parentheses on the right side of the fitting equation were the values of R².)
| City | Type | Fitting formula (NO2) | Fitting formula (O3) |
|---|---|---|---|
| Madrid | Private | Y= − 0.0064*exp(− x/0.19) + 0.020 (0.69) | Y = 0.053*exp(− x/0.25) − 0.41 (0.86) |
| Public | Y= − 2.79*exp(− x/0.12) + 0.0062 (0.67) | Y = 0.0022*exp(− x/0.14) − 0.27 (0.87) | |
| Barcelona | Private | Y= − 0.081*exp(− x/0.37) + 0.32 (0.75) | Y = 0.0062*exp(− x/0.18) + 0.0034 (0.60) |
| Public | Y= − 0.11*exp(− x/0.45) + 0.25 (0.71) | Y = 0.056*exp(− x/0.35) − 0.041 (0.56) | |
| Los Angeles | Private | Y= − 0.0042*exp(− x/0.15) − 0.38 (0.43) | Y = 0.79*exp(− x/0.88) − 1.2 (0.54) |
| Public | Y= − 4.04*exp(− x/0.086) − 0.36 (0.60) | Y = 0.63*exp(− x/0.75) − 0.9 (0.51) | |
| Providence | Private | Y= − 0.16*exp(− x/0.47) − 0.013 (0.44) | Y = 0.33*exp(− x/1.1) − 0.18 (0.63) |
| Public | Y= − 0.045*exp(− x/0.34) − 0.13 (0.42) | Y = 0.14*exp(− x/0.75) + 0.019 (0.57) |
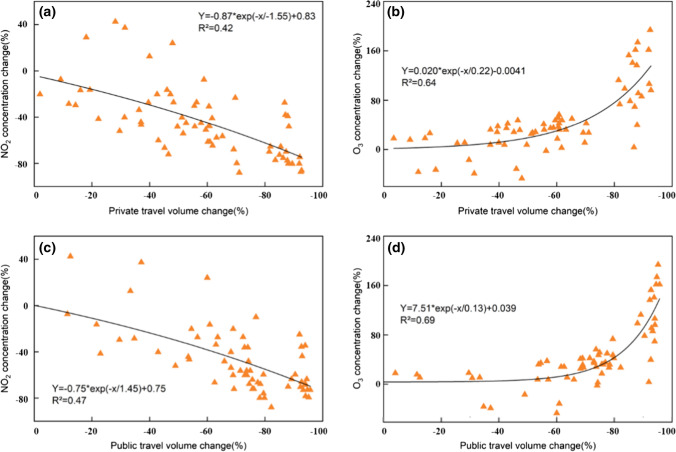
The results of fitting all data points of the study cities are shown in the Fig. 10. Combining all the data of four cities, although the goodness of fit was slightly lower than when fitting each city separately, the relationship between traffic travel volume and pollutant concentration still conformed to an exponential function [R² (Private):0.42 (NO2), 0.64 (O3); R² (Public):0.47 (NO2), 0.69 (O3)]. As the travel volume decreased, the NO2 concentration decreased and the O3 concentration increased. This shows that this exponential relationship is widely applicable between traffic and pollutant concentrations, and this conclusion can provide a reference for emission reduction control of urban traffic pollutants.
Fig. 10.
Relationship between traffic and pollutants in all study cities
Correlation between travel volume and air quality during recovery period
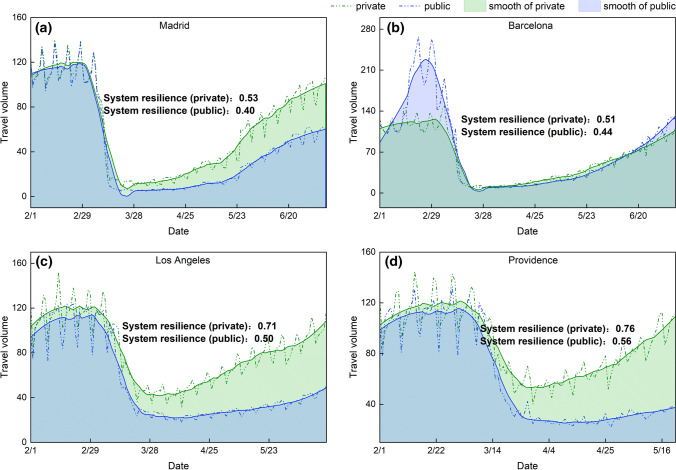
Figure 11 shows the recovery curves of public and private traffic volumes for the study cities during the 2020 COVID-19 pandemic (as described in Sect. 2.3, when the system performance recovers to more than 95% of the system performance before the disturbance event, it can be considered that the system has been recovered, and the research period of each city was selected accordingly). Before the outbreak of COVID-19, the periodicity of traffic volumes in various cities were observed. After the implementation of the lockdown policies, travel volumes dropped sharply and then remained low for a while before slowly recovering. The decline in the public traffic volume was even greater. The recovery process for private transport in Madrid, Barcelona, and Los Angeles continued until mid-to-late June 2020 and in Providence until late May 2020. The lockdown in Providence lasted for a shorter period than that in the other three cities, which led to differences in travel volumes during recovery times. The recovery process for private transport lasted approximately four months, whereas the recovery for public transport took longer. Figure 11 also shows the system resilience of private transport and public transport in each city [Madrid:0.53 (private), 0.40 (public); Barcelona:0.51 (private), 0.44 (public); Los Angeles:0.71 (private), 0.50 (public); Providence:0.76 (private), 0.56 (public)]. The system resilience of private transport in the study cities was higher than that of public transport. Public transport was more vulnerable to policies and took longer to recover, and during the COVID-19 pandemic, residents might have been more inclined to choose private transport to avoid gatherings.
Fig. 11.
Travel volume recovery curves for study cities a Madrid, b Barcelona, c Los Angles and d Providence
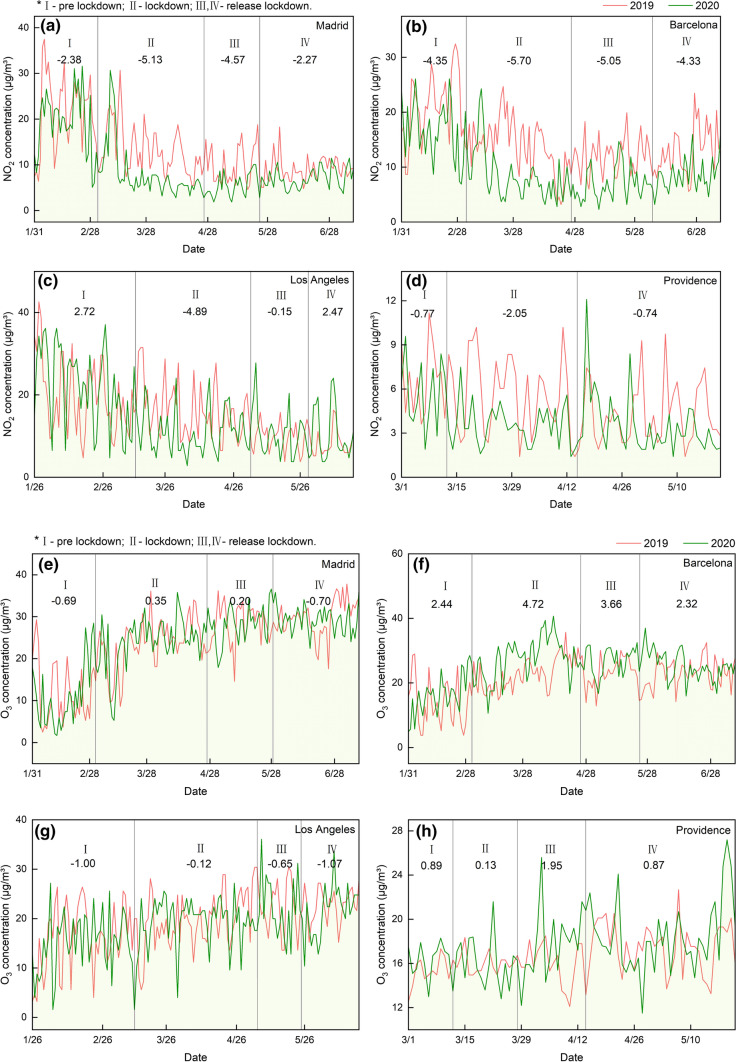
Due to the large time span between the recovery stage and the pre-lockdown period, to avoid seasonal differences in pollutants, the pollutant concentrations in 2020 were compared with the concentrations for same month in 2019 when studying the recovery process of pollutants. Figure 12 shows a comparison of pollutant (NO2 and O3) concentrations in the study cities in 2019 and 2020. It could be observed that the annual trends of pollutants in these two years were consistent. The dates were divided into intervals based on the time when the lockdown policy was implemented, and the daily average difference in pollutant concentrations between 2020 and 2019 in the study cities in each interval was calculated. After the gradual opening of the lockdown, compared with the lockdown period, the difference between the concentrations of NO2 and O3 in 2020 and 2019 gradually became smaller (phase III) and finally approached that before COVID-19 (phase IV). At this time, it can be considered that the pollutant concentrations had recovered. The pollutant recovery process lasted for approximately one month.
Fig. 12.
Pollutant recovery curves for study cities (The number represents the average of the difference in NO2 and O3 concentration between 2020 and 2019 during this phase)
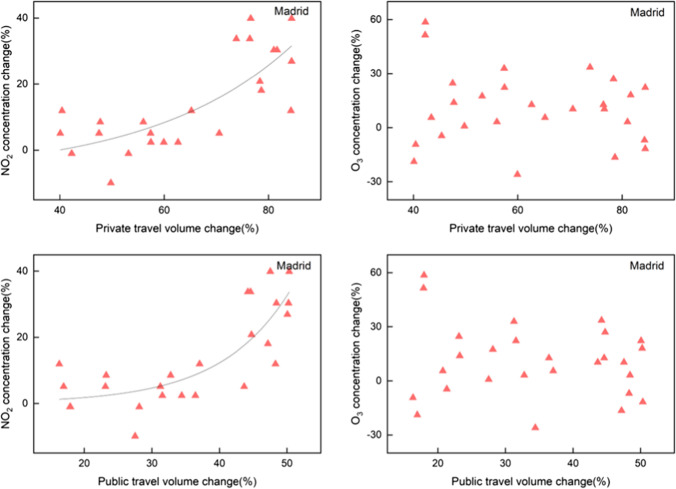
To further explore the relationship between traffic and pollutants, the methodology described in the Sect. 3.3 was also used to explore functional relationships for the recovery stage in Fig. 13. It should be noted that the recovery process only in Madrid are shown in the Fig. 13 to reveal the rising stage clearly and the corresponding results in other cities are shown in appendix file (Figs. S1−S3). During the recovery stage, only the rate of change of public and private traffic volumes in Madrid fitted an exponential relationship with the rate of change in NO2 concentration, and no obvious fitting relationship was observed in other cities. As mentioned earlier, the traffic recovery process in the study cities lasted approximately for four months, while the pollutant recovery only lasted approximately for a month, indicating that the impact on pollutants from traffic reductions caused by lockdown policies was a short-term effect. When the lockdown policy was first implemented, traffic became the main factor affecting the concentration of pollutants, owing to the sudden and substantial reduction in traffic volume. At this stage, there is an exponential relationship between traffic volume and pollutant concentrations. With time, other activities of the residents gradually resumed, and the meteorological conditions began to change. At this time, traffic may no longer be the most important factor affecting the pollutant concentrations. Therefore, during the recovery stage, it was reasonable to conclude that there was no obvious functional relationship between the traffic volume and pollutant concentrations.
Fig. 13.
Relationship between travel and pollutants in Madrid (rising stage)
Discussion
Using real-world data collected during the COVID-19 period, this study investigated the relationships between traffic and pollutants and compared their recovery processes. Based on the original data, we discovered that the traffic volume and NO2 concentration decreased, while the O3 concentration increased during the lockdown. The RDD method was used to verified that these changes were both caused by the lockdown policy. In previous studies, Wu et al. (Wu et al. 2021) used the air pollution data at roadside monitoring stations to confirm that traffic had a significant effect on pollutants while Munir et al. (Munir et al. 2021) verified a negative correlation between traffic and NO2, but did not specify the relationship. Different to them, we determined an exponential function to represent the relationships between traffic and pollutants (O3, NO2). NO2 concentration decreased exponentially and the O3 concentration increased exponentially as traffic volume decreased. When the change in traffic volume was greater than 40%, the change in pollutant concentration was evident, providing quantitative data for determining the relationship between traffic and pollutants. Additionally, we used the data during the lockdown to explore the recovery process for pollutants and traffic. The recovery process of the transportation system showed clear regularity. Specially, the system resilience of public transportation was greater than that of private transportation. In contrast to it, the recovery of pollutants was less predictable. These findings contributed to a greater comprehension of the relationship between transportation and pollutants.
Currently, many cities have formulated diverse traffic restriction policies in an effort to reduce traffic congestion and improve air quality. This study offered some insights from the standpoint of pollution reduction, and the conclusions could be applied to estimate the extent to which traffic restriction policies would simultaneously reduce pollution. In addition, the promotion of public transportation would reduce the use of private vehicles. When formulating policies to promote public transportation, the conclusions of this study would also offer suggestions for reducing pollution. Finally, the conclusions obtained in this study showed good consistency in the four studied cities. Although the parameters of the conclusions drawn in this study might be different in different cities due to different city scales and development levels, the analyzed procedure we proposed could be well generalized to other cities around the world.
Of course, this study still has some limitations. Data from the ground monitoring stations used in this study were monitored at fixed locations. The use of data from more monitoring locations may lead to more accurate conclusions. In the future, mobile monitoring data can be considered for more analysis. For example, the data from Sentinel-5 TROPMI remote sensing data is also an excellent choice for studying this problem (Bauwens et al. 2020; Shami et al. 2022). It can be considered to combine remote sensing data with ground data to more accurately assess the impact of lockdown policies on pollutants.
Conclusion
This study explored the changes in traffic volumes and air pollution in response to the COVID-19 lockdown in four metropolitan areas in Spain and the United States. A regression discontinuity design model was used to reveal the impact of the traffic restriction policy during the COVID-19 pandemic on traffic and air pollutants. The correlation between them was analyzed to determine the extent to which traffic restriction policies can improve air quality. Finally, the recovery processes for traffic and air pollutants were compared. The main conclusions are summarized as follows.
First, the COVID-19 lockdown policies were confirmed to lead to an obvious decrease in traffic volume and an evident change in NO2 and O3 concentrations. Both the public and private traffic volumes in the study cities decreased from 60 to 90%. Public transport was more susceptible to being affected by the lockdown policy than private transport was. In addition, the NO2 concentration maximally decreased by 50%, while the O3 concentration maximally increased by 40%.
Second, NO2 and O3 concentrations were verified to exhibit exponential variations as the traffic volume linearly decreased. In particular, NO2 concentration decreased exponentially, whereas O3 concentration increased exponentially. Additionally, both pollutants were found to vary smoothly at a low decrease in traffic volume but showed sharp variations when the traffic volume was reduced by more than 40%.
Third, the resilience of traffic volume and air pollutants was analyzed and compared through the investigation of their recovery processes during the post-lockdown period. The traffic volume was confirmed to recover to normal situations within four months and showed good resilience. In contrast to it, the air pollutant were found to recover randomly, implying that the variations of air pollutants are complicated and the resilience of the recovery process was weak.
In summary, these conclusions provide a reference for urban pollutant control using vehicle restrictions. The exponential relationship between traffic and pollutant concentrations could provide city managers with a better understanding of the quantitative relationship between traffic changes and pollutant concentrations and provide suggestions for how to control traffic to improve air quality.
Supplementary Information
Below is the link to the electronic supplementary material.
Author contributions
Si-qing Xu and Hong-Di He: research design; Ming-ke Yang: data collection; Xin-hang Zhu and Cui-lin Wu: data analysis; Zhong-ren Peng and Yuya Sasaki: results interpretation; Si-qing Xu: draft manuscript; Kenji Doi and Shinji Shimojo: revised manuscript. All authors reviewed the results and approved the final version of the manuscript.
Funding
This work was supported by the National Natural Science Foundation of China (No.12072195) and the National Planning Office of Philosophy and Social Science (No. 16ZDA048).
Declarations
Conflict of interest
The authors declare that there is no conflict of interests regarding the publication of this article.
Footnotes
Publisher’s Note
Springer Nature remains neutral with regard to jurisdictional claims in published maps and institutional affiliations.
References
- Abdullah S, Mansor AA, Napi NNLM, Mansor WNW, Ahmed AN, Ismail M, Ramly ZTA. Air quality status during 2020 Malaysia movement control order (MCO) due to 2019 novel coronavirus (2019-nCoV) pandemic. Sci Total Environ. 2020;729:139022. doi: 10.1016/j.scitotenv.2020.139022. [DOI] [PMC free article] [PubMed] [Google Scholar]
- Akaike H. A new look at the statistical model identification. IEEE Trans Autom Control. 1974;19(6):716–723. doi: 10.1109/TAC.1974.1100705. [DOI] [Google Scholar]
- Anderson D, Burnham K. Model selection and multi-model inference. 2. NY: Springer-Verlag; 2004. [Google Scholar]
- Barker K, Ramirez-Marquez JE, Rocco CM. Resilience-based network component importance measures. Reliab Eng Syst Saf. 2013;117:89–97. doi: 10.1016/j.ress.2013.03.012. [DOI] [Google Scholar]
- Bauwens M, Compernolle S, Stavrakou T, Müller JF, Van Gent J, Eskes H, Zehner C. Impact of coronavirus outbreak on NO2 pollution assessed using TROPOMI and OMI observations. Geophys Res Lett. 2020;47(11):e2020GL087978. doi: 10.1029/2020GL087978. [DOI] [PMC free article] [PubMed] [Google Scholar]
- Bruneau M, Chang SE, Eguchi RT, Lee GC, O’Rourke TD, Reinhorn AM, Von Winterfeldt D. A framework to quantitatively assess and enhance the seismic resilience of communities. Earthq spectra. 2003;19(4):733–752. doi: 10.1193/1.1623497. [DOI] [Google Scholar]
- Cai H, Xie S. Traffic-related air pollution modeling during the 2008 Beijing Olympic Games: the effects of an odd-even day traffic restriction scheme. Sci Total Environ. 2011;409(10):1935–1948. doi: 10.1016/j.scitotenv.2011.01.025. [DOI] [PubMed] [Google Scholar]
- Cai WJ, Wang HW, Wu CL, Lu KF, Peng ZR, He HD. Characterizing the interruption-recovery patterns of urban air pollution under the COVID-19 lockdown in China. Build Environ. 2021;205:108231. doi: 10.1016/j.buildenv.2021.108231. [DOI] [PMC free article] [PubMed] [Google Scholar]
- Chen Z, Hao X, Zhang X, Chen F. Have traffic restrictions improved air quality? A shock from COVID-19. J Clean Prod. 2021;279:123622. doi: 10.1016/j.jclepro.2020.123622. [DOI] [PMC free article] [PubMed] [Google Scholar]
- Chen Z, Zan Z, Jia S (2022) Effect of urban traffic-restriction policy on improving air quality based on system dynamics and a non-homogeneous discrete grey model. In: Clean technologies and environmental policy, pp 1–20 [DOI] [PMC free article] [PubMed]
- Corazza MV, Moretti L, Forestieri G, Galiano G. Chronicles from the new normal: urban planning, mobility and land-use management in the face of the COVID-19 crisis. Transp Res Interdiscip Perspect. 2021;12:100503. doi: 10.1016/j.trip.2021.100503. [DOI] [PMC free article] [PubMed] [Google Scholar]
- Depellegrin D, Bastianini M, Fadini A, Menegon S. The effects of COVID-19 induced lockdown measures on maritime settings of a coastal region. Sci Total Environ. 2020;740:140123. doi: 10.1016/j.scitotenv.2020.140123. [DOI] [PMC free article] [PubMed] [Google Scholar]
- GÜNER HR, Hasanoğlu İ, Aktaş F. COVID-19: prevention and control measures in community. Turk J Med Sci. 2020;50(SI–1):571–577. doi: 10.3906/sag-2004-146. [DOI] [PMC free article] [PubMed] [Google Scholar]
- Holling CS. Resilience and stability of ecological systems. Annu Rev Ecol Syst. 1973;4(1):1–23. doi: 10.1146/annurev.es.04.110173.000245. [DOI] [Google Scholar]
- Hosseini S, Barker K, Ramirez-Marquez JE. A review of definitions and measures of system resilience. Reliab Eng Syst Saf. 2016;145:47–61. doi: 10.1016/j.ress.2015.08.006. [DOI] [Google Scholar]
- Kovács KD, Haidu I (2022) Tracing out the effect of transportation infrastructure on NO2 concentration levels with Kernel density estimation by investigating successive COVID-19-induced lockdowns. In: Environmental Pollution, p 119719 [DOI] [PubMed]
- Kuerban M, Waili Y, Fan F, Liu Y, Qin W, Dore AJ, Zhang F. Spatio-temporal patterns of air pollution in China from 2015 to 2018 and implications for health risks. Environ Pollut. 2020;258:113659. doi: 10.1016/j.envpol.2019.113659. [DOI] [PubMed] [Google Scholar]
- Kumar P, Hama S, Omidvarborna H, Sharma A, Sahani J, Abhijith KV, Tiwari A. Temporary reduction in fine particulate matter due to ‘anthropogenic emissions switch-off’during COVID-19 lockdown in indian cities. Sustain Cities Soc. 2020;62:102382. doi: 10.1016/j.scs.2020.102382. [DOI] [PMC free article] [PubMed] [Google Scholar]
- Lal P, Kumar A, Kumar S, Kumari S, Saikia P, Dayanandan A, Khan ML. The dark cloud with a silver lining: assessing the impact of the SARS COVID-19 pandemic on the global environment. Sci Total Environ. 2020;732:139297. doi: 10.1016/j.scitotenv.2020.139297. [DOI] [PMC free article] [PubMed] [Google Scholar]
- Lee DS, Lemieux T. Regression discontinuity designs in economics. J Econ Lit. 2010;48(2):281–355. doi: 10.1257/jel.48.2.281. [DOI] [Google Scholar]
- Li L, Li Q, Huang L, Wang Q, Zhu A, Xu J, Chan A. Air quality changes during the COVID-19 lockdown over the Yangtze River Delta Region: an insight into the impact of human activity pattern changes on air pollution variation. Sci Total Environ. 2020;732:139282. doi: 10.1016/j.scitotenv.2020.139282. [DOI] [PMC free article] [PubMed] [Google Scholar]
- Lin G, Fu J, Jiang D, Hu W, Dong D, Huang Y, Zhao M. Spatio-temporal variation of PM2. 5 concentrations and their relationship with geographic and socioeconomic factors in China. Int J Environ Res Public Health. 2014;11(1):173–186. doi: 10.3390/ijerph110100173. [DOI] [PMC free article] [PubMed] [Google Scholar]
- Lin S, Liu Y, Chen H, Wu S, Michalaki V, Proctor P, Rowley G (2022) Impact of change in traffic flow on vehicle non-exhaust PM2. 5 and PM10 emissions: a case study of M25 motorway, UK. Chemosphere, p 135069 [DOI] [PubMed]
- Menut L, Bessagnet B, Siour G, Mailler S, Pennel R, Cholakian A. Impact of lockdown measures to combat Covid-19 on air quality over western Europe. Sci Total Environ. 2020;741:140426. doi: 10.1016/j.scitotenv.2020.140426. [DOI] [PMC free article] [PubMed] [Google Scholar]
- Muhammad S, Long X, Salman M. COVID-19 pandemic and environmental pollution: A blessing in disguise? Sci Total Environ. 2020;728:138820. doi: 10.1016/j.scitotenv.2020.138820. [DOI] [PMC free article] [PubMed] [Google Scholar]
- Munir S, Coskuner G, Jassim MS, Aina YA, Ali A, Mayfield M. Changes in air quality associated with mobility trends and meteorological conditions during COVID-19 lockdown in Northern England. UK Atmos. 2021;12(4):504. doi: 10.3390/atmos12040504. [DOI] [Google Scholar]
- Nakada LYK, Urban RC. COVID-19 pandemic: impacts on the air quality during the partial lockdown in São Paulo state, Brazil. Sci Total Environ. 2020;730:139087. doi: 10.1016/j.scitotenv.2020.139087. [DOI] [PMC free article] [PubMed] [Google Scholar]
- Ni X, Osaragi T, Huang H, Li R, Chen A. Resilience-oriented performance assessment method for road-traffic system: a case study in Beijing, China. KSCE J Civ Eng. 2021;25(10):3977–3994. doi: 10.1007/s12205-021-2098-y. [DOI] [Google Scholar]
- Ouyang M, Dueñas-Osorio L, Min X. A three-stage resilience analysis framework for urban infrastructure systems. Struct Saf. 2012;36:23–31. doi: 10.1016/j.strusafe.2011.12.004. [DOI] [Google Scholar]
- Pozo RF, Wilby MR, Díaz JJV, González ABR (2022) Data-driven analysis of the impact of COVID-19 on Madrid’s public transport during each phase of the pandemic. Cities, 103723 [DOI] [PMC free article] [PubMed]
- Qin X, Zhuang CC, Yang R. Does the one-child policy improve children’s human capital in urban China? A regression discontinuity design. J Comp Econ. 2017;45(2):287–303. doi: 10.1016/j.jce.2016.09.001. [DOI] [Google Scholar]
- Sannigrahi S, Molter A, Kumar P, Zhang Q, Basu B, Basu AS, Pilla F (2020) Examining the status of improved air quality due to COVID-19 lockdown and an associated reduction in anthropogenic emissions. medRxiv [DOI] [PMC free article] [PubMed]
- Shafieezadeh A, Burden LI. Scenario-based resilience assessment framework for critical infrastructure systems: case study for seismic resilience of seaports. Reliab Eng Syst Saf. 2014;132:207–219. doi: 10.1016/j.ress.2014.07.021. [DOI] [Google Scholar]
- Shakil MH, Munim ZH, Tasnia M, Sarowar S. COVID-19 and the environment: a critical review and research agenda. Sci Total Environ. 2020;745:141022. doi: 10.1016/j.scitotenv.2020.141022. [DOI] [PMC free article] [PubMed] [Google Scholar]
- Shami S, Ranjgar B, Bian J, Khoshlahjeh Azar M, Moghimi A, Amani M, Naboureh A. Trends of CO and NO2 Pollutants in Iran during COVID-19 pandemic using Timeseries Sentinel-5 images in Google Earth Engine. Pollutants. 2022;2(2):156–171. doi: 10.3390/pollutants2020012. [DOI] [Google Scholar]
- Shibayama T, Sandholzer F, Laa B, Brezina T. Impact of COVID-19 lockdown on commuting: a multi-country perspective. Eur J Transp Infrastruct Res. 2021;21(1):70–93. [Google Scholar]
- Sicard P, De Marco A, Agathokleous E, Feng Z, Xu X, Paoletti E, Calatayud V. Amplified ozone pollution in cities during the COVID-19 lockdown. Sci Total Environ. 2020;735:139542. doi: 10.1016/j.scitotenv.2020.139542. [DOI] [PMC free article] [PubMed] [Google Scholar]
- Siciliano B, Dantas G, da Silva CM, Arbilla G. Increased ozone levels during the COVID-19 lockdown: analysis for the city of Rio de Janeiro, Brazil. Sci Total Environ. 2020;737:139765. doi: 10.1016/j.scitotenv.2020.139765. [DOI] [PMC free article] [PubMed] [Google Scholar]
- Tobías A, Carnerero C, Reche C, Massagué J, Via M, Minguillón MC, Querol X. Changes in air quality during the lockdown in Barcelona (Spain) one month into the SARS-CoV-2 epidemic. Sci Total Environ. 2020;726:138540. doi: 10.1016/j.scitotenv.2020.138540. [DOI] [PMC free article] [PubMed] [Google Scholar]
- Wang Q, Su M. A preliminary assessment of the impact of COVID-19 on environment–a case study of China. Sci Total Environ. 2020;728:138915. doi: 10.1016/j.scitotenv.2020.138915. [DOI] [PMC free article] [PubMed] [Google Scholar]
- Wang Y, Yuan Y, Wang Q, Liu C, Zhi Q, Cao J. Changes in air quality related to the control of coronavirus in China: implications for traffic and industrial emissions. Sci Total Environ. 2020;731:139133. doi: 10.1016/j.scitotenv.2020.139133. [DOI] [PMC free article] [PubMed] [Google Scholar]
- Wang R, Huang J, Zhang L, Xia Y, Xu X, Nong T (2021) Assessments of air pollution control effectiveness based on a sharp regression discontinuity design—evidence from China’s Environmental Big Data. Front Environ Sci 351
- Wang W, Yang S, Yin K, Zhao Z, Ying N, Fan J. Network approach reveals the spatiotemporal influence of traffic on air pollution under COVID-19. Chaos: an interdisciplinary. J Nonlinear Sci. 2022;32(4):041106. doi: 10.1063/5.0087844. [DOI] [PMC free article] [PubMed] [Google Scholar]
- Wu CL, Wang HW, Cai WJ, Ni AN, Peng ZR. Impact of the COVID-19 lockdown on roadside traffic-related air pollution in Shanghai, China. Build Environ. 2021;194:107718. doi: 10.1016/j.buildenv.2021.107718. [DOI] [PMC free article] [PubMed] [Google Scholar]
- Zeng J, Guijarro M, Carrilero-Castillo A. A regression discontinuity evaluation of the policy effects of environmental regulations. Econ Res Ekonomska istraživanja. 2020;33(1):2993–3016. doi: 10.1080/1331677X.2019.1699437. [DOI] [Google Scholar]
- Zhu XH, He HD, Lu KF, Peng ZR, Gao HO. Characterizing carbon emissions from China V and China VI gasoline vehicles based on portable emission measurement systems. J Clean Prod. 2022;378:134458. doi: 10.1016/j.jclepro.2022.134458. [DOI] [Google Scholar]
Associated Data
This section collects any data citations, data availability statements, or supplementary materials included in this article.


