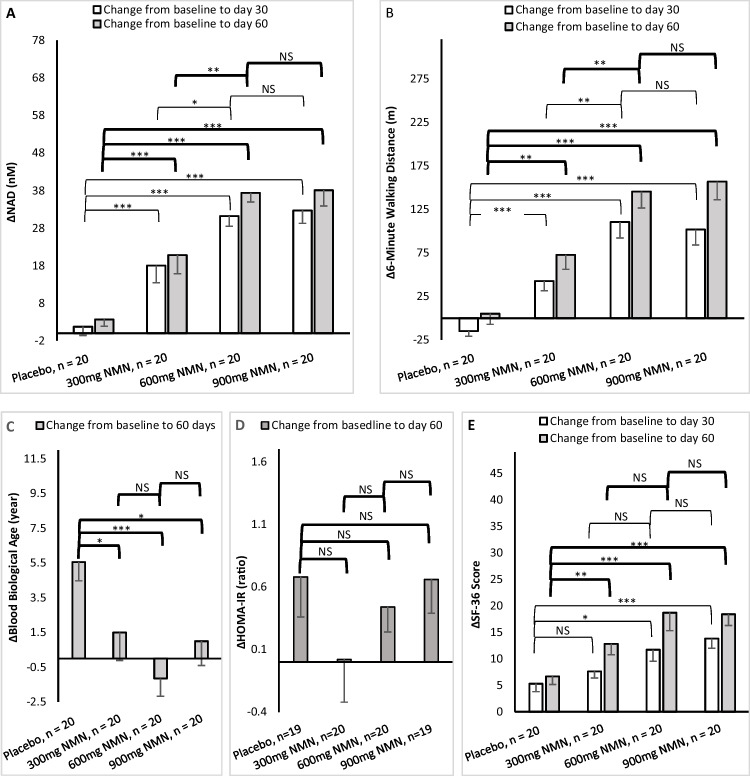
Fig. 2.
Efficacy of the placebo and three NMN-treated groups, comparisons of the three treated groups vs. placebo, 600 mg vs. 300 mg, and 900 mg vs. 600 mg on the changes of efficacy (Δmean ± SEM) from baseline to day 30 and/or day 60. A Comparisons on the changes of blood NAD concentrations from baseline to day 30 and day 60. B Comparisons on the changes of 6-minute walking distances from baseline to day 30 and day 60. C Comparisons on the changes of blood biological ages from baseline to day 60. D Comparisons on the changes of HOMA-IR ratio from baseline to day 60. E Comparisons on the changes of SF-36 scores from baseline to day 30 and day 60. Statistical significance is set at p < 0.05 (*), <0.01 (**), <0.001(***), and p > 0.05 = not significant (NS). Mixed model of repeated measure (MMRM) was used for blood NAD concentration, six-minute walking test, and SF-36 scores. Paired t test was used for blood biological age. Mann–Whitney U test was used for HOMA-IR. Blood NAD concentration data are the total concentration of “NAD+ + NADH” in serum. SEM = standard error of measurement

