Abstract
The ever‐increasing body of ataxia research provides opportunities for large‐scale meta‐analyses, systematic reviews, and data aggregation. Because multiple standardized scales are used to quantify ataxia severity, harmonization of these measures is necessary for quantitative data pooling. We applied the modified Friedreich Ataxia Rating Scale (mFARS), the Scale for the Assessment and Rating of Ataxia (SARA), and the International Cooperative Ataxia Rating Scale (ICARS) to a large cohort of people with Friedreich's ataxia. We provide regression coefficients for scale interconversion and discuss the reliability of this approach, together with insights into the differential sensitivities of mFARS and SARA to disease progression.
Introduction
Friedreich's ataxia (FRDA) is a progressive neurological disease characterized by gait and limb ataxia, dysarthria, loss of reflexes, proprioceptive dysfunction, and muscle weakness, as well as non‐neurological features including cardiomyopathy, diabetes, and scoliosis. 1 Quantifying severity and tracking changes in the clinical symptom profile is challenging, and usually focuses on the predominant movement features of FRDA, which largely reflect underlying cerebellar pathology.
Clinical rating scales have been developed to quantify disease severity based on a codified neurological exam. Two such scales have evolved as the cornerstones for assessing disease progression in FRDA: the modified Friedreich Ataxia Rating Scale (mFARS) 2 and the Scale for the Assessment and Rating of Ataxia (SARA). 3 Besides common and unavoidable issues of such instruments (e.g., ceiling effects at longer disease duration), the earlier developed ICARS score 4 has shown additional problems (e.g., item redundancies and a questionable subscale grouping) 5 , 6 , 7 and is not used anymore in large studies. While SARA (8 items and 4 bilateral) emphasizes fast assessment, mFARS is more granular in scale with 18 items (7 bilateral) grouped into 4 subcomponents. Regardless, SARA and mFARS have shown similar psychometric properties. 6 , 8 , 9 , 10 , 11
A growing amount of data is available from research studies in FRDA and other ataxias that utilize these scales (e.g., spinocerebellar ataxias, SCAs). This has seeded the establishment of worldwide consortia that retrospectively combine datasets to allow for greater statistical sensitivity, reliability, and generalizability of outcomes (e.g., the ENIGMA‐Ataxia consortium for neuroimaging). 12 However, a major barrier to quantitatively compare existing studies in meta‐analyses and systematic reviews is the use of different clinical rating scales.
While the overall approaches to assess clinical features inherent to cerebellar ataxia are similar between the scales, the relative weights for axial (balance, gait), appendicular (upper and lower limb function) and speech differ. Specifically, these components comprise 39%/56%/5% of the mFARS, 45%/40%/15% of the SARA, and 34%/52%/8% of the ICARS, respectively, and only ICARS includes oculomotor disorders (6%; see Table S1).
This has implications for the comparability of the results and for the sensitivity to symptom progression at different disease stages. For instance, it has been shown in a large natural history study that ambulant individuals progress mostly in axial items, 11 whereas appendicular function declines largely after people transition into a wheelchair. Bulbar and speech as measured by these clinical scales, play a minor role, and progress largely independent of the disease phase. Scale behavior and comparability may therefore be dependent on the disease stage.
Here, we examine the interchangeability of these scales, and provide empirically driven guidance regarding the homogenization and conversion of scores for use in retrospective and meta‐analytic research, building on previous correlation studies between the FARS, SARA, and ICARS. 13
Material and Methods
Data collection
The dataset was collected at a single center (Murdoch Children's Research Institute, Melbourne) during yearly study visits of the Friedreich Ataxia Clinical Outcome Measures study (FACOMS, NCT03090789) between January 2011 and May 2021. The subset included here encompasses all individuals participating at this center with available scores on all three scales. This study had approval from the Monash Health Human Research Ethics Committee (Project Number 02114A). All participants gave their informed, written consent in accordance with the 1964 Declaration of Helsinki.
mFARS scores were collected according to the FACOMS case report form 14 ; afterward common items in the SARA/ICARS were rescored, followed by administering outstanding items from SARA and ICARS with the goal to minimize assessment burden and to ensure all items are assessed at approximately the same time of day. On average administering, all scales concurrently increased the overall assessment time by ~10 min. In addition, Functional Disease Staging (FDS) 15 was recorded. Ratings correspond to no (1), minimal (2, symptoms present), mild (3, symptoms overt and significant), and moderate (4, requires a walker or other aids) disability. Reaching FDS 5 defines loss of ambulation (LoA). 16
Statistical analysis
All results were divided by their maximum possible score and multiplied by 100, that is, the resulting %‐scales range from 0 (no disability) to 100 (maximum disability). Percentiles were chosen over other normalization metrics (such as z‐scores) due to better external comparability and descriptiveness. The %‐scores were then compared at each FDS stage using boxplots, followed by correlation analyses using linear regression functions and analyzed by Pearson's R 2 statistics. Data from all available visits were used; regression coefficients derived from cross‐sectional data (first visit only, last visit only) were only minimally different (generally <1%, data not shown). Distributions were compared using density plots. 17 Such plots are not affected by the number of bins used in histograms, facilitating the comparison of distribution shapes. 17
Results
Data comprised 605 visits of 166 individuals, whose demographics are representative of the complete FACOMS cohort 11 (Table S2); importantly, nearly the full range of clinical and genetic severity is represented in our sample.
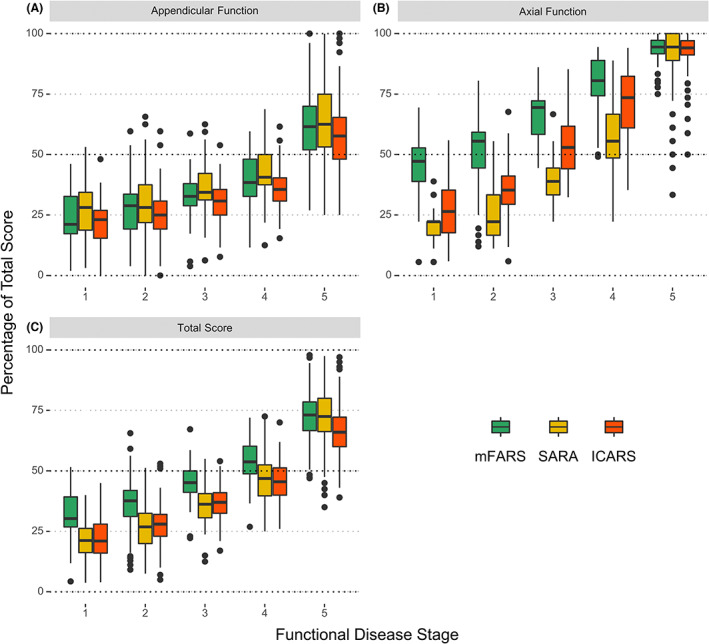
All scales and components showed significant overlap across FDS stages, with appendicular function progressing most similarly between all scales (Fig. 1A). Conversely, axial %‐scores differed between mFARS and SARA/ICARS: At FDS 1 (least severe), median mFARS‐AX was almost 50%, but median SARA‐AX was below 25%, with similar results through to FDS 4 (Fig. 1B). Total score results matched the axial pattern across FDS 1 to 4, with mFARS scores roughly similar to SARA and ICARS at one later (more severe) disease stage (Fig. 1C). ICARS total scores were close to SARA results.
Figure 1.

Appendicular (A), axial (B), and total scores (C), percentage of total scores by functional disease stage.
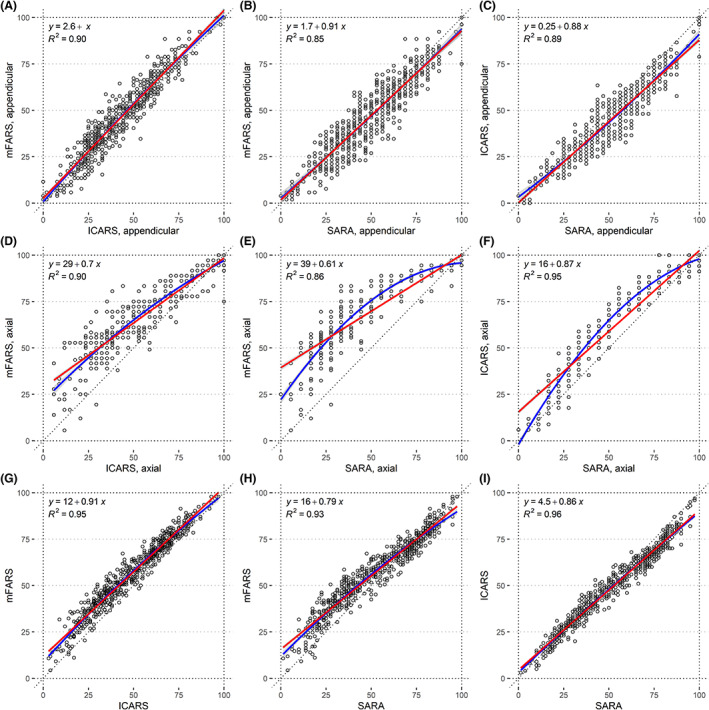
Correlation analyses (Fig. 2) showed high Pearson's R 2 values: >0.93 for total scores, >0.86 for axial scores, and >0.85 for the appendicular components. Appendicular functions were highly similar across scales (Fig. 2A–C). For axial components, linear correlation coefficients showed large intercepts vs. FARS‐AX (39% and 29% from SARA‐AX and ICARS‐AX, respectively, translating to 14 and 10 absolute points) and low slopes (0.61 and 0.70, respectively). Second‐order polynomials provided improved r2 values and model fits (Fig. 2D–F; Table S3 for model statistics). Again, total scores followed the axial component pattern, with smaller distinctions between the linear and polynomial models (Fig. 2G–I. For a full list of coefficients, see Table 1).
Figure 2.

Correlation plots of percentages of maximum score for the appendicular components of mFARS, SARA, and ICARS (A–C), their axial components (D–F), and the full scores (G–I). Linear correlation is depicted in red, and second‐order polynomial regression is in blue.
Table 1.
Conversion coefficients for total scores and axial components (the use of second‐order polynomial equations is only recommended for ambulatory populations). For example, mFARS = 14.59 + (SARA × 1.84), or mFARS(axial) = 22.20 + (SARA × 1.40) + (SARA2 × −0.0066). The association between mFARS and FARSn is included for legacy comparison (see “Discussion” section).
| Score | Model | Linear model | Second‐order polynomial model | ||||||
|---|---|---|---|---|---|---|---|---|---|
| Units | Points | Percentages | Percentages | ||||||
| Predicted from | Inter. | Slope | Int. | Slope | Inter. | x | x 2 | ||
| Total scores | mFARS | FARSn | −0.10 | 0.80 | −0.10 | 1.07 | |||
| mFARS | SARA | 14.57 | 1.84 | 15.67 | 0.79 | ||||
| mFARS | ICARS | 11.06 | 0.85 | 11.89 | 0.91 | ||||
| SARA | mFARS | −5.84 | 0.51 | −14.61 | 1.17 | ||||
| SARA | ICARS | −1.27 | 0.45 | −3.18 | 1.12 | ||||
| ICARS | mFARS | −9.67 | 1.12 | −9.67 | 1.04 | ||||
| ICARS | SARA | 4.51 | 2.15 | 4.51 | 0.86 | ||||
| Axial component | mFARS | SARA | 14.19 | 1.22 | 39.41 | 0.61 | 22.20 | 1.40 | −0.0066 |
| mFARS | ICARS | 10.27 | 0.74 | 28.53 | 0.70 | 21.39 | 0.99 | −0.0023 | |
| SARA | mFARS | −8.49 | 0.71 | −47.15 | 1.42 | 34.93 | −1.28 | 0.0197 | |
| SARA | ICARS | −2.48 | 0.58 | −13.79 | 1.09 | 12.87 | 0.00 | 0.0087 | |
| ICARS | mFARS | −10.27 | 1.22 | −30.19 | 1.29 | 11.07 | −0.06 | 0.0099 | |
| ICARS | SARA | 5.29 | 1.64 | 15.56 | 0.87 | −1.97 | 1.68 | −0.0068 | |
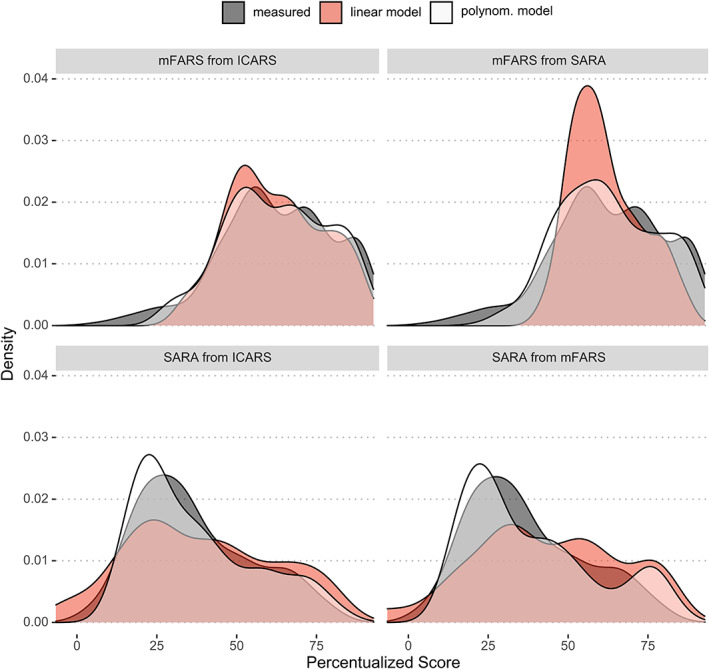
To evaluate the extent of information retained during conversion with different polynomial functions, density plots of axial components of mFARS‐AX and SARA‐AX were created (Fig. 3). The use of second‐order polynomial models lead to an improved replication of the measured results.
Figure 3.

Density plots of axial component scores. Measured results (dark gray), compared to predictions derived from second‐order polynomial conversion (white) versus from simpler linear regression models (red).
Discussion
In an attempt to harmonize ataxia rating scales, we provide inter‐conversion procedures between the mFARS, SARA, and ICARS. This facilitates the comparison of scores at different disease stages in FRDA cohorts scored with differential rating scales. We show that linear conversion functions are mostly sufficient, although in ambulatory cohorts, the use of second‐order polynomials and/or focusing on axial function alone might offer advantages (if sub‐scores are available). Appendicular functions do not require conversion factors.
A comparison of results by FDS revealed that a percentage‐scale is insufficient for harmonization, due to differential progression characteristics of each scale. Scale scores also provide a poor proxy for identifying specific disease milestones that are captured more directly and with greater face validity by the FDS itself.
Interestingly, the systematic offsets we observed between SARA/ICARS and mFARS scores were not detected in earlier analyses 13 which used the full FARS‐neuro score (FARSn, maximum of 125 points). However, the FARSn behaved very similar to the mFARS in our results (Table 1), and the reason for the difference may be due to the larger sample and the broader scale coverage in our study.
Of particular relevance are differences in stance function testing. The mFARS assesses stance using 1 min test (in triplicate, if necessary) and the relative absence of intermittent scores in these items 16 indicates that once a stance trial is missed, the incentive and motivation to retry might be low. Also, as shown previously, 16 in most patients three out of six stance functions in the mFARS are already lost at the time of FRDA diagnosis. This early loss is in part responsible for the large intercepts when converting between the SARA/ICARS and the mFARS. More importantly, however, these items should offer high sensitivity in early or prodromal stages of the disease, making the instrument a promising candidate for other, more slowly progressive ataxias where axial function loss is potentially less aggressive and diagnosis occurs at lower disability or before onset. 18 SARA and ICARS on the other hand use shorter stance test intervals (10 sec) and show a later ceiling. SARA and ICARS may therefore better distinguish disease burden in patients who are approaching loss of ambulation. Of note, it remains unclear if this difference translates into meaningful improvements in the measures, that is, a better signal/noise ratio.
Taken together, there are differences in the capacity of mFARS, ICARS, and SARA to capture cerebellar impairment at different disease stages. Since both have comparable psychometric quality, the choice between the two should depend on the population studied, rather than the region and history of the center.
In conclusion, we provide conversion coefficients for mFARS, SARA, and ICARS, as well as their axial and appendicular components, useful for the harmonization and comparison of disease stages within cohorts from diverse origins. Comparing results using percentages is not recommended. Caution is advised when generalizing to other diseases (e.g., SCAs), where progression profiles between, for example, axial and appendicular function might differ from FRDA.
Conflict of Interest
The authors report no relevant disclosures.
Author Contributions
Christian Rummey: Conception or design of the work. Data analysis and interpretation. Drafting the article. Ian H. Harding: Conception or design of the work. Critical revision of the article. Martin B. Delatycki: Critical revision of the article. Data Collection. Geneieve Tai: Critical revision of the article. Data Collection. Thiago Rezende: Critical revision of the article. Louise A. Corben: Conception or design of the work. Critical revision of the article. Data Collection.
Supporting information
Table S1. Items and functionality (abbreviated) across mFARS, SARA, and ICARS, including the sequence of administration. Numbers in brackets show the maximum possible scores (highest disability). For full details, please refer to the primary references.
Table S2. Demographic characteristics and amount of follow‐up, grouped by age of onset*. Data are percentage or median [IQR].
Table S3. Summary statistics for simple linear and polynomial models.
Funding InformationThis work was funded by Friedreich's Ataxia Research Alliance (www.curefa.org).
Funding Statement
This work was funded by Friedreich's Ataxia Research Alliance .
References
- 1. Dürr A, Cossee M, Agid Y, et al. Clinical and genetic abnormalities in patients with Friedreich's ataxia. N Engl J Med. 1996;335(16):1169‐1175. [DOI] [PubMed] [Google Scholar]
- 2. Rummey C, Corben LA, Delatycki MB, et al. Psychometric properties of the Friedreich ataxia rating scale. Neurol Genet. 2019;5(6):371. [DOI] [PMC free article] [PubMed] [Google Scholar]
- 3. Schmitz‐Hübsch T, du Montcel ST, Baliko L, et al. Scale for the assessment and rating of ataxia: development of a new clinical scale. Neurology. 2006;66(11):1717‐1720. [DOI] [PubMed] [Google Scholar]
- 4. Trouillas P, Takayanagi T, Hallett M, et al. International cooperative ataxia rating scale for pharmacological assessment of the cerebellar syndrome. the ataxia neuropharmacology Committee of the World Federation of neurology. J Neurol Sci. 1997;145(2):205‐211. [DOI] [PubMed] [Google Scholar]
- 5. Cano SJ, Hobart JC, Hart PE, Korlipara LVP, Schapira AHV, Cooper JM. International cooperative ataxia rating scale (ICARS): appropriate for studies of Friedreich's ataxia? Mov Disord. 2005;20(12):1585‐1591. [DOI] [PubMed] [Google Scholar]
- 6. Perez‐Lloret S, van de Warrenburg B, Rossi M, et al. Assessment of ataxia rating scales and cerebellar functional tests: critique and recommendations. Mov Disord. 2020;36:283‐297. [DOI] [PubMed] [Google Scholar]
- 7. Tai G, Corben LA, Gurrin L, et al. A study of up to 12 years of follow‐up of Friedreich ataxia utilising four measurement tools. J Neurol Neurosurg Psychiatry. 2015;86(6):660‐666. [DOI] [PubMed] [Google Scholar]
- 8. Schmitz‐Hübsch T, Fimmers R, Rakowicz M, et al. Responsiveness of different rating instruments in spinocerebellar ataxia patients. Neurology. 2010;74(8):678‐684. [DOI] [PubMed] [Google Scholar]
- 9. Rummey C, Zesiewicz TA, Perez‐Lloret S, Farmer JM, Pandolfo M, Lynch DR. Test–retest reliability of the Friedreich's ataxia rating scale. Ann Clin Transl Neurol. 2020;7:1708‐1712. [DOI] [PMC free article] [PubMed] [Google Scholar]
- 10. Lynch DR, Chin MP, Delatycki MB, et al. Safety and efficacy of Omaveloxolone in Friedreich ataxia (MOXIe study). Ann Neurol. 2021;89(2):212‐225. [DOI] [PMC free article] [PubMed] [Google Scholar]
- 11. Rummey C, Corben LA, Delatycki M, et al. Natural history of Friedreich's ataxia: heterogeneity of neurological progression and consequences for clinical trial design. Neurology. 2022;99:e1499‐e1510. doi: 10.1212/WNL.0000000000200913 [DOI] [PMC free article] [PubMed] [Google Scholar]
- 12. Harding IH, Chopra S, Arrigoni F, et al. Brain structure and degeneration staging in Friedreich ataxia: mri Volumetrics from the enigma‐ataxia working group. Ann Neurol. 2021;90:570‐583. [DOI] [PMC free article] [PubMed] [Google Scholar]
- 13. Bürk K, Mälzig U, Wolf S, et al. Comparison of three clinical rating scales in Friedreich ataxia (FRDA). Mov Disord. 2009;24(12):1779‐1784. [DOI] [PubMed] [Google Scholar]
- 14. Case Report Form from the FA‐COMS study, Neurological Exam (mFARS) [Internet]. 2005. [cited 2022 May 19]. Available from: https://curefa.org/pdf/NeuroExam.pdf
- 15. Case Report Form from the FA‐COMS study, Functional Staging [Internet]. 2005. [cited 2022 May 6]. Available from: https://curefa.org/pdf/FunctionalStaging.pdf
- 16. Rummey C, Farmer JM, Lynch DR. Predictors of loss of ambulation in Friedreich's ataxia. EClinicalMedicine. 2020;18:100213. [DOI] [PMC free article] [PubMed] [Google Scholar]
- 17. Kassambara A. GGPlot2 essentials: great data visualization in R. 2019.
- 18. Tezenas du Montcel S, Durr A, Rakowicz M, et al. Prediction of the age at onset in spinocerebellar ataxia type 1, 2, 3 and 6. J Med Genet. 2014;51(7):479‐486. [DOI] [PMC free article] [PubMed] [Google Scholar]
Associated Data
This section collects any data citations, data availability statements, or supplementary materials included in this article.
Supplementary Materials
Table S1. Items and functionality (abbreviated) across mFARS, SARA, and ICARS, including the sequence of administration. Numbers in brackets show the maximum possible scores (highest disability). For full details, please refer to the primary references.
Table S2. Demographic characteristics and amount of follow‐up, grouped by age of onset*. Data are percentage or median [IQR].
Table S3. Summary statistics for simple linear and polynomial models.


