Abstract
Objective
Multiple sclerosis (MS) is a multifactorial disease with increasingly complicated management. Our objective is to use on‐demand computational power to address the challenges of dynamically managing MS.
Methods
A phase 3 clinical trial data (NCT00906399) were used to contextualize the medication efficacy of peg‐interferon beta‐1a vs placebo on patients with relapsing–remitting MS (RRMS). Using a set of reference patients (PORs), selected based on adequate features similar to those of an individual patient, we visualize disease activity by measuring the percentage of relapses, accumulation of new T2 lesions on MRI, and worsening EDSS during the clinical trial.
Results
We developed MS Vista, a functional prototype of clinical decision support system (CDSS), with a user‐centered design and distributed infrastructure. MS Vista shows the medication efficacy of peginterferon beta‐1a versus placebo for each individual patient with RRMS. In addition, MS Vista initiated the integration of a longitudinal magnetic resonance imaging (MRI) viewer and interactive dual physician‐patient data display to facilitate communication.
Interpretation
The pioneer use of PORs for each individual patient enables personalized analytics sustaining the dialog between neurologists, patients and caregivers with quantified evidence.
Introduction
Multiple sclerosis (MS) 1 management is becoming increasingly complex, 2 and more than 2.8 million people are affected worldwide. 3 Its pathophysiology is multifactorial, and its natural history is heterogeneous. 4 , 5 For physicians, harnessing the richness and complexity of the information produced by multicentric registries and randomized control trials (RCTs) in daily practice is increasingly challenging as important volumes of biomedical data are available, including clinical evaluations, magnetic resonance imaging (MRI), biological measures and numerous therapeutic options. 6 , 7
Precision medicine (PM) 8 is a data‐driven approach that aims to individualize medical decisions through specific measures tailored to individual patient factors. Given the complexity of MS, its management can greatly benefit from PM solutions. However, the multiplicity of data and factors may complicate the understanding of PM solutions. Computational tools are needed to help physicians navigate this complex knowledge.
In 2014, Gourraud et al. 9 developed MS Bioscreen, an iPad‐based application for physicians that gathers MS cohort data and enables visualizing the disease course of MS patients in the context of reference patients. To extend the reach of MS Bioscreen, Schleimer et al. 10 developed the open MS Bioscreen. Open MS Bioscreen provides patients with information and tools to make decisions about their MS care. To improve management of MS patients, other MS eHealth solutions, such as the MSdialog, 11 MSDS3D, 12 , 13 and MSSR, 14 as well as other digital facilitation tools for MS, have been developed. 15 , 16 Many of the existing clinical decision support systems (CDSSs) 17 for MS combine real‐time access to data and on‐demand computation. To individualize clinical decision making, PM also requires considering individual patient's contextual factors, i.e., individual features relevant to his or her care.
Here, we propose the CDSS, MS Vista, a functional prototype designed to assist physicians and patients during clinical follow‐up visits for MS. MS Vista uses new contextualization and data projection concepts that enrich patients' data displays and assist in shared clinical decision making. We illustrate the usefulness of this prototype through the visualization of the medication efficacy of peginterferon beta‐1a versus placebo for each individual patient with relapsing–remitting MS (RRMS), based on the projection of key features of disease activity from a phase 3 RCT data.
Materials and Methods
The SQUIRE reporting guidelines 18 were used to guide the reporting of this work.
Standard protocol approvals, registrations, and patient consents
The current research does not include any human experimentation. The physicians with whom we collaborated are members of the project. The study was approved by the non‐interventional research ethics committee of Nantes University (IRB n°: IORG0011023), with the reference number n°09122021.
The data used in this study are extracted from a previous trial registered with ClinicalTrials.gov, number NCT00906399, and approved for research use in the original trial patients' consent forms. The trial study was done according to the International Conference on Harmonization Guidelines for Good Clinical Practice and the Declaration of Helsinki. All information regarding the standard protocol approvals, registrations, and patient consents of this trial are described by Calabresi et al. 19
Data source: RCT
We used pseudonymized RCT data (NCT00906399) from a global multicenter, randomized, double‐blind, parallel‐group, placebo‐controlled study of the efficacy of peginterferon beta‐1a in reducing relapse rates in patients with RRMS. 19 In 26 countries, 1512 patients between the ages of 18 and 65, with EDSS scores of 0 to 5 and at least two clinically documented relapses in the three years prior to the trial, have been randomized to placebo (500 patients) or peginterferon beta‐1a (500 patients with 125 mcg every 4 weeks and 512 with 125 mcg every 2 weeks) during the first year of the trial. In the present study, we use exclusively data from patients on placebo and peginterferon beta‐1a 125 mcg every 2 weeks, as approved by the FDA (Food and Drug Administration).
Contextualization
Contextualization 20 introduces external quantified evidence to better assess the uniqueness of each clinical situation. Contextualization has been further developed using the concepts of “patient of interest” (POI) and “patients of reference” (PORs). POI data refer to data from individual patients: the subjects of the clinical decision. PORs represent data from a subgroup of relevant patients who share similar disease characteristics with the POI: the subject of statistical modeling. This distinction reflects different data processing methods related to clinical decision making for POIs or mathematical modeling for PORs and shapes the data architecture of computational medical applications. We used the following demographic, clinical, and MRI criteria for PORs data selection:
-
‐
current age,
-
‐
sex,
-
‐
age at MS onset,
-
‐
disease duration,
-
‐
MS type,
-
‐
expanded disability status scale (EDSS) at the last visit,
-
‐
number of relapses within the last 12 months,
-
‐
number of T2 lesions on baseline MRI,
-
‐
gadolinium‐enhanced lesions on baseline MRI,
-
‐
number of new T2 lesions within the last 12 months.
All these criteria have been validated by expert neurologists and documented in previous epidemiological studies 21 , 22 , 23 as being predictive markers. Furthermore, we categorized some of these criteria as they have been calibrated in previous studies to demonstrate their predictive value. 24 , 25
The selection of PORs data relies on a screening of the entire dataset to retain only data from patients with similar disease characteristics (criteria mentioned above) to the POI.
MRI visualization
The increased availability of MRI and its sensitivity in detecting MS lesions 26 make it central to modern decision making in the management of MS patients. In clinical practice, interpreting and comparing brain MRI scans can vary greatly in terms of quality, especially in radiology centers that do not specialize in MS. CADIMS software was developed to facilitate MRI viewers' integration in a global architecture. It was designed to provide quick and intuitive access to preprocessed volumes and new lesions segmentation masks. It consists of an MRI viewer usable from a standard web browser and was developed using the AMI framework 27 for visualizing medical images. CADIMS is part of a workflow for computer‐aided assessment of brain disease activity in multiple sclerosis patients described and evaluated in detail by B. Combes et al. 28
Application development
MS Vista was developed based on an adaptation of the user‐centered design of clinical information systems presented by Kushniruk 29 (Fig. S1). To provide insight into the process of clinical decision making, we started with an activity analysis through a literature search and direct observation. We attended MS patient consultations and interviewed five neurologists at four meetings. Second, we designed models that reflected the determined structure as the seed of a first prototype. Next, we assessed the prototype with MS physicians to determine whether it met their expectations. An evaluation of the prototype was performed among four MS specialists from two university hospitals in France. We invited participants to perform exercises on the application then complete a survey to evaluate both user satisfaction and the usefulness of the proposed prototype in clinical decision‐making. Participants primarily expressed satisfaction that MS Vista offered the ability to contextualize the patient to illustrate the reasonable probability of remaining in a given condition under different therapeutic scenarios. They also declared that MS Vista can assist in clinical decision‐making and prognosis. Some suggestions for changes in the application were made, such as age at onset and disease duration instead of patient's date of birth and onset date, measure of EDSS worsening, etc. The possibility of including other factors and other types of treatment was discussed. Thus, we made another iteration of this prototype to implement the participants' suggestions. For the inclusion of other factors and treatment types, we remain limited to the data we currently possess.
Application infrastructure
MS Vista is a web application developed with the programming languages Python/R and PostgreSQL to manage databases. To ensure data privacy and confidentiality, the distributed application structure “client–server model” was used and tested using RCTs data. Each database was stored on a different server; the workloads were partitioned between the front‐end (client side, e.g., the physician's computer) and the back‐end (server on which the application is deployed) (Fig. 1). This structure prevents users from directly accessing raw data. Consequently, when physicians use the application, it sends a request to the remote server, which checks whether the client has the right to access the service. If so, the server communicates with the database required for computations and sends the result back to the physician. As a web application, MS Vista also enables the integration of MRI visualization tools such as CADIMS.
Figure 1.
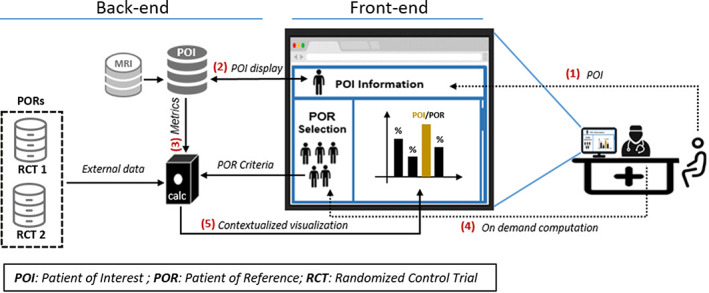
IT infrastructure supporting the MS Vista application. Adopting a user‐centric point of view: (1) Use of MS Vista starts with the POI ID. (2) If the POI ID exists in the POI's database, the data will be automatically displayed. Otherwise, the physician must select the POI's features. If the MRI images of the POI are available, the user can access them. (3) Depending on the POI's features, a first suggestion of the PORs criteria will be automatically defined, then the PORs data will be selected. (4) The physician can modify the PORs selection criteria. Once the PORs are selected, computations will be performed, (5) then the graphs of the obtained results will be displayed.
Results
A 360‐degree view of patient's data over time including MRI
The POI is the starting point for all operations offered by MS Vista (Fig. S2). The MS Vista presents an overview of POIs features already existing in the POI database (Fig. 2A): sex, age, age at MS onset, disease duration, MS type, expanded disability status scale (EDSS) at the last visit, relapse within the last 12 months, number of T2 lesions on brain MRI at baseline, gadolinium‐enhanced lesions, number of new T2 lesions within the last 12 months, type of treatment at the visit, and the treatment start date. Additionally, the saved information for the POI is accessible through the archive. We also initiated the integration of the CADIMS viewer to display MRI images for POIs with available MRI scans (Fig. 2B). The CADIMS viewer is composed of three synchronized views, where two are combined in a third panel (from left to right: initial image, follow‐up image, follow‐up image with new lesions mask).
Figure 2.
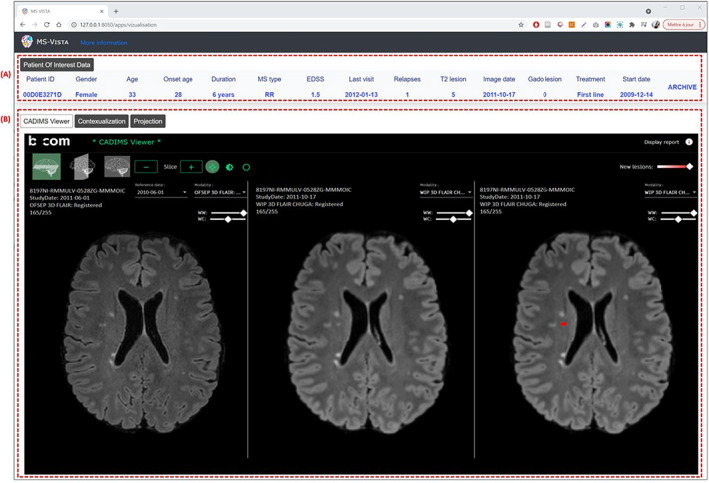
MS Vista presents a 360° view of MS patient data, including MRI. Wireframe of CADIMS integration in MS Vista: (A) POI's data features for clinical description. (B) Longitudinal MRI viewer, CADIMS. The CADIMS MRI viewer consists of three synchronized views displayed from left to right: baseline scan, follow‐up scan and follow‐up scan with segmented new lesions highlighted in red.
Use of on‐demand computation to deliver a normative assessment of patients' trajectories
MS Vista contextualizes the POI using PORs data. It proposes preset filters of PORs selection categories based on a predictive measures of clinical and MRI disease activity according to the expert neurologists and the literature, 23 , 24 , 25 (Fig. S3) or the user's own filters (Fig. S4). Once the PORs are selected, MS Vista shows (see (Fig. 3)) the potential risks of worsening EDSS (progression of 1 point for EDSS between [1–5.5], 0.5 point for EDSS≥6, and 1.5 point for EDSS = 0), new relapses (0, 1, or >1), and new T2 lesions on MRI (0, 1–2, >2) and enables visualizing and comparing the effects of peginterferon‐beta versus placebo through the projection of the RCT data. As shown in (Fig. 4), MS Vista displays descriptive statistics of factors and data used for PORs selection to enable the physician to review the quality of the selected PORs data for each patient. Thus, they can decide whether the PORs data are sufficient and suitable for decision making. To enrich doctor‐patient communication about treatment options, MS Vista displays the evolution of key features of disease activity with each treatment option. (Fig. 5) illustrates the potential benefit of interferon beta after 1 year compared to placebo in the PORs of an individual patient: female, 38 years old, age at MS onset 30 years, MS duration 8 years, EDSS = 2, having 16 focal lesions on brain MRI, and one relapse in the previous 12 months. PORs were selected from the RCT data as follows:
-
‐
Sex: female
-
‐
Age at disease onset: between 20 and 40 years
-
‐
Disease duration: less than 10 years
-
‐
EDSS: between 0 and 2,5
-
‐
Relapse within 12 months: 1
-
‐
Number of cumulative lesions on brain MRI: > 10
Figure 3.
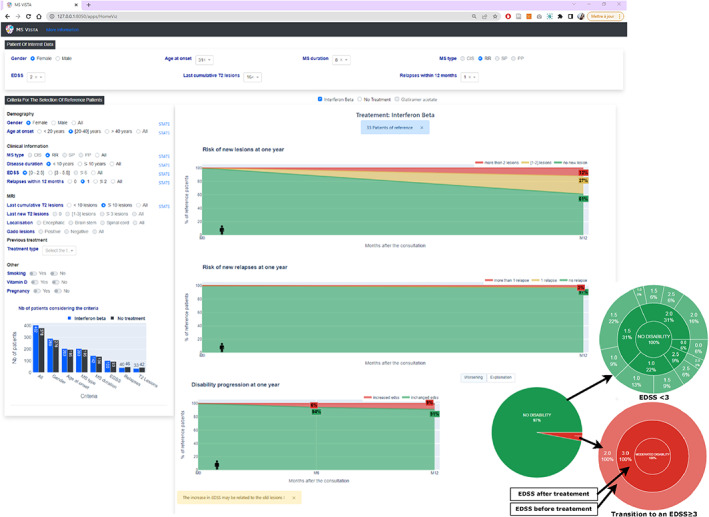
MS Vista provides temporal visualization of PORs data projections. MS Vista displays interactive graphs demonstrating the probability of worsening at 1 year of the gold standard of therapeutic control indicators of MS activity (new relapses, new MRI lesions, and EDSS) based on PORs data projection. The pie chart provides a dual visualization mode of the EDSS worsening to simplify understanding the outcomes and allow the physician to decide whether the information is sufficient to make a decision. The first view level shows the percentage by which the disability will worsen (the transition from EDSS<3 to an EDSS≥3 24 ) in 1 year. The second view level displays the number of patients corresponding to each EDSS, with more details to provide a more precise visualization.
Figure 4.
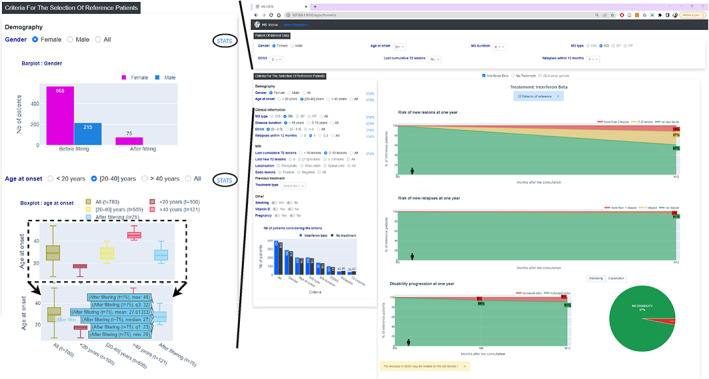
MS Vista displays descriptive statistics for factors used to select PORs. To allow the physician review the quality of the used data to contextualize the POI and decide whether it is conducive for clinical decision making, MS Vista displays descriptive statistics of the factors used to select PORs data, through interactive bar charts and boxplots.
Figure 5.
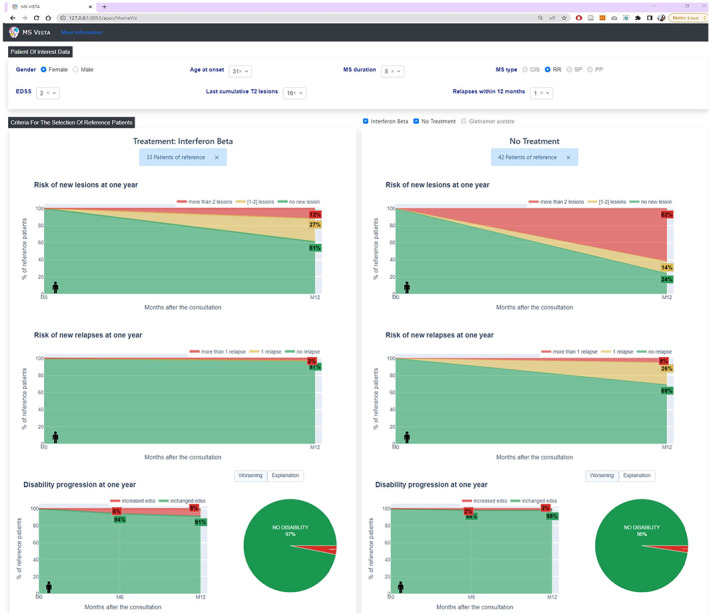
MS Vista enriches physician‐patient communication about treatment options. MS Vista allows visualizing how different factors influence disease progression for each individual patient and contextualizing the medication efficacy of peginterferon beta‐1a versus placebo. Using data from PORs selected based on demographic, clinical, and MRI criteria (left panel of the interface) chosen according to POI data at a time‐point M0 (top panel), MS Vista displays disease activity (middle of the interface) through measurement of percentages of new relapses (0/1/>1), accumulation of new T2 lesions on MRI (0/[1,2]/>2), and worsening of EDSS (worsening / no worsening) over the clinical trial (1 year later ~ M0 + 12 Months).
Results showed that among interferon‐beta‐treated PORs (33 patients) at 1 year, 61% had no accumulation of T2 lesions and 97% had no new relapses. In placebo‐treated PORs (42 patients), 24% had no T2 lesion accumulation and 69% had no new relapses. (Fig. 6) shows how different features may lead to different visualizations of disease activity markers (relapse and accumulation of T2 lesions) and illustrates the potential medication efficacy of interferon beta vs no treatment in different PORs.
-
‐
POR1: female, age at disease onset: [20–40], duration of MS: <10 years, EDSS: [0–2.5], relapses within 12 months: 1, cumulative lesions on brain MRI: ≥10
-
‐
POR2: male, age at disease onset: [20–40], relapses within 12 months: ≥2
-
‐
POR3: male or female, age at disease onset: <20, cumulative lesions on brain MRI: ≥10
Figure 6.
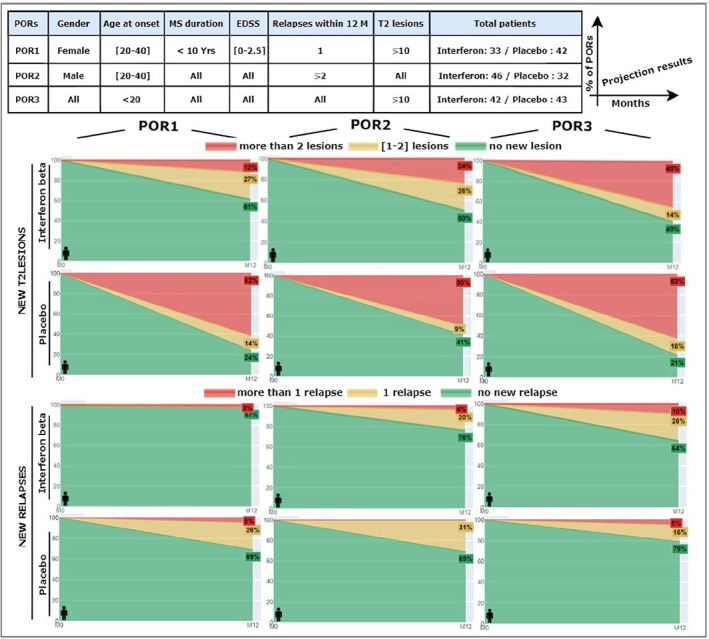
The importance of patient contextualization to illustrate the individual benefits of each treatment option. Three different PORs (table above) were used to illustrate disease activity through percentages of new T2 lesions and new relapses at 1 year of the clinical trial. Differences in the projection results of the three used PORs demonstrate that different factors may contribute to disease progression and also show that the medication efficacy of peginterferon beta‐1a versus placebo may vary depending on patient features.
In POR1, among the 33 patients treated with interferon beta, 61% had no accumulation of T2 lesions and 97% had no relapse. Conversely, among the 42 patients on placebo, 76% had accumulated new lesions and 69% had no relapse. In POR2, 41% of placebo patients and 50% of interferon beta patients did not accumulate new T2 lesions. Thus, the difference between the two groups was small. In both groups, about 70% of patients did not relapse. However, half of the placebo patients versus a quarter of the interferon patients did accumulate more than 2 lesions. In POR3, 40% of the 42 patients on interferon compared to 21% of the 43 patients on placebo did not accumulate new lesions. However, more than 60% of the 43 patients on placebo and 45% of the 42 patients on interferon accumulated more than 2 new lesions.
For POIs whose data exist in the POI database, MS Vista provides also an intuitive visualization of the history of T2 lesion changes and EDSS trajectory of the POI in the context of PORs percentile distributions over time until the last visit (Fig. 7). This normative assessment of the patient's potential trajectories yields a personalized estimate of the control of disease activity.
Figure 7.
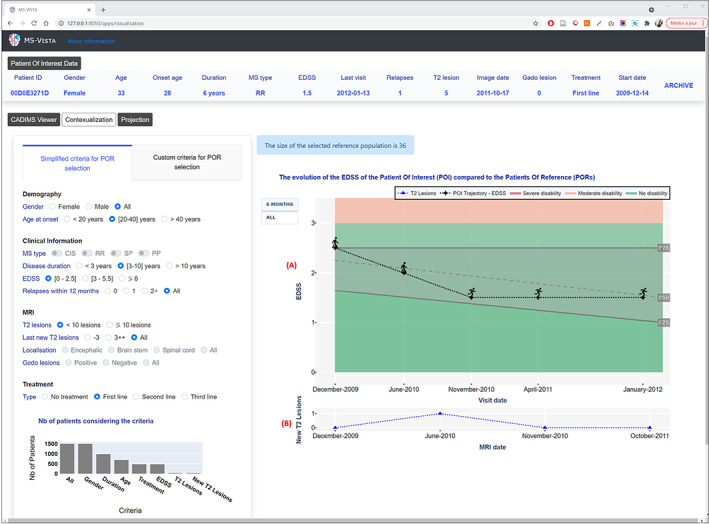
MS Vista presents the evolution of the EDSS of a POI over time. (A) POI's EDSS trajectory in the context of a PORs percentile distribution over MS duration. The POI is presented by a human icon that changes according to the EDSS value to be more illustrative for patients. Two views are available: the EDSS once every 6 months for clarity and all EDSSs saved for the patient for deeper analysis. (B) Curve of the POI's new T2 lesions at each MRI scan to help physicians decide whether the patient is progressing normally.
Discussion
A collaboration between MS physicians, computer scientists and human factors researchers has enabled developing MS Vista, a prototype of web‐based CDSS driven by data from a phase 3 clinical trial. MS Vista relies on distinguishing between POI (the patient of interest) and PORs (patients with adequate features similar to those of the POI) selected according to relevant features validated in the literature 23 , 24 , 25 and commonly used by expert neurologists. Through the projection of PORs data, MS Vista displays potential outcome predictions for the main predictive factors of MS activity (presence of new lesions on MRI, new relapses, EDSS worsening).
While EDSS captures multiple indicators of disability functions, it is thought to be heavily weighted towards ambulation and poorly assesses factors such as cognition, mood, energy and quality of life. If available in the PORs data, those features might be integrated in the CDSS, in addition to MRI and biological predictive markers (Neurofilament light chain, glial fibrillary acidic protein, etc.), computerized speed cognitive test, timed‐25‐foot walk and 9‐hole peg test, etc.
Another obvious limitation of the present CDSS for therapeutic decisions is the lack of consideration of potential long‐term side effects of the therapeutic options. Additionally, the technical usability of the MS Vista interface for different patient groups should be further evaluated, accounting for social determinants of health as well as age, education and, importantly, digital health literacy. This will help assess the degree of “user friendliness” of the interface and possibly enable developing basic and advanced versions adapted to patient segments. Thus, we will measure how MS VISTA optimizes shared decision making between patients and physicians, enhances patients' motivation and adherence, and ultimately leads to improved outcomes. 30
Several CDSSs have been developed for MS. Alshamrani et al. 31 provided a general overview of a decision support system developed to enhance clinical practice in MS. Sarbaz et al. 32 proposed a CDSS to screen healthy people and those who might be affected by MS in the future based on studying balance disorders by extracting postural tremor signals. Hosseini et al. 33 developed a CDSS for MS to help physicians accelerate and enhance the diagnosing of MS with a relapsing–remitting phenotype using a rule‐based method that manages problems with text‐based knowledge. Using long‐term natural history cohorts of patients with MS, Veloso 34 developed a CDSS for predicting long‐term disability and the effect of treatment on individual prognostic estimates based on patient characteristics. Gourraud et al. 9 developed MS BioScreen, a CDSS for contextualizing MS patients and visualizing the disease course using cohort data. Similar applications, such as Open MS BioScreen, have emerged from this idea. 10 Compared to MS BioScreen, Open MS BioScreen is a patient‐facing tool based on a user‐centric design.
For a disease as complex as MS, a CDSS is important to help physicians interact with databases and facilitate physician‐patient communication through visual language. A patient‐facing tool can easily lead to misinterpretation. Physicians must decide whether the results provided by the CDSS are sufficient in making a decision and whether to show them to the patient. The CDSS must also enable clear and transparent outcomes both in terms of data quantity and quality, and decision‐making methods. Thus, we designed MS Vista to support MS patients' clinical visits monitored by the physician. MS Vista offers an ergonomic and interactive visualization interface for patient contextualization and real‐time data projection. It may help enrich physician‐patient communication through interactive displays that show how different factors contribute to disease progression and illustrate the potential benefits of each treatment option to help choose the most appropriate treatment for each patient. It also allows physicians to review the quality of the selected PORs data for each patient to determine whether the data are conducive to clinical decision making.
Digital patient engagement in healthcare has greatly increased in recent years, from clinical trials to point of care. As many trials are now partly virtual, this allows fewer site visits and greater retention, real‐time data collection and patient‐reported outcomes. 35 Further studies should explore in more depth the user impact of the patient interface from two standpoints: actual reflection of the patient experience and technical usability.
The proposed CDSS presents for the first time the projection of an individual MS patient from relevant phase 3 RCT data, a step forward in precision medicine.
Conflict of Interest
Pierre‐Antoine Gourraud is the founder of MethodOmics (2008) (www.methodomics.com) and the co‐founder of Wedata (2018) (www.wedata.science). He consults for major pharmaceutical companies, all dealt with through academic pipelines (AstraZeneca, Biogen, Boston Scientific, Cook, Edimark, Ellipses, Elsevier, Methodomics, Merck, Mérieux, Sanofi‐Genzyme, WeData). PA Gourraud is board member at AXA mutual insurance company (2021). He has no prescription activity, drugs or devices;
David‐Axel Laplaud receives consulting fees from Alexion, Biogen, BMS, Merck, Novartis, Sanofi and Roche.
Supporting information
Figure S1. Represents the development process of MS Vista.
Figure S2. Shows the MS Vista home screen.
Figure S3. Shows the simplified method for PORs selection.
Figure S4. Shows the custom method for PORs selection.
Acknowledgements
This work has been awarded a government grant managed by the National Research Agency under the program “Investissements d'avenir” with the reference KTD‐Innov [ANR‐17‐RHUS‐0010]. This project has received funding from the European Union's Horizon 2020 Research and Innovation Programme under Grant Agreement No. 754995, and the scholarship “Bourse Région Pays de la Loire” number 2019_11235.
MS Vista is part of the PRIMUS project. This work was supported in part by the French National Research Agency (Agence Nationale de la Recherche, ANR) as its 3rd PIA, integrated to France 2030 plan under reference [ANR‐21‐RHUS‐0014]. PRIMUS project offers the opportunity for a more personalized presentation of the long‐term medication efficacy of approved disease‐modifying drugs documented through access to RCTs data (Phase 3 trials from 2 bio‐pharma companies), and high‐quality exhaustive longitudinal cohorts (OFSEP‐HD cohort) of patients with MS. Also, PRIMUS promotes data‐driven homogenization of shared decision practices with and for patients with MS.
The authors thank Biogen, Merck and the OFSEP (Observatoire Français de la Sclérose en Plaques) for sharing the data.
Funding Information
This project has received funding from the European Union's Horizon 2020 Research and Innovation Programme under Grant Agreement No. 754995, and the scholarship “Bourse Région Pays de la Loire” number 2019_11235. MS Vista is part of the PRIMUS project. This work was supported in part by the French National Research Agency (Agence Nationale de la Recherche, ANR) as its 3rd PIA, integrated to France 2030 plan under reference [ANR‐21‐RHUS‐0014].
Funding Statement
This work was funded by Agence Nationale de la Recherche grants ANR‐17‐RHUS‐0010 and ANR‐21‐RHUS‐0014; Bourse Région Pays de la Loire grant 2019_11235; Research and Innovation Programme grant 754995.
References
- 1. Reich DS, Lucchinetti CF, Calabresi PA. Multiple sclerosis. N Engl J Med. 2018;378(2):169‐180. doi: 10.1056/NEJMra1401483 [DOI] [PMC free article] [PubMed] [Google Scholar]
- 2. Wallin MT, Culpepper WJ, Campbell JD, et al. The prevalence of MS in the United States: a population‐based estimate using health claims data. Neurology. 2019;92(10):e1029‐e1040. doi: 10.1212/WNL.0000000000007035 [DOI] [PMC free article] [PubMed] [Google Scholar]
- 3. Walton C, King R, Rechtman L, et al. Rising prevalence of multiple sclerosis worldwide: insights from the atlas of MS, third edition. Mult Scler Houndmills Basingstoke Engl. 2020;26(14):1816‐1821. doi: 10.1177/1352458520970841 [DOI] [PMC free article] [PubMed] [Google Scholar]
- 4. Kotelnikova E, Kiani NA, Abad E, et al. Dynamics and heterogeneity of brain damage in multiple sclerosis. PLoS Comput Biol. 2017;13(10):e1005757. doi: 10.1371/journal.pcbi.1005757 [DOI] [PMC free article] [PubMed] [Google Scholar]
- 5. Eshaghi A, Young A, Wijertane P, et al. Defining multiple sclerosis subtypes using machine learning. medRxiv. 2020;19011080. doi: 10.1101/19011080 [DOI] [Google Scholar]
- 6. Pulido‐Valdeolivas I, Zubizarreta I, Martinez‐Lapiscina EH, Villoslada P. Precision medicine for multiple sclerosis: an update of the available biomarkers and their use in therapeutic decision making. Expert Rev Precis Med Drug Dev. 2017;2(6):345‐361. doi: 10.1080/23808993.2017.1393315 [DOI] [Google Scholar]
- 7. Curtin F, Hartung HP. Novel therapeutic options for multiple sclerosis. Expert Rev Clin Pharmacol. 2014;7(1):91‐104. doi: 10.1586/17512433.2014.865517 [DOI] [PubMed] [Google Scholar]
- 8. Wang ZG, Zhang L, Zhao WJ. Definition and application of precision medicine. Chin J Traumatol. 2016;19(5):249‐250. doi: 10.1016/j.cjtee.2016.04.005 [DOI] [PMC free article] [PubMed] [Google Scholar]
- 9. Gourraud PA, Henry R, Cree BA, et al. Precision medicine in chronic disease management: the MS BioScreen. Ann Neurol. 2014;76(5):633‐642. doi: 10.1002/ana.24282 [DOI] [PMC free article] [PubMed] [Google Scholar]
- 10. Schleimer E, Pearce J, Barnecut A, et al. A precision medicine tool for patients with multiple sclerosis (the open MS BioScreen): human‐centered design and development. J Med Internet Res. 2020;22(7):e15605. doi: 10.2196/15605 [DOI] [PMC free article] [PubMed] [Google Scholar]
- 11. Greiner P, Sawka A, Imison E. Patient and physician perspectives on MSdialog, an electronic PRO diary in multiple sclerosis. Patient. 2015;8:541‐550. doi: 10.1007/s40271-015-0140-1 [DOI] [PMC free article] [PubMed] [Google Scholar]
- 12. Eisele J, Kern R, Alexander S, Großmann L, Schultheiss T, Ziemssen T. Multiple sclerosis documentation system MSDS3D ‐ innovative Management of Patients with multiple sclerosis (I8‐1.003). Neurology. 2014;82(10 Supplement). Accessed January 6, 2021. https://n.neurology.org/content/82/10_Supplement/I8‐1.003 [Google Scholar]
- 13. Kern R, Haase R, Eisele JC, Thomas K, Ziemssen T. Designing an electronic patient management system for multiple sclerosis: building a next generation multiple sclerosis documentation system. Interact J Med Res. 2016;5(1):e4549. doi: 10.2196/ijmr.4549 [DOI] [PMC free article] [PubMed] [Google Scholar]
- 14. Wallin MT, Whitham R, Maloni H, et al. The multiple sclerosis surveillance registry: a novel interactive database within the veterans health administration. Fed Pract. 2020;37(Suppl 1):S18‐S23. [PMC free article] [PubMed] [Google Scholar]
- 15. Marziniak M, Brichetto G, Feys P, Meyding‐Lamadé U, Vernon K, Meuth SG. The use of digital and remote communication technologies as a tool for multiple sclerosis management: narrative review. JMIR Rehabil Assist Technol. 2018;5(1):e5. doi: 10.2196/rehab.7805 [DOI] [PMC free article] [PubMed] [Google Scholar]
- 16. Peeters LM, van Munster CE, Van Wijmeersch B, et al. Multidisciplinary data infrastructures in multiple sclerosis: why they are needed and can be done! Mult Scler J. 2019;25(4):500‐509. doi: 10.1177/1352458518807076 [DOI] [PubMed] [Google Scholar]
- 17. Eberhardt J, Bilchik A, Stojadinovic A. Clinical decision support systems: potential with pitfalls. J Surg Oncol. 2012;105(5):502‐510. doi: 10.1002/jso.23053 [DOI] [PubMed] [Google Scholar]
- 18. Ogrinc G, Davies L, Goodman D, Batalden P, Davidoff F, Stevens D. SQUIRE 2.0 (standards for QUality improvement reporting excellence): revised publication guidelines from a detailed consensus process. BMJ Qual Saf. 2016;25(12):986‐992. doi: 10.1136/bmjqs-2015-004411 [DOI] [PMC free article] [PubMed] [Google Scholar]
- 19. Calabresi PA, Kieseier BC, Arnold DL, et al. Pegylated interferon β‐1a for relapsing‐remitting multiple sclerosis (ADVANCE): a randomised, phase 3, double‐blind study. Lancet Neurol. 2014;13(7):657‐665. doi: 10.1016/S1474-4422(14)70068-7 [DOI] [PubMed] [Google Scholar]
- 20. Weiner SJ. Contextualizing medical decisions to individualize care. J Gen Intern Med. 2004;19(3):281‐285. doi: 10.1111/j.1525-1497.2004.30261.x [DOI] [PMC free article] [PubMed] [Google Scholar]
- 21. Leray E, Moreau T, Fromont A, Edan G. Epidemiology of multiple sclerosis. Rev Neurol (Paris). 2016;172(1):3‐13. doi: 10.1016/j.neurol.2015.10.006 [DOI] [PubMed] [Google Scholar]
- 22. Kalincik T. Multiple sclerosis relapses: epidemiology, outcomes and management. A systematic review. Neuroepidemiology. 2015;44(4):199‐214. doi: 10.1159/000382130 [DOI] [PubMed] [Google Scholar]
- 23. De Stefano N, Stromillo M, Giorgio A, et al. Long‐term assessment of no evidence of disease activity in relapsing‐remitting MS. Neurology. 2015;85:1722‐1723. doi: 10.1212/WNL.0000000000002105 [DOI] [PubMed] [Google Scholar]
- 24. Leray E, Yaouanq J, Le Page E, et al. Evidence for a two‐stage disability progression in multiple sclerosis. Brain J Neurol. 2010;133(Pt 7):1900‐1913. doi: 10.1093/brain/awq076 [DOI] [PMC free article] [PubMed] [Google Scholar]
- 25. Sormani MP, Gasperini C, Romeo M, et al. Assessing response to interferon‐β in a multicenter dataset of patients with MS. Neurology. 2016;87(2):134‐140. doi: 10.1212/WNL.0000000000002830 [DOI] [PubMed] [Google Scholar]
- 26. Gajofatto A, Calabrese M, Benedetti MD, Monaco S. Clinical, MRI, and CSF markers of disability progression in multiple sclerosis. Dis Markers. 2013;35(6):687‐699. doi: 10.1155/2013/484959 [DOI] [PMC free article] [PubMed] [Google Scholar]
- 27. AMI Medical Imaging (AMI) JS ToolKit . FNNDSC/BCH. 2021. Accessed October 28, 2021. https://github.com/FNNDSC/ami
- 28. Combès B, Kerbrat A, Pasquier G, et al. A clinically‐compatible workflow for computer‐aided assessment of brain disease activity in multiple sclerosis patients. Front Med. 2021;8:1968. doi: 10.3389/fmed.2021.740248 [DOI] [PMC free article] [PubMed] [Google Scholar]
- 29. Kushniruk A, Monkman H, Borycki E, Kannry J. User‐centered design and evaluation of clinical information systems: a usability engineering perspective. In: Patel VL, Kannampallil TG, Kaufman DR, eds. Cognitive Informatics for Biomedicine: Human Computer Interaction in Healthcare. Health Informatics. Springer International Publishing; 2015:141–161. doi: 10.1007/978-3-319-17272-9_7. [DOI] [Google Scholar]
- 30. Riedl D, Schussler G. The influence of doctor‐patient communication on health outcomes: a systematic review. Z Psychosom Med Psychother. 2017;63(2):131‐150. doi: 10.13109/zptm.2017.63.2.131 [DOI] [PubMed] [Google Scholar]
- 31. Alshamrani R, Althbiti A, Alshamrani Y, Alkomah F, Ma X. Model‐driven decision making in multiple sclerosis research: existing works and latest trends. Patterns. 2020;1(8):100121. doi: 10.1016/j.patter.2020.100121 [DOI] [PMC free article] [PubMed] [Google Scholar]
- 32. Sarbaz Y, Pourakbari H, Vojudi MH, Ghanbari A. Introducing a decision support system for multiple sclerosis based on postural tremor: a hope for separation of people who might be affected by multiple sclerosis in the future. Biomed Eng Appl Basis Commun. 2017;29(6):1750046. doi: 10.4015/S1016237217500466 [DOI] [Google Scholar]
- 33. Hosseini A, Asadi F, Arani LA. Development of a knowledge‐based clinical decision support system for multiple sclerosis diagnosis. J Med Life. 2020;13(4):612‐623. doi: 10.25122/jml-2020-0182 [DOI] [PMC free article] [PubMed] [Google Scholar]
- 34. Veloso M. An agent‐based simulation model for informed shared decision making in multiple sclerosis. Mult Scler Relat Disord. 2013;2(4):377‐384. doi: 10.1016/j.msard.2013.04.001 [DOI] [PubMed] [Google Scholar]
- 35. Bakker JP, Goldsack JC, Clarke M, et al. A systematic review of feasibility studies promoting the use of mobile technologies in clinical research. NPJ Digit Med. 2019;2(1):1‐7. doi: 10.1038/s41746-019-0125-x [DOI] [PMC free article] [PubMed] [Google Scholar]
Associated Data
This section collects any data citations, data availability statements, or supplementary materials included in this article.
Supplementary Materials
Figure S1. Represents the development process of MS Vista.
Figure S2. Shows the MS Vista home screen.
Figure S3. Shows the simplified method for PORs selection.
Figure S4. Shows the custom method for PORs selection.


