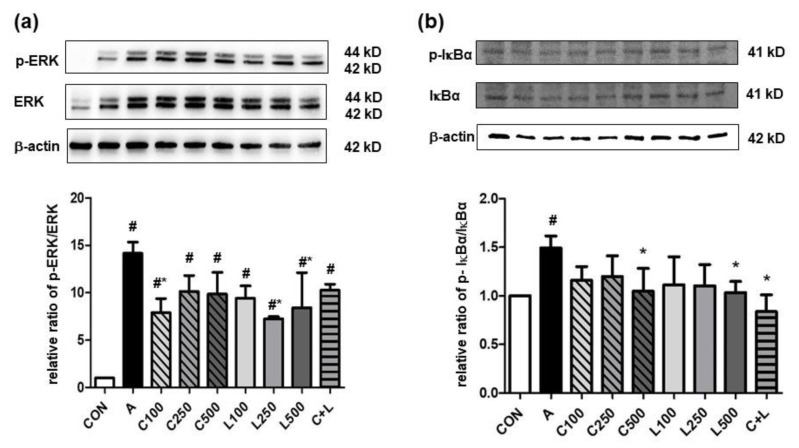
Figure 3.
Effects of aspirin, CPC, and/or LBP on the relative ratio of (a) p-ERK/ERK (n = 3) and (b) p-IκBα/IκBα (n = 4). CON: control group, A: aspirin-induced group, C: CPC treated group, L: LBP treated group. Data are mean ± SD. # p < 0.05 compared with the CON group. * p < 0.05 compared with the A group.

