

Abstract
Introduction
Trastuzumab, as the gold standard for HER2-positive BC treatment, was the first-line HER2 targeted drug. However, some studies reported patients benefited more from lapatinib and lapatinib plus trastuzumab therapy than standard trastuzumab therapy. This study presents an update of a systematic review and meta-analysis involving comparison of lapatinib and lapatinib plus trastuzumab therapy versus trastuzumab therapy.
Aim
We determined whether trastuzumab plus lapatinib or lapatinib therapy is not inferior to trastuzumab therapy in HER2-positive breast cancer patients.
Methods
Relevant trials were searched in CNKI, Wanfang, VIP, Sinomed, PubMed, Embase, and Cochrane CENTRAL databases from inception until October 25, 2021. Primary outcomes were OS, DFS/EFS, and PFS while secondary outcomes were pCR (ypT0/is ypN0), pCR (ypT0/is ypN0/+), ORR, DCR, rate of BCS, RFS, cardiac toxicities, and other toxicities.
Results
Thirteen randomized controlled trials were included in this study. Trastuzumab combined with lapatinib therapy was found to be superior to standard trastuzumab therapy alone with regard to overall survival, disease-free survival/event-free survival, pathologic complete response (ypT0/is ypN0), pathologic complete response (ypT0/is ypN0/+), recurrence-free survival, higher incidences of diarrhea, and rash/skin toxicity. Lapatinib therapy was established to be inferior to trastuzumab therapy in overall survival, progression-free survival, disease-free survival/event-free survival, pathologic complete response (ypT0/is ypN0) and pathologic complete response (ypT0/is ypN0/+), diarrhea, and rash/skin toxicity and had a low incidence of left ventricular ejection fraction decline.
Conclusions
The efficacy of trastuzumab combined with lapatinib therapy is superior to standard trastuzumab therapy alone; however, it has more non-cardiac grade III/IV toxicities. Moreover, the efficacy of lapatinib therapy is inferior to that of standard trastuzumab therapy alone.
Supplementary Information
The online version contains supplementary material available at 10.1186/s13643-022-02134-9.
Keywords: Lapatinib, Trastuzumab, HER2 positive, Breast cancer, Randomized controlled trials, Meta-analysis, Systematic review
Introduction
Globally, breast cancer (BC) is the most common cancer and is the leading cause of tumor-associated mortalities among women. It accounts for about 30% of female cancer incidences and 15% of all cancer deaths [1–3]. Incidence and mortality rates of BC have been consistently increasing, with about 0.5% and 0.7 per 100,000 annual growth, respectively [3, 4]. Moreover, as a heterogeneous disease, BC has four major molecular subtypes divided by gene expressions [5]. Among them, the BC of human epidermal growth factor receptor 2− (HER2−) overexpression occurs in about 20–30% of BC and is associated with poor prognoses [6].
With a length of 185 ku transmembrane glycoprotein with tyrosine kinase activities, HER2 is encoded by proto-oncogenes on chromosome 17q21 and consists of 1255 amino acids [7]. Amplification of the HER2 gene is one of the most important factors affecting breast cancer growth and metastasis. After HER2 gene activation, tumor cells can be stimulated by inhibiting apoptosis, promoting their proliferation, increasing their invasiveness, and promoting angiogenesis as well as lymph angiogenesis [8]. Therefore, HER2 is an independent and powerful prognostic indicator for clinical monitoring of breast cancer therapy and is also an important target for tumor-targeted drug selection. Breast cancer patients with HER2 overexpression are characterized by rapid disease progression, short remission period of chemotherapy, poor effects of endocrine therapy, low disease-free survival (DFS), and overall survival (OS) rates [9]. Therefore, recently, targeted therapy for HER2 has been the focus of targeted therapy for breast cancer [10].
Trastuzumab (T), as the gold standard for HER2-positive BC treatment, was the first-line HER2 targeted drug to be approved by the Food and Drug Administration (FDA) and is also the first humanized monoclonal antibody to be approved for HER2-positive BC [11, 12]. Trastuzumab binds HER2’s perimembrane extracellular subdomain IV and exerts antitumor activities through various mechanisms, including inhibiting signal transduction and regulating antibody-dependent cell-mediated cytotoxicity. Moreover, trastuzumab induces internalization and degradation of the HER2 receptor, attracting cytotoxic immune cells into the tumor microenvironment, inhibiting cell growth and proliferation signaling, and ultimately killing tumor cells [13, 14]. In a phase III HERA clinical trial involving 5102 HER2-positive women with early-stage breast cancer, trastuzumab-treated patients exhibited significantly reduced hazard ratios for disease-free survival events (HR=0.76) [15]. Although trastuzumab has changed the paradigm for HER2-positive breast cancer treatment and significantly improved patients’ prognosis, about 35% of patients have natural resistance, and about 70% of patients who initially respond to trastuzumab treatment progress to metastatic disease and develop resistance within 1 year [12, 16]. Moreover, trastuzumab-associated cardiac toxicity limits its clinical applications. Therefore, additional treatments are needed to provide these patients with further clinical benefits.
Lapatinib (L) is a tyrosine kinase inhibitor (TKI) that exerts its anti-tumor effects by competing with intracellular ATP to block the HER2 signal, thereby blocking phosphorylation and downstream changes in molecular pathways [17]. Because of its different mechanisms of action with monoclonal antibodies, it may have some advantages in overcoming drug resistance [18]. In an Alternative III clinical study, patients treated with lapatinib + trastuzumab + aromatase inhibitors (AIs) exhibited significantly longer median progression-free survival (PFS) outcomes than patients treated with trastuzumab + AI (11 months vs. 5.6 months). Moreover, lapatinib + AI-treated patients exhibited longer median PFS than those treated with trastuzumab + AI (8.3 months vs. 5.6 months) [19]. However, in an ALLTO trial [20], the efficacy of lapatinib was inferior to that of trastuzumab. The combination of trastuzumab with lapatinib therapy has also been reported to be more efficacious, relative to trastuzumab therapy. The CHER-Lob and TRIO-US B07 proved that trastuzumab plus lapatinib treatment has a better pathologic complete response (pCR) outcome [21, 22]. However, ALTTO showed that with regard to disease-free survival (DFS), there were no marked differences among trastuzumab plus lapatinib, trastuzumab, and lapatinib therapy groups, with the combination group exhibiting a higher toxicity [20]. There, it has not been conclusively determined whether efficacies of trastuzumab plus lapatinib or lapatinib therapy are not inferior to trastuzumab therapy.
Therefore, we determined whether trastuzumab plus lapatinib or lapatinib therapy is no-inferiority to trastuzumab therapy in HER-positive breast cancer.
Materials and methods
Study design
This study was performed in accordance with the Preferred Reporting Items for Systematic Reviews and Meta-Analyses guidelines (PRISMA) [23] and registered in PROSPERO (CRD42021285865).
Search strategy
Two researchers (YY and LXM) searched relevant studies from PubMed, Embase, the Cochrane library, CNKI, Wan Fang, and Sinomed databases. The Chinese search terms were “ruxianai,” “ruxianzhongliu,” “ruai,” “lapatini,” and “qutuozhudankang.” The English search terms are shown in Table 1.
Table 1.
PubMed search strategy of lapatinib vs. trastuzumab therapy for HER2-positive breast cancer
| Number | Search terms |
|---|---|
| #1 | “neoplasm”[Title/Abstract] OR “carcinoma”[Title/Abstract] OR “cancer”[Title/Abstract] OR “tumor”[Title/Abstract] |
| #2 | “breast”[Title/Abstract] |
| #3 | “lapatinib”[Title/Abstract] OR “Tykerb”[Title/Abstract] |
| #4 | “trastuzumab”[Title/Abstract] OR “Herceptin”[Title/Abstract] |
| #5 | #1 AND #2 AND #3 AND #4 |
Inclusion criteria
The inclusion criteria in this study were as follows: (i) patients with HER2-positive (3+ staining with immunohistochemistry or/and fluorescent in situ hybridization (FISH) positive) breast cancer based on clinical, histological, or pathological diagnosis; (ii) treatment of T, L, or T + L arms with chemotherapy combined with trastuzumab, lapatinib, or trastuzumab combined with or followed by lapatinib; (iii) primary outcomes were OS, DFS/event-free survival (EFS), and PFS while secondary outcomes were pCR (ypT0/is ypN0), pCR (ypT0/is ypN0/+), overall response rate (ORR), disease control rate (DCR), rate of breast-conserving surgery (BCS), recurrence-free survival (RFS), cardiac toxicities, and other toxicities; and (iv) randomized controlled trials (RCTs).
Exclusion criteria
The exclusion criteria were as follows: (i) studies with different chemotherapies among different arms; (ii) conference abstracts and letters among others; and (iii) studies without available outcomes.
Data extraction and quality assessment
Two researchers extracted the relevant information using a predefined data extraction table, containing literature basic information (trial name, title, author, registration number, publication year), demographic information (number of participants in L + T arm, L arm, and T arm, percentage and number of hormone receptor-positive and hormone receptor-negative participants, tumor stage and diagnosis of patients, inclusion and exclusion criteria), intervention feature information (duration and dose of chemotherapy and anti-HER 2 therapy), and methodological elements (random sequence generation, allocation concealment, blinding of participants and personnel, blinding of outcome assessment, incomplete outcome data, selective reporting, and other bias). The quality of trials was assessed by two researchers using the risk of bias tool of The Cochrane Collaboration [24]. Any disagreements were resolved by discussions with a third researcher.
Statistical analysis and evidence quality assessment
We used RevMan 5.3 and Stata 14 for all data analyses. A meta-analysis was performed according to the anti-HER2 regimen (L + T versus T or L versus T), respectively. Pooled hazard ratios (HRs) were estimated for survival outcomes, including OS, DFS/EFS, RFS, and PFS while risk ratios (RRs) were determined for dichotomous outcomes, including pCR, ORR, rate of BCS, cardiac toxicities, and other toxicities with 95% confidence intervals (CIs) using the inverse variance or Mantel–Haenszel methods [24]. Heterogeneity was assessed by the χ2 test and I2 statistics. A fixed-effects model was used to analyze all effect quantities in this study.
Subgroup analysis was performed using a random-effects model based on the following conditions: tumor stage (I–III or metastatic breast cancer (MBC)), hormone receptor (HR) status, or treatment type (neoadjuvant, adjuvant, or palliative treatment). Sensitivity analysis was performed to identify heterogeneity of main outcomes using the leave-one-out procedure. In addition, a sensitivity analysis was performed to ensure if any of the results were affected by the change of model. After removing obvious heterogeneity studies, a fixed-effects model was used to analyze effect quantities. Publication bias was detected by Egger’s test and considered when p ≤ 0.05 [25]. GRADE profiler 3.6 was used to assess the quality of evidence in accordance with five aspects: risk bias, imprecision, indirectness, publication bias, and inconsistency. Evidence qualities were evaluated as high quality, medium quality, low quality, or very low quality.
Results
Study selection and characteristics
A total of 4093 entries were downloaded from Chinese and English databases. After removing duplicate records and those that were not eligible by reading titles, abstracts, and full-text articles, 21 studies [21–23, 26–43], including 13 RCTs, were identified (Fig. 1).
Fig. 1.

PRISMA diagram of literature searching and screening process
The included studies had been published between 2012 and 2021. Overall, the studies involved 12,024 eligible participants (T+L: 4817, L: 3570, T: 3637) whose median follow-up time varied from 21.5 months to 9 years. Ten RCTs assessed I–III stage breast cancer [21–23, 26–36, 40–43], while 3 RCTs assessed metastatic breast cancer [37–39]. Nine RCTs, including 7 RCTs with dual HER2 blockade [22, 23, 27–34, 40, 42, 43] and 2 RCTs with single HER2 blockade [35, 36, 41] assessed the role of the anti-HER2 therapy in a neoadjuvant setting [22, 23, 27–36, 40–43], 1 RCT assessed the dual HER2 blockade in an adjuvant setting [21, 26], and 3 RCTs assessed the single HER2 blockade in a palliative setting [37–39]. Characteristics of the included studies are shown in Table 2. More details are shown in Additional file 3: Table S1.
Table 2.
Main characteristics of the selected studies
| Trial | Author | MF | Tumor stage | Chemotherapy (wks) | Anti-HER2 therapy | HER2+ patients | HR+/− patients (%) | Outcomes |
|---|---|---|---|---|---|---|---|---|
| ALTTO |
Alvaro Moreno-Aspitia 2021 [20] Martine Piccart-Gebhart 2016 [26] |
6.9 years | I–III |
*D1: chemotherapy×(12–18) *D2: A×(9–12) + Taxane×12 *D2B: (Doc + Carb)×18 |
T+L T→L L T |
2093 2091 2100 2097 |
4805 (57)/3576 (43) | a, c, f, j, k |
| CHER-Lob |
Valentina Guarneri 2021 [21] Valentina Guarneri 2015 [27] Valentina Guarneri 2012 [28] |
9 years | II–IIIA | #wP×12 + FEC×12 |
T+L L T |
46 39 36 |
28 (61)/18 (39) 24 (62)/15 (38) 21 (58)/15 (42) |
a, d, f, i, j, k |
| TRIO-US B07 | Sara A. Hurvitz 2020 [22] | NR | I–III | #Doc×18 + Carb×18 |
T+L L T |
58 36 34 |
34 (59)/24 (41) 18 (50)/18 (50) 20 (59)/14 (41) |
d, j, k |
| CALGB 40601 |
Aranzazu Fernandez-Martinez 2020 [29] Lisa A. Carey 2016 [30] |
83 months | II–III |
#wP×16 *AC×(8-12) |
T+L L T |
118 67 120 |
70 (59)/48 (41) 39 (58)/28 (42) 70 (58)/50 (42) |
a, d, e, f, j, k |
| NeoALTTO |
Jens Huober 2019 [31] Evandro de Azambuja 2014 [32] C. Criscitiello 2013 [33] José Baselga 2012 [34] |
6.7 years | I–III |
#wP×12 *FEC×9 |
T+L L T |
152 154 149 |
77 (51)/75 (49) 80 (52)/74 (48) 75 (50)/74 (50) |
a, c, d, e, g, i, j, k |
| GeparQuinto |
Michael Untch 2018 [35] Michael Untch 2012 [36] |
55 months | I–III | #EC×12 + Doc×12 |
L T |
308 307 |
171 (56)/137 (44) 170 (55)/137 (45) |
a, c, d, e, f, g, h, i, j, k |
| WJOG6110B/ELTOP | Toshimi Takano 2018 [37] | 44.6 months | MBC | C until progression or intolerable toxicity |
L T |
43 43 |
27 (63)/16 (37) 27 (63)/16 (37) |
a, b, g, h, j, k |
| CEREBEL | Xavier Pivot 2015 [38] | NR | MBC | C×NR |
L T |
271 269 |
NR NR |
a, b, g, h, k |
| NCIC CTG MA.31 | Karen A. Gelmon 2015 [39] | 21.5 months | MBC | Taxane×24 |
L T |
270 267 |
NR NR |
a, b, g, h, j, k |
| EORTC 10054 | H. Bonnefoi 2014 [40] | NR | IIA–IIIC | #Doc×9 → FEC×9 |
T+L L T |
52 23 53 |
25 (48)/26 (50) 15 (65)/8 (35) 27 (51)/26 (49) |
d, e, g, h, i, j, k |
| GEICAM/2006-14 | E Alba 2014 [41] | NR | I–III | #EC×12 → Doc×12 |
L T |
51 48 |
NR NR |
d, e, g, i, j, k |
| NSABP B-41 | André Robidoux 2013 [42] | 1.9 years | IIA–IIIA | #AC×12 → Doc×16 |
T+L L T |
174 174 181 |
108 (62)/66 (38) 101 (58)/73 (42) 122 (67)/59 (33) |
d, e, g, i, j, k |
| LPT109096 | Frankie Ann Holmes 2013 [43] | NR | II–III | #FEC×12 + wP×12 |
T+L L T |
33 34 33 |
20 (61)/13 (39) 14 (41)/20 (59) 15 (45)/18 (55) |
d, g, k |
*Adjuvant therapy. #Neoadjuvant therapy. NR Not reported, MBC Metastatic breast cancer, MF Median follow-up, D Design, L Lapatinib, T Trastuzumab, C Capecitabine, A Anthracycline, FEC Fluorouracil + epirubicin + cyclophosphamide, EC Epirubicin + cyclophosphamide, Doc Docetaxel, Carb Carboplatin, Pal Paclitaxel, wP Weekly paclitaxel, AC Doxorubicin + cyclophosphamide, wk Week, HR(+) hormone receptor positive, HR(−) Hormone receptor negative, a Overall survival, b Progression-free survival, c Disease-free survival/event-free survival, d pCR (ypT0/is ypN0), e pCR (ypT0/is ypN0/+), f recurrence-free survival, g overall response rate, h Disease control rate, i rate of breast conserving surgery, j cardiac toxicities, k other toxicities
Quality assessment of the included studies
Two RCTs (CALGB 40601 and WJOG6110B/ELTOP) did not describe random sequence generation, while 7 RCTs (ALTTO, CALGB 40601, LPT109096, NCIC CTG MA.31, TRIO-US B07, WJOG6110B/ELTOP, and CEREBEL) did not make detailed illustrations of allocation concealment. Blinding of participants and personnel was not adopted in any of the RCTs. Two RCTs (NeoALTTO and GeparQuinto) adopted blinding of outcome assessment. One RCT (LPT109096) did not report on complete outcome data, while all RCTs were free from reporting bias and 2 RCTs (ALTTO and CHER-Lob) got unclear risk of bias of other bias. Details of risk of bias are shown in Figs. 2 and 3.
Fig. 2.

Risk of bias graph
Fig. 3.
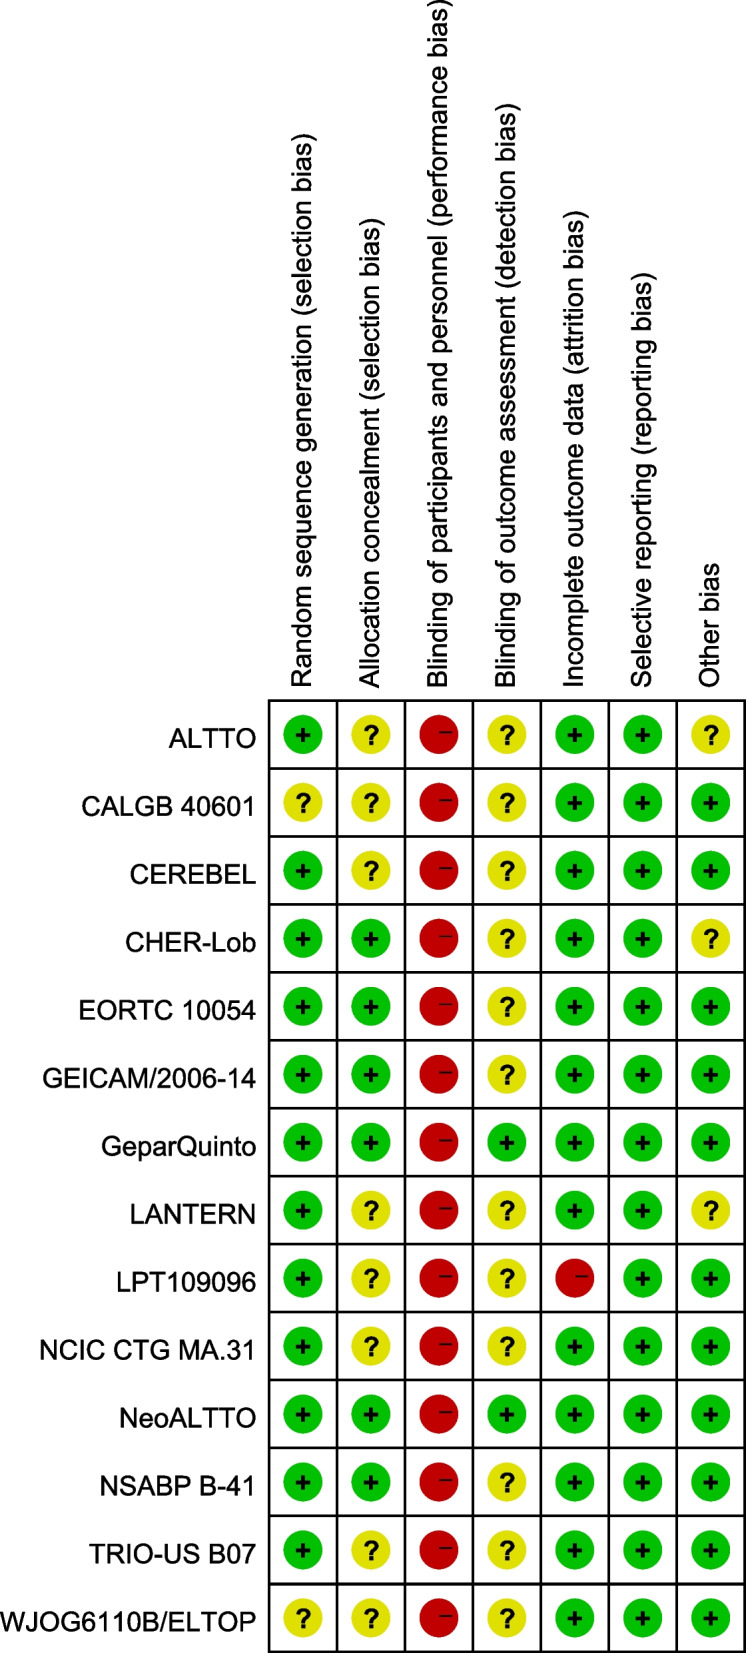
Risk of bias summary
Primary outcomes
Overall survival
Eight trials [21, 22, 26, 29, 31, 35, 38, 39] reported data on OS (calculated from randomization to death from any cause or last follow-up) for pooling in meta-analysis. Data from WJOG6110B/ELTOP [37], in which participants were all previously treated with trastuzumab with progression, were excluded. Heterogeneity tests of p = 0.46, I2=0, and p=0.22, I2=29%, were tested in OS (T+L vs. T) and OS (L vs. T). The T+L arm showed significant improvements in OS, compared to the T arm (HR: 0.84, 95% CI: 0.73–0.97, p=0.02; Fig. 4). The L arm showed a markedly lower efficacy with regard to OS, compared to T arm (HR: 1.26, 95% CI: 1.08–1.46, p =0.003; Fig. 4).
Fig. 4.

Meta-analysis of OS. ALTTOa: trastuzumab followed by lapatinib group
Subgroup analysis
The L arm showed no statistical significance in OS of patients with neoadjuvant therapy, compared to T arm (HR: 0.85, 95% CI: 0.60–1.20, p =0.36; Fig. 5). The L arm shows no statistical significance in OS of patients with palliative therapy, compared to T arm (HR: 1.40, 95% CI: 1.10–1.80, p =0.007; Fig. 5). Subgroup differences were found (interaction test, p = 0.02).
Fig. 5.

Subgroup analysis of OS in accordance with therapy setting (L vs. T)
Progression-free survival
A total of 2 trials [38, 39] provided data on PFS (defined as time from randomization to disease progression) for pooling in the meta-analysis. Data from WJOG6110B/ELTOP [37], in which participants were previously treated with trastuzumab with progression, were excluded. The heterogeneity test of p=0.58, I2=0 in PFS (L vs. T) did not reveal heterogeneity. Compared to the T arm, the L arm showed a lower efficacy with regard to PFS (HR: 1.35, 95% CI: 1.11–1.64, p=0.002; Fig. 6).
Fig. 6.

Meta-analysis of PFS
Disease-free survival/event-free survival
Four trials [21, 26, 31, 35] involving stage I–III patients provided data on DFS/EFS (defined as the time from randomization to recurrence of invasive breast cancer at local, regional, or distant sites; contralateral invasive breast cancer; second non-breast malignancy; or death as a result of any cause, whichever occurred first) for pooling in the meta-analysis. As reported by CHER-Lob [22], RFS was defined as the time from randomization to breast cancer recurrence (loco regional or distant; contralateral BC excluded) or death from any cause, whichever occurred first, which is similar to the definition of DFS/EFS. Therefore, RFS in CHER-Lob [22] was also included for pooling in the meta-analysis. Heterogeneity test of p=0.35, I2=9% in DFS/EFS (T+L vs. T) revealed low heterogeneity. The T+L arm showed significant improvements in DFS/EFS, compared to the T arm (HR: 0.89, 95% CI: 0.80–0.98, p=0.02; Fig. 7). Heterogeneity test of p=0.20, I2=36% in DFS/EFS (L vs. T) showed low heterogeneity. Compared to the T arm, the L arm showed a markedly low efficacy with regard to DFS/EFS (HR: 1.22, 95% CI: 1.05–1.41, p =0.008; Fig. 7).
Fig. 7.

Meta-analysis of DFS/EFS. ALTTOa: trastuzumab followed by lapatinib group
Secondary outcomes
pCR (ypT0/is ypN0)
Nine trials [22, 23, 30, 34, 36, 40–43] with neoadjuvant therapy provided data on pCR (ypT0/is ypN0) (defined as the absence of residual invasive tumor in breast and axillary nodes) for pooling in the meta-analysis. Heterogeneity test of p=0.32, I2=14% in pCR (T+L vs. T, ypT0/is ypN0) revealed a low heterogeneity. The T+L arm showed significant improvements in pCR (ypT0/is ypN0), compared to the T arm (RR: 1.27, 95% CI: 1.13–1.43, p <0.0001; Fig. 8). Heterogeneity test of p=0.24, I2=22% in pCR (L vs. T, ypT0/is ypN0) showed a low heterogeneity. The T arm showed significant improvements in pCR (ypT0/is ypN0), compared to the L arm (RR: 0.73, 95% CI: 0.65–0.83, p <0.00001; Fig. 8).
Fig. 8.

Meta-analysis of pCR(ypT0/is ypN0)
pCR (ypT0/is ypN0/+)
Six trials [29, 34, 36, 40–42] with neoadjuvant therapy provided data on pCR (ypT0/is ypN0/+) (defined as the absence of residual invasive tumor in the breast) for pooling in the meta-analysis. Heterogeneity test of p=0.14, I2=45%, in pCR (T+L vs. T, ypT0/is ypN0/+) showed a low heterogeneity. The T+L arm had significant improvements in pCR (ypT0/is ypN0/+), compared to the T arm (RR: 1.31, 95% CI: 1.16–1.49, p<0.0001; Fig. 9). Heterogeneity test of p=0.05, I2=54%, in pCR (L vs. T, ypT0/is ypN0/+) showed a high heterogeneity. The T arm showed significant improvements in pCR (ypT0/is ypN0/+), compared to the L arm (RR: 0.79, 95% CI: 0.70–0.89, p<0.0001; Fig. 9).
Fig. 9.

Meta-analysis of pCR(ypT0/is ypN0/+)
Recurrence-free survival
Two trials [21, 29] provided data on RFS (defined as the interval from surgery to ipsilateral invasive breast tumor recurrence, regional recurrence, distant recurrence, or death from any cause, whichever occurred first) for pooling in the meta-analysis. Data from CHER-Lob [22] and GeparQuinto [35] were not pooled in the meta-analysis because RFS was defined as the time from randomization. Heterogeneity test of p=0.02, I2=82%, in RFS (T+L vs. T) showed a high heterogeneity. The T+L arm showed significant improvements in RFS, compared to the T arm (HR: 0.83, 95% CI: 0.72–0.96, p =0.01; Fig. 10). CALGB 40601 (30) did not find significant differences between L and T arms with regard to RFS (HR: 1.50, 95% CI: 0.82–2.77, p =0.19; Fig. 10).
Fig. 10.

Meta-analysis of RFS
Overall response rate
Eight trials [34, 36–38, 40–43] provided data on ORR (based on the World Health Organization (WHO) criteria or the Response Evaluation Criteria in Solid Tumors (RECIST)) for pooling in the meta-analysis. Data from NCIC CTG MA.31 [39] was not pooled in the meta-analysis because HER2-positive and HER2-negative patients were assessed in ORR together. Data from WJOG6110B/ELTOP [37], in which participants were all previously treated with trastuzumab with progression, were excluded. Heterogeneity test of p=0.08, I2=56% in ORR (T+L vs. T) showed a high heterogeneity. Differences in ORR between the T and T+L arms were insignificant (RR: 1.02, 95% CI: 0.96–1.09, p=0.53; Fig. 11). Heterogeneity test of p=0.66, I2=0%, in ORR (L vs. T) did not reveal any heterogeneity. Differences in ORR between T and L arms were insignificant (RR: 0.98, 95% CI: 0.93–1.03, p=0.41; Fig. 11).
Fig. 11.

Meta-analysis of ORR
Disease control rate
Four trials [35, 37, 38, 40] provided data on DCR (based on the World Health Organization (WHO) criteria or the Response Evaluation Criteria in Solid Tumors (RECIST)) for pooling in the meta-analysis. Data from NCIC CTG MA.31 [39] were not pooled in the meta-analysis because HER2-positive and HER2-negative patients were assessed in DCR together. Data from WJOG6110B/ELTOP [37], in which participants were all previously treated with trastuzumab with progression, were excluded. EORTC 10054 [40] reported that T+L and T arms had comparable DCR rates (Fig. 12). Heterogeneity test of p=0.44, I2=0%, in DCR (L vs. T) did not reveal any heterogeneity. Differences in DCR between the L and T arms were insignificant (RR: 0.96, 95% CI: 0.90–1.01, p=0.13; Fig. 12).
Fig. 12.

Meta-analysis of DCR
Rate of breast-conserving surgery
Six trials [27, 33, 36, 40–42] with neoadjuvant therapy reported data on BCS rates for pooling in the meta-analysis. Heterogeneity test of p=0.69, I2=0%, in BCS (T+L vs. T) did not reveal any heterogeneity. Differences in BCS rates between T and T+L arms were not significant (RR: 1.01, 95% CI: 0.88–1.15, p=0.94; Fig. 13). Heterogeneity test of p=0.32, I2=14%, in BCS (L vs. T) showed a low heterogeneity. Differences in BCS rates between the L and T arms were insignificant (RR: 0.94, 95% CI: 0.86–1.04, p=0.24; Fig. 13).
Fig. 13.

Meta-analysis of rate of BCS
Cardiac toxicities
Nine trials [23, 26, 27, 30, 34, 36, 37, 40, 42] provided data on cardiac toxicities (congestive heart failure (CHF) and decline of left ventricular ejection fraction (LVEF). CHF was defined as Cardiac dysfunction New York Heart Association Class, severe CHF, symptomatic CHF, or confirmed CHF. LVEF decline was defined as reported by the authors of the included studies because different thresholds were used. Data from NCIC CTG MA.31 [39] and GEICAM/2006-14 [41] were not pooled in the meta-analysis because HER2-positive and HER2-negative patients were assessed together. Heterogeneity test of p=0.04, I2=65%, in CHF (T+L vs. T) showed high heterogeneity. Differences in CHF between the T and T+L arms were insignificant (RR: 0.95, 95% CI: 0.73–1.23, p=0.71; Fig. 14). Heterogeneity test of p=0.08, I2=52%, in LVEF decline (T+L vs. T) showed high heterogeneity. Differences in LVEF decline between the T+L and T arms were insignificant (RR: 0.82, 95% CI: 0.67–1.01, p=0.06; Fig. 14). Heterogeneity test of p=0.12, I2=45%, in CHF (L vs. T) showed a low heterogeneity. Differences in CHF between the L and T arms were insignificant (RR: 0.89, 95% CI: 0.62–1.28, p=0.54; Fig. 14). Heterogeneity test of p=0.55, I2=0% in LVEF decline (L vs. T) showed no heterogeneity. Compared to the T arm, the L arm exhibited a lower incidence of LVEF decline (RR: 0.67, 95% CI: 0.50–0.90, p=0.008; Fig. 14).
Fig. 14.

Meta-analysis of cardiac toxicities. ALTTOa: trastuzumab followed by lapatinib group
Other toxicities
Data on grade III/IV toxicities reported in more than half of the trials were obtained [44]. Eleven trials [23, 26, 28, 30, 32, 36–38, 40, 42, 43] provided data on other toxicities (chemotherapy adverse effects were graded according to the National Cancer Institute Common Terminology Criteria for Adverse Events) for pooling in the meta-analysis. Data from NCIC CTG MA.31 [39] and GEICAM/2006-14 [41] was not pooled in the meta-analysis because HER2-positive and HER2-negative patients were assessed together.
Diarrhea
Eleven trials [23, 26, 28, 30, 32, 36–38, 40, 42, 43] provided data on grade III/IV diarrhea for pooling in the meta-analysis. Heterogeneity test of p=0.02, I2=57%, in diarrhea (T+L vs. T) showed high heterogeneity. Compared to the T arm, the T+L arm showed a higher incidence of grade III/IV diarrhea (RR: 8.32, 95% CI: 6.49–10.68, p<0.00001; Fig. 15). Heterogeneity test of p<0.00001, I2=81%, in diarrhea (L vs. T) showed high heterogeneity. The L arm showed a higher incidence of grade III/IV diarrhea, compared to the T arm (RR: 5.62, 95% CI: 4.41–7.17, p<0.00001; Fig. 15).
Fig. 15.

Meta-analysis of diarrhea. ALTTOa: trastuzumab followed by lapatinib group
Subgroup analysis
Division into subgroups was in accordance with I–III tumor stages [23, 26, 28, 30, 32, 36, 40, 42, 43] or MBC [37, 38]. The L arm had a higher incidence of grade III/IV diarrhea in stage I–III patients (RR: 7.90, 95% CI: 5.88–10.62, p<0.00001; Fig. 16). The L arm shows no statistical significance of grade III/IV diarrhea in MBC patients (RR: 0.99, 95% CI: 0.46–2.15, p=0.99; Fig. 16). Subgroup differences were found (interaction test, p<0.00001).
Fig. 16.

Subgroup analysis of diarrhea in accordance with tumor stage (L vs. T)
Divisions into subgroups were in accordance with treatment type, including neoadjuvant therapy [23, 28, 30, 32, 36, 40, 42, 43] and palliative therapy [37, 38]. The L arm had a higher incidence of grade III/IV diarrhea in patients with neoadjuvant therapy (RR: 6.97, 95% CI: 4.46–10.91 p<0.00001; Fig. 17). The L arm shows no statistical significance of grade III/IV diarrhea in patients with palliative therapy (RR: 0.99, 95% CI: 0.46–2.15, P=0.99; Fig. 17). Subgroup differences were found (interaction test, p<0.00001).
Fig. 17.

Subgroup analysis of diarrhea in accordance with therapy setting (L vs. T)
Neutropenia
Eight trials [23, 32, 36–38, 40, 42, 43] provided data on grade III/IV neutropenia for pooling in the meta-analysis. Heterogeneity test of p=0.42, I2=0%, in neutropenia (T+L vs. T) showed no heterogeneity. Differences in grade III/IV neutropenia between the T and T+L arms were insignificant (RR: 1.16, 95% CI: 0.86–1.56, p=0.33; Fig. 18). Heterogeneity test of p=0.02, I2=59%, in neutropenia (L vs. T) showed high heterogeneity. Differences in grade III/IV neutropenia between the T and L arms were insignificant (RR: 0.99, 95% CI: 0.89–1.09, p=0.82; Fig. 18).
Fig. 18.

Meta-analysis of neutropenia
Fatigue
Six trials [23, 28, 36, 38, 40, 42] provided data on grade III/IV fatigue for pooling in the meta-analysis. Heterogeneity test of p=0.71, I2=0%, in fatigue (T+L vs. T) showed no heterogeneity. Differences in grade III/IV fatigue between the T and T+L arms were insignificant (RR: 0.84, 95% CI: 0.42–1.67, p=0.62; Fig. 19). Heterogeneity test of p=1.00, I2=0%, in fatigue (L vs. T) did not reveal any heterogeneity. Differences in grade III/IV fatigue between the T and L arms were insignificant (RR: 1.44, 95% CI: 0.97–2.11, p=0.07; Fig. 19).
Fig. 19.

Meta-analysis of fatigue
Rash/skin toxicity
Nine trials [26, 28, 30, 32, 36–38, 40, 42] provided data on grade III/IV rash or skin toxicity for pooling in the meta-analysis. Heterogeneity test of p=0.47, I2=0%, in rash/skin toxicity (T+L vs. T) showed no heterogeneity. The T+L arm had a higher incidence of grade III/IV rash or skin toxicity, when compared to the T arm (RR: 6.75, 95% CI: 4.66–9.77, p<0.00001; Fig. 20). Heterogeneity test of p=0.54, I2=0%, in rash/skin toxicity (L vs. T) showed no heterogeneity. The L arm had a higher incidence of grade III/IV rash or skin toxicity, when compared to the T arm (RR: 8.71, 95% CI: 5.64–13.45, p<0.00001; Fig. 20).
Fig. 20.

Meta-analysis of rash/skin toxicity
Vomiting
Six trials [28, 36, 38, 40, 42, 43] provided data on grade III/IV vomiting for pooling in the meta-analysis. Heterogeneity test of p=0.99, I2=0%, in vomiting (T+L vs. T) did not reveal any heterogeneity. Differences in grade III/IV vomiting between the T+L and T arms were not significant (RR: 2.17, 95% CI: 0.91–5.19, p=0.08; Fig. 21). Heterogeneity test of p=0.82, I2=0%, in vomiting (L vs. T) did not reveal any heterogeneity. Differences in grade III/IV vomiting between the L and T arms were insignificant (RR: 1.29, 95% CI: 0.69–2.43, p=0.42; Fig. 21).
Fig. 21.

Meta-analysis of vomiting
Nausea
Six trials [28, 36, 38, 40, 42, 43] provided data on grade III/IV nausea for pooling in the meta-analysis. Heterogeneity test of p=0.52, I2=0%, in nausea (T+L vs. T) did not reveal any heterogeneity. Differences in grade III/IV nausea between the T+L and T arms were insignificant (RR: 1.61, 95% CI: 0.64–4.06, p=0.31; Fig. 22). Heterogeneity test of p=0.81, I2=0%, in nausea (L vs. T) did not reveal any heterogeneity. Differences in grade III/IV nausea between the T and L arms were insignificant (RR: 1.02, 95% CI: 0.58–1.80, p=0.94; Fig. 22).
Fig. 22.

Meta-analysis of nausea
In this manuscript, we only reported subgroup analysis with a high possibility of subgroup effects. Findings from the meta-analysis and subgroup analyses are summarized in Additional file 4: Table S2. All descriptions and forest plots from subgroup analyses, including from unreported subgroups, are shown in Additional file 1 (Figure S1–S20).
Publication bias
Publication bias were assessed for the primary outcomes. The Egger’s test did not reveal any publication bias with regard to OS (T+L vs. T) (t=−1.43, p=0.248, p>0.05) and OS (L vs. T) (t=−1.71, p=0.163, p>0.05). Since only 2 trials were included in PFS (L vs. T), the publication bias of this outcome was not determined. The Egger’s test did not reveal any publication bias with regard to DFS/EFS (T+L vs. T; t=−2.56, p=0.051, p>0.05); however, there was a publication bias with regard to DFS/EFS (L vs. T; t=−10.88, p=0.008, p≤0.05). These findings are shown in Additional file 2 (Figure S1–S4).
Sensitivity analysis
The result of DFS/EFS (L vs. T) revealed a significant difference with the previous result by the change of model [RR = 1.13, 95%CI: 0.91 to 1.42, p = 0.27, REM]. The result of RFS (T+L vs. T) revealed a significant difference with the previous result by the change of model [RR = 0.57, 95%CI: 0.22 to 1.48, p = 0.25, REM]. The heterogeneity test for pCR (L vs. T, ypT0/is ypN0/+; p = 0.05, I2 = 54%) revealed a high heterogeneity. After excluding data from the NSABP B-41 trial for AC followed by Doc chemotherapy, there was no heterogeneity (p = 0.52, I2 = 0). Therefore, this study is the source of heterogeneity. After deleting the heterogeneity source, the result of pCR (L vs. T, ypT0/is ypN0/+) using the fixed effects model revealed insignificant difference with the previous result [RR = 0.72, 95%CI: 0.62 to 0.83, p < 0.00001]. The heterogeneity test for ORR (T+L vs. T) revealed a high heterogeneity (p = 0.08, I2 = 56%). After excluding data from the NeoALTTO trial, which used wP chemotherapy as the neoadjuvant therapy and FEC chemotherapy as the adjuvant therapy, there was no heterogeneity (p = 0.41, I2 = 0). Therefore, this study is the source of heterogeneity. After deleting the source of heterogeneity, the result of ORR (T+L vs. T) using the fixed effects model revealed insignificant difference with the previous result [RR = 0.96, 95%CI: 0.90 to 1.03, p = 0.28]. The heterogeneity test for CHF (T+L vs. T) revealed high heterogeneity (p = 0.04, I2 = 65%). After excluding data from the ALTTO trial, which used anti-HER2 therapy as the adjuvant therapy, there was a low heterogeneity (p = 0.23, I2 = 31%). Therefore, this study was the source of heterogeneity. After deleting the source of heterogeneity, the result of CHF (T+L vs. T) using the fixed effects model shows insignificant difference with the previous result [RR = 0.65, 95%CI: 0.44 to 0.97, p = 0.04]. The heterogeneity test for LVEF decline (T+L vs. T) revealed a high heterogeneity (p = 0.08, I2 = 52%). After excluding data from the ALTTO trial (ALTTO and ALTTOa), which used anti-HER2 therapy as the adjuvant therapy, there was no heterogeneity (p = 0.83, I2 = 0%). Therefore, this study was the source of heterogeneity. After deleting the source of heterogeneity, the result of LVEF decline (T+L vs. T) using the fixed effects model shows insignificant difference with the previous result [RR = 0.55, 95%CI: 0.11 to 2.73, p = 0.46]. The heterogeneity test for diarrhea (T+L vs. T) revealed a high heterogeneity (p = 0.02, I2 = 57%). After excluding data from ALTTOa, which used trastuzumab followed by lapatinib as the anti-HER2 therapy, there was no heterogeneity (p = 1.00, I2 = 0%). Therefore, this study was the heterogeneity source. After deleting the source of heterogeneity, the result of diarrhea (T+L vs. T) using the fixed effects model showed insignificant difference with the previous result [RR = 11.39, 95%CI: 8.30 to 15.63, p < 0.00001]. The heterogeneity test for diarrhea (L vs. T) revealed a high heterogeneity (p < 0.00001, I2 = 81%). After excluding data from the CEREBEL trial with a low methodology method, there is little heterogeneity (p = 0.34, I2 = 11%). Therefore, this study was the source of heterogeneity. After deleting the heterogeneity source, the result of diarrhea (L vs. T) using the fixed effects model shows insignificant difference with the previous result [RR = 7.62, 95%CI: 5.73 to 10.11, p < 0.00001]. The heterogeneity test for neutropenia (L vs. T) revealed a high heterogeneity (p = 0.02, I2 = 59%). After excluding data from the NeoALTTO trial, which used wP chemotherapy as the neoadjuvant therapy, there was little heterogeneity (p = 0.71, I2 = 0%). Therefore, this study was the source of heterogeneity. After deleting the source of heterogeneity, the result of Neutropenia (L vs. T) using the fixed effects model shows insignificant difference with the previous result [RR = 0.92, 95%CI: 0.83 to 1.02, p= 0.10]. All results are stable. Findings from sensitivity analysis are shown in Table 3.
Table 3.
Sensitivity analysis
| Trials | No. of patients | T+L/L | T | RR or HR (95% CI) | P-value | I2 (%) |
|---|---|---|---|---|---|---|
| OS (T+L vs. T) | ||||||
| ALTTO | 4190 | 2093 | 2097 | 0.83 [0.69, 1.01] | 0.06 | 15% |
| ALTTOa | 4188 | 2091 | 2097 | 0.82 [0.68, 0.99] | 0.04 | 12% |
| CALGB 40601 | 238 | 118 | 120 | 0.86 [0.75, 0.99] | 0.04 | 0% |
| CHER-Lob | 82 | 46 | 36 | 0.84 [0.73, 0.97] | 0.02 | 15% |
| NeoALTTO | 301 | 152 | 149 | 0.85 [0.74, 0.99] | 0.03 | 9% |
| Pooled estimate | 8999 | 4500 | 4499 | 0.84 [0.73, 0.97] | 0.02 | 0% |
| OS (L vs. T) | ||||||
| ALTTO | 4197 | 2100 | 2097 | 1.18 [0.97, 1.45] | 0.19 | 35% |
| CALGB 40601 | 187 | 67 | 120 | 1.26 [1.08, 1.47] | 0.003 | 43% |
| CEREBEL | 540 | 271 | 269 | 1.24 [1.05, 1.47] | 0.01 | 42% |
| GeparQuinto | 615 | 308 | 307 | 1.32 [1.13, 1.54] | 0.0006 | 0% |
| NCIC CTG MA.31 | 537 | 270 | 267 | 1.22 [1.03, 1.44] | 0.02 | 35% |
| NeoALTTO | 303 | 154 | 149 | 1.30 [1.11, 1.52] | 0.001 | 16% |
| Pooled estimate | 6379 | 3170 | 3209 | 1.26 [1.08, 1.46] | 0.003 | 29% |
| PFS (L vs. T) | ||||||
| CEREBEL | 540 | 271 | 269 | 1.47 [1.03, 2.09] | 0.03 | / |
| NCIC CTG MA.31 | 537 | 270 | 267 | 1.30 [1.04, 1.64] | 0.02 | / |
| Pooled estimate | 1077 | 541 | 536 | 1.35 [1.11, 1.64] | 0.002 | 0% |
| DFS/EFS (T+L vs. T) | ||||||
| ALTTO | 4190 | 2093 | 2097 | 0.91 [0.79, 1.04] | 0.15 | 35% |
| ALTTOa | 4188 | 2091 | 2097 | 0.84 [0.73, 0.97] | 0.01 | 10% |
| CHER-Lob | 82 | 46 | 36 | 0.89 [0.81, 0.99] | 0.03 | 0% |
| NeoALTTO | 301 | 152 | 149 | 0.89 [0.80, 0.99] | 0.03 | 36% |
| Pooled estimate | 8761 | 4382 | 4379 | 0.89 [0.80, 0.98] | 0.02 | 9% |
| DFS/EFS (L vs. T) (REM) | ||||||
| ALTTO | 4197 | 2100 | 2097 | 0.98 [0.75, 1.27] | 0.88 | 0% |
| CHER-Lob | 75 | 39 | 36 | 1.20 [0.98, 1.46] | 0.08 | 28% |
| GeparQuinto | 615 | 308 | 307 | 1.12 [0.81, 1.55] | 0.49 | 48% |
| NeoALTTO | 303 | 154 | 149 | 1.15 [0.87, 1.53] | 0.31 | 45% |
| Pooled estimate | 5190 | 2601 | 2589 | 1.13 [0.91, 1.42] | 0.27 | 36% |
| pCR (T+L vs. T, ypT0/is ypN0) | ||||||
| CALGB 40601 | 233 | 116 | 117 | 1.29 [1.13, 1.48] | 0.0002 | 27% |
| CHER-Lob | 79 | 43 | 36 | 1.25 [1.11, 1.41] | 0.0003 | 14% |
| EORTC 10054 | 100 | 48 | 52 | 1.29 [1.14, 1.47] | < 0.0001 | 21% |
| LPT109096 | 66 | 33 | 33 | 1.29 [1.14, 1.46] | < 0.0001 | 16% |
| NeoALTTO | 290 | 145 | 145 | 1.19 [1.05, 1.35] | 0.008 | 0% |
| NSABP B-41 | 347 | 171 | 176 | 1.30 [1.12, 1.51] | 0.0007 | 28% |
| TRIO-US B07 | 92 | 58 | 34 | 1.29 [1.14, 1.46] | < 0.0001 | 25% |
| Pooled estimate | 1207 | 614 | 593 | 1.27 [1.13, 1.43] | < 0.0001 | 14% |
| pCR (L vs. T, ypT0/is ypN0) | ||||||
| CALGB 40601 | 179 | 62 | 117 | 0.74 [0.65, 0.84] | <0.00001 | 28% |
| CHER-Lob | 71 | 35 | 36 | 0.73 [0.64, 0.82] | <0.00001 | 28% |
| EORTC 10054 | 74 | 22 | 52 | 0.73 [0.65, 0.83] | <0.00001 | 32% |
| GEICAM/2006-14 | 99 | 51 | 48 | 0.75 [0.66, 0.85] | <0.00001 | 14% |
| GeparQuinto | 615 | 308 | 307 | 0.76 [0.66, 0.89] | 0.0005 | 23% |
| LPT109096 | 67 | 34 | 33 | 0.73 [0.65, 0.83] | <0.00001 | 32% |
| NeoALTTO | 295 | 150 | 145 | 0.73 [0.65, 0.83] | <0.00001 | 32% |
| NSABP B-41 | 347 | 171 | 176 | 0.67 [0.58, 0.77] | <0.00001 | 0% |
| TRIO-US B07 | 70 | 36 | 34 | 0.74 [0.66, 0.84] | <0.00001 | 24% |
| Pooled estimate | 1817 | 869 | 948 | 0.73 [0.65, 0.83] | <0.00001 | 22% |
| pCR (T+L vs. T, ypT0/is ypN0/+) | ||||||
| CALGB 40601 | 238 | 118 | 120 | 1.33 [1.15, 1.54] | <0.0001 | 63% |
| EORTC 10054 | 100 | 48 | 52 | 1.33 [1.17, 1.52] | <0.0001 | 61% |
| NeoALTTO | 301 | 152 | 149 | 1.20 [1.05, 1.38] | 0.008 | 0% |
| NSABP B-41 | 348 | 171 | 177 | 1.41 [1.19, 1.67] | <0.0001 | 49% |
| Pooled estimate | 987 | 489 | 498 | 1.31 [1.16, 1.49] | <0.0001 | 45% |
| pCR (L vs. T, ypT0/is ypN0/+) | ||||||
| CALGB 40601 | 187 | 67 | 120 | 0.80 [0.71, 0.91] | 0.0005 | 60% |
| EORTC 10054 | 74 | 22 | 52 | 0.79 [0.70, 0.89] | <0.0001 | 63% |
| GEICAM/2006-14 | 99 | 51 | 48 | 0.81 [0.72, 0.92] | 0.0007 | 47% |
| GeparQuinto | 615 | 308 | 307 | 0.84 [0.72, 0.98] | 0.02 | 53% |
| NeoALTTO | 303 | 154 | 149 | 0.78 [0.69, 0.89] | 0.0001 | 64% |
| NSABP B-41 | 348 | 171 | 177 | 0.72 [0.62, 0.83] | <0.00001 | 0% |
| Pooled estimate | 1626 | 773 | 853 | 0.79 [0.70, 0.89] | <0.0001 | 54% |
| RFS (T+L vs. T) (REM) | ||||||
| ALTTO | 4190 | 2093 | 2097 | 0.32 [0.14, 0.71] | 0.005 | / |
| CALGB 40601 | 238 | 118 | 120 | 0.86 [0.74, 1.00] | 0.05 | / |
| Pooled estimate | 4428 | 2211 | 2217 | 0.57 [0.22, 1.48] | 0.25 | 82% |
| ORR (T+L vs. T) | ||||||
| EORTC 10054 | 99 | 47 | 52 | 1.04 [0.98, 1.12] | 0.21 | 58% |
| LPT109096 | 66 | 33 | 33 | 1.02 [0.96, 1.09] | 0.50 | 71% |
| NeoALTTO | 301 | 152 | 149 | 0.96 [0.90, 1.03] | 0.28 | 0% |
| NSABP B-41 | 331 | 164 | 167 | 1.05 [0.95, 1.17] | 0.34 | 65% |
| Pooled estimate | 797 | 396 | 401 | 1.02 [0.96, 1.09] | 0.53 | 56% |
| ORR (L vs. T) | ||||||
| CEREBEL | 540 | 271 | 269 | 1.00 [0.95, 1.04] | 0.88 | 0% |
| EORTC 10054 | 73 | 21 | 52 | 0.98 [0.93, 1.03] | 0.48 | 0% |
| GEICAM/2006-14 | 99 | 51 | 48 | 0.98 [0.93, 1.03] | 0.43 | 0% |
| GeparQuinto | 615 | 308 | 307 | 0.98 [0.91, 1.06] | 0.66 | 0% |
| LPT109096 | 67 | 34 | 33 | 0.97 [0.93, 1.03] | 0.32 | 0% |
| NeoALTTO | 303 | 154 | 149 | 0.97 [0.91, 1.02] | 0.20 | 0% |
| NSABP B-41 | 330 | 163 | 167 | 0.97 [0.91, 1.03] | 0.34 | 0% |
| Pooled estimate | 2027 | 1002 | 1025 | 0.98 [0.93, 1.03] | 0.41 | 0% |
| DCR (L vs. T) | ||||||
| CEREBEL | 540 | 271 | 269 | 0.96 [0.93, 1.00] | 0.03 | 24% |
| EORTC 10054 | 73 | 21 | 52 | 0.96 [0.91, 1.02] | 0.21 | 0% |
| GeparQuinto | 615 | 308 | 307 | 0.93 [0.79, 1.09] | 0.36 | 0% |
| Pooled estimate | 1228 | 600 | 628 | 0.96 [0.90, 1.01] | 0.13 | 0% |
| Rate of BCS (T+L vs. T) | ||||||
| CHER-Lob | 81 | 45 | 36 | 1.00 [0.86, 1.16] | 0.99 | 0% |
| EORTC 10054 | 102 | 50 | 52 | 0.99 [0.86, 1.14] | 0.88 | 0% |
| NeoALTTO | 286 | 143 | 143 | 0.97 [0.83, 1.14] | 0.73 | 0% |
| NSABP B-41 | 348 | 171 | 177 | 1.08 [0.90, 1.30] | 0.40 | 0% |
| Pooled estimate | 817 | 409 | 408 | 1.01 [0.88, 1.15] | 0.94 | 0% |
| Rate of BCS (L vs. T) | ||||||
| CHER-Lob | 74 | 38 | 36 | 0.95 [0.86, 1.05] | 0.31 | 28% |
| EORTC 10054 | 74 | 22 | 52 | 0.93 [0.84, 1.03] | 0.16 | 0% |
| GEICAM/2006-14 | 99 | 51 | 48 | 0.94 [0.85, 1.04] | 0.22 | 29% |
| GeparQuinto | 615 | 308 | 307 | 0.97 [0.85, 1.11] | 0.64 | 27% |
| NeoALTTO | 286 | 143 | 143 | 0.91 [0.82, 1.01] | 0.08 | 0% |
| NSABP B-41 | 348 | 171 | 177 | 0.98 [0.88, 1.09] | 0.70 | 4% |
| Pooled estimate | 1496 | 733 | 763 | 0.94 [0.86, 1.04] | 0.24 | 14% |
| CHF (T+L vs. T) | ||||||
| TRIO-US B07 | 92 | 58 | 34 | 0.95 [0.73, 1.23] | 0.71 | 65% |
| NSABP B-41 | 351 | 173 | 178 | 1.00 [0.77, 1.31] | 0.98 | 62% |
| NeoALTTO | 301 | 152 | 149 | 0.94 [0.73, 1.22] | 0.66 | 75% |
| EORTC 10054 | 103 | 50 | 53 | 0.95 [0.73, 1.23] | 0.71 | 65% |
| CHER-Lob | 82 | 46 | 36 | 0.95 [0.73, 1.23] | 0.71 | 65% |
| CALGB 40601 | 235 | 117 | 118 | 0.95 [0.73, 1.23] | 0.71 | 65% |
| ALTTOa | 4152 | 2076 | 2076 | 1.17 [0.84, 1.65] | 0.35 | 55% |
| ALTTO | 4137 | 2061 | 2076 | 0.65 [0.44, 0.97] | 0.04 | 31% |
| Pooled estimate | 9453 | 4733 | 4720 | 0.95 [0.73, 1.23] | 0.71 | 65% |
| CHF (L vs. T) | ||||||
| WJOG6110B/ELTOP | 86 | 43 | 43 | 0.88 [0.61, 1.26] | 0.47 | 55% |
| TRIO-US B07 | 70 | 36 | 34 | 0.89 [0.62, 1.28] | 0.54 | 45% |
| NSABP B-41 | 351 | 173 | 178 | 0.88 [0.60, 1.28] | 0.50 | 58% |
| NeoALTTO | 303 | 154 | 149 | 0.89 [0.62, 1.28] | 0.54 | 45% |
| GeparQuinto | 615 | 308 | 307 | 0.79 [0.55, 1.15] | 0.22 | 2% |
| EORTC 10054 | 75 | 22 | 53 | 0.86 [0.60, 1.24] | 0.43 | 45% |
| CHER-Lob | 78 | 39 | 39 | 0.89 [0.62, 1.28] | 0.54 | 45% |
| CALGB 40601 | 182 | 64 | 118 | 0.89 [0.62, 1.28] | 0.54 | 45% |
| ALTTO | 4133 | 2057 | 2076 | 2.03 [0.92, 4.48] | 0.08 | 18% |
| Pooled estimate | 5893 | 2896 | 2997 | 0.89 [0.62, 1.28] | 0.54 | 45% |
| Decline of LVEF (T+L vs. T) | ||||||
| TRIO-US B07 | 92 | 58 | 34 | 0.82 [0.67, 1.01] | 0.06 | 64% |
| NSABP B-41 | 351 | 173 | 178 | 0.82 [0.67, 1.01] | 0.08 | 52% |
| NeoALTTO | 301 | 152 | 149 | 0.82 [0.67, 1.01] | 0.06 | 64% |
| EORTC 10054 | 103 | 50 | 53 | 0.82 [0.67, 1.01] | 0.06 | 52% |
| CHER-Lob | 82 | 46 | 36 | 0.83 [0.67, 1.01] | 0.07 | 62% |
| CALGB 40601 | 235 | 117 | 118 | 0.82 [0.67, 1.01] | 0.06 | 52% |
| ALTTOa | 4152 | 2076 | 2076 | 1.05 [0.80, 1.37] | 0.72 | 0% |
| ALTTO | 4137 | 2061 | 2076 | 0.59 [0.43, 0.80] | 0.0009 | 0% |
| Pooled estimate | 9453 | 4733 | 4720 | 0.82 [0.67, 1.01] | 0.06 | 52% |
| Decline of LVEF (L vs. T) | ||||||
| WJOG6110B/ELTOP | 86 | 43 | 43 | 0.67 [0.50, 0.90] | 0.008 | 0% |
| TRIO-US B07 | 70 | 36 | 34 | 0.66 [0.49, 0.89] | 0.006 | 0% |
| NSABP B-41 | 351 | 173 | 178 | 0.67 [0.50, 0.90] | 0.008 | 0% |
| NeoALTTO | 303 | 154 | 149 | 0.67 [0.49, 0.90] | 0.008 | 0% |
| GeparQuinto | 615 | 308 | 307 | 0.68 [0.51, 0.93] | 0.01 | 0% |
| EORTC 10054 | 75 | 22 | 53 | 0.65 [0.48, 0.88] | 0.005 | 0% |
| CHER-Lob | 75 | 39 | 36 | 0.67 [0.50, 0.91] | 0.010 | 0% |
| CALGB 40601 | 182 | 64 | 118 | 0.67 [0.50, 0.90] | 0.008 | 0% |
| ALTTO | 4133 | 2057 | 2076 | 0.82 [0.30, 2.24] | 0.70 | 0% |
| Pooled estimate | 5890 | 2896 | 2994 | 0.67 [0.50, 0.90] | 0.008 | 0% |
| Diarrhea (T+L vs. T) | ||||||
| ALTTO | 4137 | 2061 | 2076 | 6.06 [4.37, 8.41] | <0.00001 | 28% |
| ALTTOa | 4152 | 2076 | 2076 | 11.39 [8.30, 15.63] | <0.00001 | 0% |
| CALGB 40601 | 235 | 117 | 118 | 8.19 [6.36, 10.55] | <0.00001 | 61% |
| CHER-Lob | 82 | 46 | 36 | 8.25 [6.42, 10.61] | <0.00001 | 61% |
| EORTC 10054 | 103 | 50 | 53 | 8.31 [6.46, 10.67] | <0.00001 | 62% |
| LPT109096 | 63 | 31 | 32 | 8.35 [6.50, 10.72] | <0.00001 | 62% |
| NeoALTTO | 297 | 149 | 148 | 8.25 [6.38, 10.67] | <0.00001 | 62% |
| NSABP B-41 | 351 | 173 | 178 | 8.11 [6.27, 10.49] | <0.00001 | 60% |
| TRIO-US B07 | 92 | 58 | 34 | 8.30 [6.46, 10.67] | <0.00001 | 62% |
| Pooled estimate | 9512 | 4761 | 4751 | 8.32 [6.49, 10.68] | <0.00001 | 57% |
| Diarrhea (L vs. T) | ||||||
| ALTTO | 4133 | 2057 | 2076 | 3.81 [2.78, 5.21] | <0.00001 | 76% |
| CALGB 40601 | 182 | 64 | 118 | 5.48 [4.28, 7.02] | <0.00001 | 82% |
| CEREBEL | 536 | 269 | 267 | 7.62 [5.73, 10.11] | <0.00001 | 11% |
| CHER-Lob | 75 | 39 | 36 | 5.52 [4.32, 7.05] | <0.00001 | 82% |
| EORTC 10054 | 75 | 22 | 53 | 5.63 [4.41, 7.19] | <0.00001 | 83% |
| GeparQuinto | 615 | 308 | 307 | 5.76 [4.45, 7.46] | <0.00001 | 83% |
| LPT109096 | 66 | 34 | 32 | 5.63 [4.41, 7.19] | <0.00001 | 83% |
| NeoALTTO | 299 | 151 | 148 | 5.40 [4.20, 6.95] | <0.00001 | 82% |
| NSABP B-41 | 351 | 173 | 178 | 5.43 [4.22, 6.98] | <0.00001 | 82% |
| TRIO-US B07 | 70 | 36 | 34 | 5.64 [4.41, 7.20] | <0.00001 | 83% |
| WJOG6110B/ELTOP | 86 | 43 | 43 | 5.85 [4.55, 7.51] | <0.00001 | 81% |
| Pooled estimate | 6488 | 3196 | 3292 | 5.62 [4.41, 7.17] | <0.00001 | 81% |
| Neutropenia (T+L vs. T) | ||||||
| EORTC 10054 | 103 | 50 | 53 | 1.19 [0.81, 1.74] | 0.39 | 22% |
| LPT109096 | 63 | 31 | 32 | 1.20 [0.89, 1.62] | 0.23 | 0% |
| NeoALTTO | 297 | 149 | 148 | 1.04 [0.76, 1.41] | 0.82 | 0% |
| NSABP B-41 | 351 | 173 | 178 | 1.27 [0.87, 1.85] | 0.22 | 18% |
| TRIO-US B07 | 92 | 58 | 34 | 1.16 [0.85, 1.57] | 0.35 | 23% |
| Pooled estimate | 906 | 461 | 445 | 1.16 [0.86, 1.56] | 0.33 | 0% |
| Neutropenia (L vs. T) | ||||||
| CEREBEL | 536 | 269 | 267 | 1.01 [0.91, 1.11] | 0.86 | 64% |
| EORTC 10054 | 75 | 22 | 53 | 0.98 [0.89, 1.09] | 0.76 | 65% |
| GeparQuinto | 615 | 308 | 307 | 1.17 [0.88, 1.56] | 0.28 | 61% |
| LPT109096 | 66 | 34 | 32 | 1.00 [0.90, 1.10] | 0.98 | 62% |
| NeoALTTO | 299 | 151 | 148 | 0.92 [0.83, 1.02] | 0.10 | 0% |
| NSABP B-41 | 351 | 173 | 178 | 0.99 [0.89, 1.09] | 0.82 | 65% |
| TRIO-US B07 | 70 | 36 | 34 | 0.99 [0.89, 1.09] | 0.78 | 65% |
| WJOG6110B/ELTOP | 86 | 43 | 43 | 0.99 [0.90, 1.10] | 0.87 | 65% |
| Pooled estimate | 2098 | 1036 | 1062 | 0.99 [0.89, 1.09] | 0.82 | 59% |
| Fatigue (T+L vs. T) | ||||||
| CHER-Lob | 82 | 46 | 36 | 0.73 [0.34, 1.57] | 0.42 | 0% |
| EORTC 10054 | 103 | 50 | 53 | 0.95 [0.46, 1.94] | 0.88 | 0% |
| NSABP B-41 | 351 | 173 | 178 | 0.87 [0.30, 2.48] | 0.79 | 0% |
| TRIO-US B07 | 92 | 58 | 34 | 0.84 [0.40, 1.76] | 0.64 | 0% |
| Pooled estimate | 628 | 327 | 301 | 0.84 [0.42, 1.67] | 0.62 | 0% |
| Fatigue (L vs. T) | ||||||
| CEREBEL | 536 | 269 | 267 | 1.43 [0.95, 2.15] | 0.09 | 0% |
| CHER-Lob | 75 | 39 | 36 | 1.44 [0.97, 2.14] | 0.07 | 0% |
| EORTC 10054 | 75 | 22 | 53 | 1.41 [0.95, 2.09] | 0.09 | 0% |
| GeparQuinto | 615 | 308 | 307 | 1.45 [0.83, 2.54] | 0.20 | 0% |
| NSABP B-41 | 351 | 173 | 178 | 1.47 [0.94, 2.29] | 0.09 | 0% |
| TRIO-US B07 | 70 | 36 | 34 | 1.44 [0.97, 2.14] | 0.07 | 0% |
| Pooled estimate | 1722 | 847 | 875 | 1.44 [0.97, 2.11] | 0.07 | 0% |
| Rash/Skin toxicity (T+L vs. T) | ||||||
| ALTTO | 4137 | 2061 | 2076 | 5.75 [3.57, 9.24] | <0.00001 | 0% |
| ALTTOa | 4152 | 2076 | 2076 | 6.80 [4.25, 10.87] | <0.00001 | 11% |
| CALGB 40601 | 235 | 117 | 118 | 6.66 [4.54, 9.77] | <0.00001 | 9% |
| CHER-Lob | 82 | 46 | 36 | 7.11 [4.85, 10.44] | <0.00001 | 0% |
| EORTC 10054 | 103 | 50 | 53 | 7.08 [4.84, 10.38] | <0.00001 | 0% |
| NeoALTTO | 297 | 149 | 148 | 6.74 [4.63, 9.82] | <0.00001 | 11% |
| NSABP B-41 | 351 | 173 | 178 | 6.77 [4.66, 9.84] | <0.00001 | 10% |
| Pooled estimate | 9357 | 4672 | 4685 | 6.75 [4.66, 9.77] | <0.00001 | 0% |
| Rash/Skin toxicity (L vs. T) | ||||||
| ALTTO | 4133 | 2057 | 2076 | 6.45 [3.38, 12.29] | <0.00001 | 0% |
| CALGB 40601 | 182 | 64 | 118 | 8.67 [5.51, 13.65] | <0.00001 | 0% |
| CEREBEL | 536 | 269 | 267 | 8.93 [5.73, 13.93] | <0.00001 | 0% |
| CHER-Lob | 75 | 39 | 36 | 9.33 [5.91, 14.72] | <0.00001 | 0% |
| EORTC 10054 | 75 | 22 | 53 | 9.31 [5.94, 14.58] | <0.00001 | 0% |
| GeparQuinto | 615 | 308 | 307 | 8.48 [5.37, 13.38] | <0.00001 | 0% |
| NeoALTTO | 299 | 151 | 148 | 8.75 [5.61, 13.65] | <0.00001 | 0% |
| NSABP B-41 | 351 | 173 | 178 | 8.55 [5.51, 13.28] | <0.00001 | 0% |
| WJOG6110B/ELTOP | 86 | 43 | 43 | 8.75 [5.63, 13.58] | <0.00001 | 0% |
| Pooled estimate | 6352 | 3126 | 3226 | 8.71 [5.64, 13.45] | <0.00001 | 0% |
| Vomiting (T+L vs. T) | ||||||
| CHER-Lob | 82 | 46 | 36 | 2.27 [0.80, 6.44] | 0.12 | 0% |
| EORTC 10054 | 103 | 50 | 53 | 2.10 [0.85, 5.19] | 0.11 | 0% |
| LPT109096 | 63 | 31 | 32 | 2.11 [0.85, 5.21] | 0.11 | 0% |
| NSABP B-41 | 351 | 173 | 178 | 2.31 [0.64, 8.37] | 0.20 | 0% |
| Pooled estimate | 599 | 300 | 299 | 2.17 [0.91, 5.19] | 0.08 | 0% |
| Vomiting (L vs. T) | ||||||
| CEREBEL | 536 | 269 | 267 | 1.39 [0.68, 2.84] | 0.37 | 0% |
| CHER-Lob | 75 | 39 | 36 | 1.28 [0.65, 2.53] | 0.48 | 0% |
| EORTC 10054 | 75 | 22 | 53 | 1.29 [0.69, 2.43] | 0.42 | 0% |
| GeparQuinto | 615 | 308 | 307 | 1.56 [0.73, 3.33] | 0.25 | 0% |
| LPT109096 | 66 | 34 | 32 | 1.24 [0.65, 2.38] | 0.51 | 0% |
| NSABP B-41 | 351 | 173 | 178 | 1.05 [0.49, 2.26] | 0.89 | 0% |
| Pooled estimate | 1718 | 845 | 873 | 1.29 [0.69, 2.43] | 0.42 | 0% |
| Nausea (T+L vs. T) | ||||||
| CHER-Lob | 82 | 46 | 36 | 1.45 [0.46, 4.55] | 0.52 | 12% |
| EORTC 10054 | 103 | 50 | 53 | 2.33 [0.80, 6.76] | 0.12 | 0% |
| LPT109096 | 63 | 31 | 32 | 1.50 [0.57, 3.96] | 0.41 | 7% |
| NSABP B-41 | 351 | 173 | 178 | 1.24 [0.40, 3.91] | 0.71 | 0% |
| Pooled estimate | 599 | 300 | 299 | 1.61 [0.64, 4.06] | 0.31 | 0% |
| Nausea (L vs. T) | ||||||
| CEREBEL | 536 | 269 | 267 | 1.03 [0.56, 1.89] | 0.94 | 0% |
| CHER-Lob | 75 | 39 | 36 | 0.98 [0.54, 1.80] | 0.96 | 0% |
| EORTC 10054 | 75 | 22 | 53 | 0.94 [0.52, 1.72] | 0.85 | 0% |
| GeparQuinto | 615 | 308 | 307 | 1.43 [0.60, 3.37] | 0.42 | 0% |
| LPT109096 | 66 | 34 | 32 | 1.02 [0.58, 1.80] | 0.94 | 0% |
| NSABP B-41 | 351 | 173 | 178 | 0.97 [0.53, 1.77] | 0.92 | 0% |
| Pooled estimate | 1718 | 845 | 873 | 1.02 [0.58, 1.80] | 0.94 | 0% |
Evidence quality assessment
Thirty-seven outcomes were assessed by GRADE. Risk bias: Almost all outcomes were considered serious risk due to unclear allocation concealment of the included studies, except outcomes of BCS rates for T+L vs. T and L vs. T. Inconsistency: High heterogeneities were found in outcomes of pCR (L vs. T, ypT0/is ypN0/+), RFS (T+L vs. T), ORR (T+L vs. T), CHF (T+L vs. T), LVEF decline (T+L vs. T), diarrhea (T+L vs. T), diarrhea (L vs. T), and neutropenia (L vs. T). Thus, these outcomes were considered serious risk of inconsistency. Indirectness: All outcomes had no significant indirectness, because all trials were direct comparisons. Imprecision: Outcomes of OS (L vs. T, neoadjuvant therapy), DFS/EFS (L vs. T), RFS (T+L vs. T), ORR (T+L vs. T), ORR (L vs. T), DCR (L vs. T), rate of BCS (T+L vs. T), rate of BCS (L vs. T), CHF (T+L vs. T), CHF (L vs. T), LVEF decline (T+L vs. T), diarrhea (T+L vs. MBC), diarrhea (T+L vs. palliative therapy), neutropenia (T+L vs. T), neutropenia (L vs. T), fatigue (T+L vs. T), fatigue (L vs. T), vomiting (T+L vs. T), vomiting (L vs. T), nausea (T+L vs. T), and nausea (L vs. T) were considered serious risk of imprecision due to insufficient sample size. Publication bias: DFS/EFS (L vs. T), CHF (L vs. T) and nausea (L vs. T) exhibited a publication bias. Overall: No outcomes had high-quality evidence, 15 outcomes had moderate-quality evidence, 14 outcomes had low-quality evidence, and 8 outcomes had very low-quality evidence (Table 4).
Table 4.
GRADE evidence profile of outcomes
| Outcome | Number of studies | Assessment of evidence quality | Number of participants | Effect(95%CI) | Evidence quality | ||||
|---|---|---|---|---|---|---|---|---|---|
| Risk bias | Inconsistency | Indirectness | Imprecision | Publication bias | |||||
| OS (T+L vs. T) | 4 | Serious | No | No | No | Undetected | 8999 | HR = 0.84 [0.73, 0.97] | Moderate |
| OS (L vs. T) | 6 | Serious | No | No | No | Undetected | 6379 | HR = 1.26 [1.08, 1.46] | Moderate |
| OS (L vs. T, neoadjuvant therapy) | 3 | Serious | No | No | Serious | Undetected | 1105 | HR = 0.85 [0.60, 1.20] | Low |
| OS (L vs. T, palliative therapy) | 2 | Serious | No | No | No | Undetected | 1077 |
HR = 1.40 [1.10, 1.80] |
Moderate |
| PFS (L vs. T) | 2 | Serious | No | No | No | Undetected | 1077 | HR = 1.35 [1.11, 1.64] | Moderate |
| DFS/EFS (T+L vs. T) | 3 | Serious | No | No | No | Undetected | 8761 | HR = 0.89 [0.80, 0.98] | Moderate |
| DFS/EFS (L vs. T) | 4 | Serious | No | No | Serious | Detected | 5190 | HR = 1.22 [1.05, 1.41] | Very low |
| pCR (T+L vs. T, ypT0/is ypN0) | 7 | Serious | No | No | No | Undetected | 1207 | RR = 1.27 [1.13, 1.43] | Moderate |
| pCR (L vs. T, ypT0/is ypN0) | 9 | Serious | No | No | No | Undetected | 1817 | RR = 0.73 [0.65, 0.83] | Moderate |
| pCR (T+L vs. T, ypT0/is ypN0/+) | 4 | Serious | No | No | No | Undetected | 987 | RR = 1.31 [1.16, 1.49] | Moderate |
| pCR (L vs. T, ypT0/is ypN0/+) | 6 | Serious | Serious | No | No | Undetected | 1626 | RR = 0.79 [0.70, 0.89] | Low |
| RFS (T+L vs. T) | 2 | Serious | Serious | No | Serious | Undetected | 4428 | HR = 0.83 [0.72, 0.96] | Very low |
| ORR (T+L vs. T) | 4 | Serious | Serious | No | Serious | Undetected | 797 | RR = 1.02 [0.96, 1.09] | Very low |
| ORR (L vs. T) | 7 | Serious | No | No | Serious | Undetected | 2027 | RR = 0.98 [0.93, 1.03] | Low |
| DCR (L vs. T) | 3 | Serious | No | No | Serious | Undetected | 1228 | RR = 0.96 [0.90, 1.01] | Low |
| Rate of BCS (T+L vs. T) | 4 | No | No | No | Serious | Undetected | 817 | RR = 1.01 [0.88, 1.15] | Moderate |
| Rate of BCS (L vs. T) | 6 | No | No | No | Serious | Undetected | 1496 | RR = 0.94 [0.86, 1.04] | Moderate |
| CHF (T+L vs. T) | 7 | Serious | Serious | No | Serious | Undetected | 9453 | RR = 0.95 [0.73, 1.23] | Very low |
| CHF (L vs. T) | 9 | Serious | No | No | Serious | Detected | 5893 | RR = 0.89 [0.62, 1.28] | Very low |
| Decline of LVEF (T+L vs. T) | 7 | Serious | Serious | No | Serious | Undetected | 9453 | RR = 0.82 [0.67, 1.01] | Very low |
| Decline of LVEF (L vs. T) | 9 | Serious | No | No | No | Undetected | 5890 | RR = 0.67 [0.50, 0.90] | Moderate |
| Diarrhea (T+L vs. T) | 8 | Serious | Serious | No | No | Undetected | 9512 | RR = 8.32 [6.49, 10.68] | Low |
| Diarrhea (L vs. T) | 11 | Serious | Serious | No | No | Undetected | 6488 | RR = 5.62 [4.41, 7.17] | Low |
| Diarrhea (L vs. T, I-III) | 9 | Serious | No | No | No | Undetected | 5866 | RR = 7.90 [5.88, 10.62] | Moderate |
| Diarrhea (L vs. T, MBC) | 2 | Serious | No | No | Serious | Undetected | 622 | RR = 0.99 [0.46, 2.15] | Low |
| Diarrhea (L vs. T, neoadjuvant therapy) | 8 | Serious | No | No | No | Undetected | 1733 | RR = 6.97 [4.46, 10.91] | Moderate |
| Diarrhea (L vs. T, palliative therapy) | 2 | Serious | No | No | Serious | Undetected | 622 | RR = 0.99 [0.46, 2.15] | Low |
| Neutropenia (T+L vs. T) | 5 | Serious | No | No | Serious | Undetected | 906 | RR = 1.16 [0.86, 1.56] | Low |
| Neutropenia (L vs. T) | 8 | Serious | Serious | No | Serious | Undetected | 2098 | RR = 0.99 [0.89, 1.09] | Very low |
| Fatigue (T+L vs. T) | 4 | Serious | No | No | Serious | Undetected | 628 | RR = 0.84 [0.42, 1.67] | Low |
| Fatigue (L vs. T) | 6 | Serious | No | No | Serious | Undetected | 1722 | RR = 1.44 [0.97, 2.11] | Low |
| Rash/Skin toxicity (T+L vs. T) | 6 | Serious | No | No | No | Undetected | 9357 | RR = 6.75 [4.66, 9.77] | Moderate |
| Rash/Skin toxicity (L vs. T) | 5 | Serious | No | No | No | Undetected | 6352 | RR = 8.71 [5.64, 13.45] | Moderate |
| Vomiting (T+L vs. T) | 4 | Serious | No | No | Serious | Undetected | 599 | RR = 2.17 [0.91, 5.19] | Low |
| Vomiting (L vs. T) | 6 | Serious | No | No | Serious | Undetected | 1718 | RR = 1.29 [0.69, 2.43] | Low |
| Nausea (T+L vs. T) | 4 | Serious | No | No | Serious | Undetected | 599 | RR = 1.61 [0.64, 4.06] | Low |
| Nausea (L vs. T) | 6 | Serious | No | No | Serious | Detected | 1718 | RR = 1.02 [0.58, 1.80] | Very low |
Discussion
This is an updated systematic review and meta-analysis, which conclusively determined whether efficacies of trastuzumab plus lapatinib or lapatinib therapy are not inferior to trastuzumab therapy. In previous studies, Yu et al. and Clavarezza et al. [44, 45] did not compare lapatinib therapy with standard trastuzumab therapy, and the latest included studies were published in 2017. Xu et al. [46] reported the meta-analysis results among three arms (T+L, T, and L). However, this study [46] with the included RCTs from 2012 to 2015 did not include all relevant studies. Moreover, all treatment types (neoadjuvant, adjuvant, or palliative treatment) were included in this study, while it is different from the studies of Ma et al. [47] and Guarneri et al. [48], which only included the RCTs of neoadjuvant therapy. Thus, our study included all relevant RCTs, enlarged the sample size, and almost analyzed all important outcomes, which may lead to a more scientific and comprehensive meta-analysis results. Compared to previous studies, our findings basically showed no significant difference, and most results were highly similar.
This meta-analysis shows that the efficacy of trastuzumab combined with lapatinib therapy is superior to standard trastuzumab therapy alone, with a significant improvement in OS, DFS/EFS, pCR (ypT0/is ypN0), and pCR (ypT0/is ypN0/+), RFS, but has more safety risks, with a higher incidence of diarrhea and rash/skin toxicity. In addition, standard trastuzumab therapy alone was proven superior to lapatinib therapy in efficacy, with a significant improvement in OS, PFS, DFS/EFS, pCR (ypT0/is ypN0), and pCR (ypT0/is ypN0/+). With regard to safety, standard trastuzumab therapy alone had a higher incidence of LVEF decline, but had a low incidence of grade III or IV diarrhea and rash/skin toxicity, compared to lapatinib therapy alone. In previous studies, Clavarezza et al. [45] reported that trastuzumab combined with lapatinib therapy significantly increased the pCR rate, compared to trastuzumab therapy alone, in tandem with our findings. Xu et al. [46] reported that trastuzumab combined with lapatinib therapy significantly improved the pCR, EFS, and OS, but showed a higher rate of grade III/IV diarrhea, rash or erythema, and neutropenia, compared to lapatinib or trastuzumab therapy alone, which is in tandem with our findings. Ma et al. [47] reported that standard trastuzumab therapy alone plus chemotherapy was superior to chemotherapy plus lapatinib therapy in pCR (ypT0/is ypN0/+) (RR=0.82, 95% CI: 0.72–0.93) and pCR (ypT0/is ypN0) (RR=0.77, 95% CI: 0.67–0.88), while lapatinib plus trastuzumab therapy and lapatinib therapy showed no significant difference in rate of BCS compared with chemotherapy plus trastuzumab therapy, and lapatinib plus trastuzumab therapy and lapatinib therapy showed higher incidence of diarrhea and skin rash compared with chemotherapy plus trastuzumab therapy. Guarneri et al. [48] reported that trastuzumab combined with lapatinib therapy significantly improved RFS and OS, compared to standard trastuzumab therapy.
OS, PFS, and DFS/EFS are important clinical outcomes. We found that trastuzumab combined with lapatinib therapy significantly improved OS and DFS/EFS, compared to standard trastuzumab therapy alone while lapatinib plus chemotherapy had a lower efficacy in OS, PFS, and DFS/EFS, compared to standard trastuzumab therapy. Based on GRADE, evidence quality for these outcomes was generally moderate, except DFS/EFS (L vs. T), which was considered low quality. Therefore, trastuzumab plus lapatinib is a better option for increasing the survival time of patients. Although lapatinib plus trastuzumab therapy had higher pCR rates, when compared to standard trastuzumab therapy, while trastuzamab was superior to lapatinib, differences among the three kinds of anti-HER2 therapy with regard to breast-conserving rate were insignificant. Thus, we consider treatment of better pCR efficacy may have no obvious clinical meaning for patients who think highly of breast conservation. However, if patients with early breast cancer think highly of short-term efficacy, then trastuzumab combined with lapatinib may be a better choice. We also established that patients with better pCR efficacies had better long-term survival outcomes. However, it has yet to be established whether pCR is associated with long-term survival outcomes.
Trastuzumab-associated cardiac toxicities have been evaluated. Some studies reported that trastuzumab-induced cardiotoxicity might result from its negative regulation of murine double minute 2 (MDM2) and p53. Meanwhile, trastuzumab-induced cardiomyocyte apoptosis has been associated with inflammatory infiltrations. Chemokine expressions of TNFα, MCP-1 and ICAM-1 mediated by TLR4 contribute to the inflammatory responses. Lapatinib preserved cell energy and inhibited TNFα-induced cardiomyocyte apoptosis by activating the AMPK pathway [49, 50]. In this study, lapatinib showed a lower incidence of LVEF decline, compared to trastuzumab therapy, and evidence quality was moderate. Therefore, for patients with bad cardiac conditions, the efficacies of a combination of lapatinib with trastuzumab should be evaluated. With regard to other toxicities, trastuzumab had a lower incidence of grade III/IV diarrhea and rash/skin toxicity, compared to lapatinib therapy and lapatinib plus trastuzumab therapy. Mayo et al. reported that lapatinib can reduce gut microbial diversity, which may be the reason for the high incidence of diarrhea [51]. However, high incidences of rash during treatment with lapatinib and combination therapy may not be a bad thing. Amir Sonnenblick reported that patients with early development of rash derive superior benefits from lapatinib-based therapies [52]. However, reasons for the rash remain unclear. Researchers inferred that lapatinib pharmacokinetics or pharmacodynamics influenced rash development. Normal epidermal growth depends on EGFR, which is expressed on the proliferating skin [52].
In previous studies [44–48], no evidence quality assessment was performed. To determine the reliability of the meta-analysis results, GRADE was used to assess the evidence quality in this study. In long-term survival outcomes (excluding subgroup analysis results), almost all outcomes were assessed moderate quality evidence due to unclear allocation concealment of the included studies, except DFS/EFS (L vs. T) and RFS (T+L vs. T), which were assessed very low evidence quality. Thus, we supposed it was generally credible that lapatinib plus trastuzumab therapy had a better long-term efficacy, when compared to standard trastuzumab therapy, while trastuzamab was superior to lapatinib. In short-term survival outcomes, more than half of the outcomes were assessed low- or very low-quality evidence due to unclear allocation concealment of the included studies, high heterogeneity, or insufficient sample size. Although this study showed that lapatinib plus trastuzumab therapy had a better short-term efficacy, when compared to standard trastuzumab therapy, while trastuzamab was superior to lapatinib, it is still hard to make a conclusion that which therapy had a better short-term efficacy, while outcomes of rate of BCS were assessed moderate-quality evidence due to insufficient sample size. This study proved that no significant difference was found in rate of BCS among three therapies, which, we suppose, was credible. In cardiac toxicities and other toxicities (excluding subgroup analysis results), almost all outcomes were assessed low- or very low-quality evidence due to unclear allocation concealment of the included studies, high heterogeneity, insufficient sample size, or publication bias. Thus, further verification is needed to determine which therapy is safer. Overall, no outcomes had high-quality evidence, 15 outcomes had moderate-quality evidence, 14 outcomes had low-quality evidence, and 8 outcomes had very low-quality evidence. More than half of the outcomes were assessed low- or very low-quality evidence. We inferred that it was probably caused by the following reasons. First, most included studies did not design well, which caused serious risk bias. Second, insufficient sample size led to insignificant differences in some results, which caused serious imprecision. Third, publication bias and high heterogeneity downgraded the level of evidence. To upgrade the evidence quality, more well-designed long-term large sample RCTS are needed. Apart from that, more strict inclusion and exclusion criteria should be made in future studies, so that more studies with low heterogeneity can be included.
To determine the source of heterogeneity, subgroup analysis revealed subgroup effects between groups. Patients with neoadjuvant therapy were associated with longer OS, relative to patients with MBC, while patients with stage I–III breast cancer or neoadjuvant therapy had higher incidences of diarrhea than patients with MBC or palliative therapy during lapatinib treatment. Outcomes from subgroup analyses may have been affected by the instability caused by small sample sizes. We also assessed the quality of evidence and found moderate-quality evidence for OS (L vs. T, palliative therapy), diarrhea (L vs, T, I-III), and diarrhea (L vs. T, neoadjuvant therapy), and low-quality evidence for OS (L vs. T, neoadjuvant therapy), diarrhea (L vs, T, MBC), and diarrhea (L vs. T, palliative therapy), which may inform clinicians and patients when selecting treatment options.
In recent years, studies have increasingly evaluated the efficacies of dual-targeted therapy versus single-targeted therapy. It is significant for clinicians and patients to evaluate the efficacy and safety of dual and single-targeted therapy for better therapeutic selection. This study is associated with various limitations; first, most of the included studies did not clearly mention allocation concealment, which reduces the reliability of the included studies. Second, different chemotherapies in the included studies may lead to clinical heterogeneity. Third, most of the trials, apart from ALTTO, had small sample sizes. Finally, low incidences of safety events in the studies may have led to excess judgment of treatment effects. In the future, relevant, well-designed long-term large sample RCTS are needed, and more studies should assess the mechanisms of cardiac and non-cardiac toxicities of lapatinib and trastuzumab. In addition, it is of significance to determine whether pCR has any effects on long-term survival or not when lapatinib and trastuzumab are used, and whether combinations of lapatinib and trastuzumab can reduce incidences of cardiac toxicities.
Conclusions
The efficacy of trastuzumab combined with lapatinib therapy is superior to standard trastuzumab therapy alone, but has more non-cardiac grade III/IV toxicities. The efficacy of lapatinib therapy is inferior to that of standard trastuzumab therapy alone. However, the cardiac safety of lapatinib therapy is superior to that of standard trastuzumab therapy.
Supplementary Information
Additional file 1: Figure S1. Subgroup analysis of OS in accordance with tumor stage (L vs. T). Figure S2. Subgroup analysis of OS in accordance with therapy setting (T+L vs. T). Figure S3. Subgroup analysis of OS in accordance with therapy setting (L vs. T). Figure S4. Subgroup analysis of OS in accordance with hormone status (L vs. T). Figure S5. Subgroup analysis of DFS/EFS in accordance with therapy setting (T+L vs. T). Figure S6. Subgroup analysis of DFS/EFS in accordance with hormone status (T+L vs. T). Figure S7. Subgroup analysis of DFS/EFS in accordance with hormone status (L vs. T). Figure S8. Subgroup analysis of pCR(ypT0/is ypN0) in accordance with hormone status (T+L vs. T). Figure S9. Subgroup analysis of pCR(ypT0/is ypN0) in accordance with hormone status (L vs. T). Figure S10. Subgroup analysis of pCR(ypT0/is ypN0/+) in accordance with hormone status (T+L vs. T). Figure S11. Subgroup analysis of pCR(ypT0/is ypN0/+) in accordance with hormone status (L vs. T). Figure S12. Subgroup analysis of CHF in accordance with therapy setting (T+L vs. T). Figure S13. Subgroup analysis of decline of LVEF in accordance with therapy setting (T+L vs. T). Figure S14. Subgroup analysis of diarrhea in accordance with tumor stage (L vs. T). Figure S15. Subgroup analysis of diarrhea in accordance with therapy setting (T+L vs. T). Figure S16. Subgroup analysis of diarrhea in accordance with therapy setting (L vs. T). Figure S17. Subgroup analysis of neutropenia in accordance with tumor stage (L vs. T). Figure S18. Subgroup analysis of rash/skin toxicity in accordance with tumor stage (L vs. T). Figure S19. Subgroup analysis of rash/skin toxicity in accordance with therapy setting (T+L vs. T). Figure S20. Subgroup analysis of rash/skin toxicity in accordance with therapy setting (L vs. T).
Additional file 2: Figure S1. Egger’s test of OS (T+L vs. T). Figure S2. Egger’s test of OS (L vs. T). Figure S3. Egger’s test of DFS/EFS (T+L vs. T). Figure S4. Egger’s test of DFS/EFS (L vs. T).
Additional file 3: Table S1: Details of included trials
Additional file 4: Table 2: Summary of meta-analysis and subgroup analysis results
Acknowledgements
Not applicable.
Authors’ contributions
YY is the principal investigator with overall responsibility for the original draft, together with XL wrote the draft and submitted the PROSPERO registration. XL and YC performed searching for relevant studies, data collection, and data analysis. WL provided help in designing, data analysis, and editing of the manuscript. All authors read and approved the final manuscript.
Funding
Not applicable.
Availability of data and materials
The datasets generated during and/or analyzed during the current study are available in the CNKI, Wanfang, VIP, Sinomed, PubMed, Embase, and Cochrane CENTRAL databases.
Declarations
Ethics approval and consent to participate
This study does not need ethics because there is no private information of participants involved. The present study results will be disseminated to a peer-reviewed journal.
Consent for publication
Not applicable.
Competing interests
The authors declare that they have no competing interests.
Footnotes
Publisher’s Note
Springer Nature remains neutral with regard to jurisdictional claims in published maps and institutional affiliations.
Ye Yuan and Xumei Liu are co-first author.
Contributor Information
Ye Yuan, Email: 981735645@qq.con.
Xumei Liu, Email: XumeiLiu2613@163.com.
Yi Cai, Email: Cai_Yi_1984@163.com.
Wenyuan Li, Email: liwenyuan1201@163.com.
References
- 1.Siegel RL, Miller KD, Fuchs HE, Jemal A. Cancer Statistics, 2021. CA Cancer J Clin. 2021;71(1):7–33. doi: 10.3322/caac.21654. [DOI] [PubMed] [Google Scholar]
- 2.Nagini S. Breast cancer: current molecular therapeutic targets and new players. Anticancer Agents Med Chem. 2017;17(2):152–163. doi: 10.2174/1871520616666160502122724. [DOI] [PubMed] [Google Scholar]
- 3.Azamjah N, Soltan-Zadeh Y, Zayeri F. Global trend of breast cancer mortality rate: a 25-year study. Asian Pac J Cancer Prev. 2019;20(7):2015–2020. doi: 10.31557/APJCP.2019.20.7.2015. [DOI] [PMC free article] [PubMed] [Google Scholar]
- 4.Pfeiffer RM, Webb-Vargas Y, Wheeler W, Gail MH. Proportion of U.S. trends in breast cancer incidence attributable to long-term changes in risk factor distributions. Cancer Epidemiol Biomarkers Prev. 2018;27(10):1214–1222. doi: 10.1158/1055-9965.EPI-18-0098. [DOI] [PMC free article] [PubMed] [Google Scholar]
- 5.Yeo SK, Guan JL. Breast cancer: multiple subtypes within a tumor? Trends Cancer. 2017;3(11):753–760. doi: 10.1016/j.trecan.2017.09.001. [DOI] [PMC free article] [PubMed] [Google Scholar]
- 6.Albagoush SA, Limaiem F. StatPearls. Treasure Island (FL) StatPearls Publishing; 2021. HER2. 2020. [Google Scholar]
- 7.Ahn S, Woo JW, Lee K, Park SY. HER2 status in breast cancer: changes in guidelines and complicating factors for interpretation. J Pathol Transl Med. 2020;54(1):34–44. doi: 10.4132/jptm.2019.11.03. [DOI] [PMC free article] [PubMed] [Google Scholar]
- 8.Loibl S, Gianni L. HER2-positive breast cancer. Lancet. 2017;389(10087):2415–2429. doi: 10.1016/S0140-6736(16)32417-5. [DOI] [PubMed] [Google Scholar]
- 9.Oh DY, Bang YJ. HER2-targeted therapies - a role beyond breast cancer. Nat Rev Clin Oncol. 2020;17(1):33–48. doi: 10.1038/s41571-019-0268-3. [DOI] [PubMed] [Google Scholar]
- 10.Escrivá-de-Romaní S, Arumí M, Bellet M, Saura C. HER2-positive breast cancer: current and new therapeutic strategies. Breast. 2018;39:80–88. doi: 10.1016/j.breast.2018.03.006. [DOI] [PubMed] [Google Scholar]
- 11.Maximiano S, Magalhães P, Guerreiro MP, Morgado M. Trastuzumab in the treatment of breast cancer. BioDrugs. 2016;30(2):75–86. doi: 10.1007/s40259-016-0162-9. [DOI] [PubMed] [Google Scholar]
- 12.Kreutzfeldt J, Rozeboom B, Dey N, De P. The trastuzumab era: current and upcoming targeted HER2+ breast cancer therapies. Am J Cancer Res. 2020;10(4):1045–1067. [PMC free article] [PubMed] [Google Scholar]
- 13.Barish R, Gates E, Barac A. Trastuzumab-induced cardiomyopathy. Cardiol Clin. 2019;37(4):407–418. doi: 10.1016/j.ccl.2019.07.005. [DOI] [PubMed] [Google Scholar]
- 14.Greenblatt K, Khaddour K. Trastuzumab. 2021 Jul 18. In: StatPearls [Internet]. Treasure Island (FL): StatPearls Publishing; 2021 Jan–.
- 15.Cameron D, Piccart-Gebhart MJ, Gelber RD, Procter M, Goldhirsch A, de Azambuja E, et al. Herceptin Adjuvant (HERA) Trial Study Team. 11 years’ follow-up of trastuzumab after adjuvant chemotherapy in HER2-positive early breast cancer: final analysis of the HERceptin Adjuvant (HERA) trial. Lancet. 2017;389(10075):1195–1205. doi: 10.1016/S0140-6736(16)32616-2. [DOI] [PMC free article] [PubMed] [Google Scholar]
- 16.Luque-Cabal M, García-Teijido P, Fernández-Pérez Y, Sánchez-Lorenzo L, Palacio-Vázquez I. Mechanisms behind the resistance to trastuzumab in HER2-amplified breast cancer and strategies to overcome it. Clin Med Insights Oncol. 2016;10(Suppl 1):21–30. doi: 10.4137/CMO.S34537. [DOI] [PMC free article] [PubMed] [Google Scholar]
- 17.Voigtlaender M, Schneider-Merck T, Trepel M. Lapatinib. Recent Results Cancer Res. 2018;211:19–44. doi: 10.1007/978-3-319-91442-8_2. [DOI] [PubMed] [Google Scholar]
- 18.Schlam I, Swain SM. HER2-positive breast cancer and tyrosine kinase inhibitors: the time is now. NPJ Breast Cancer. 2021;7(1):56. doi: 10.1038/s41523-021-00265-1. [DOI] [PMC free article] [PubMed] [Google Scholar]
- 19.Johnston SRD, Hegg R, Im SA, Park IH, Burdaeva O, Kurteva G, et al. Phase III, randomized study of dual human epidermal growth factor receptor 2 (HER2) blockade with lapatinib plus trastuzumab in combination with an aromatase inhibitor in postmenopausal women with HER2-positive, hormone receptor-positive metastatic breast cancer: updated results of ALTERNATIVE. J Clin Oncol. 2021;39(1):79–89. doi: 10.1200/JCO.20.01894. [DOI] [PubMed] [Google Scholar]
- 20.Moreno-Aspitia A, Holmes EM, Jackisch C, de Azambuja E, Boyle F, Hillman DW, et al. ALTTO Steering Committee and Investigators. Updated results from the international phase III ALTTO trial (BIG 2-06/Alliance N063D) Eur J Cancer. 2021;148:287–296. doi: 10.1016/j.ejca.2021.01.053. [DOI] [PMC free article] [PubMed] [Google Scholar]
- 21.Guarneri V, Dieci MV, Griguolo G, Miglietta F, Girardi F, Bisagni G, et al. Trastuzumab-lapatinib as neoadjuvant therapy for HER2-positive early breast cancer: survival analyses of the CHER-Lob trial. Eur J Cancer. 2021;153:133–141. doi: 10.1016/j.ejca.2021.05.018. [DOI] [PubMed] [Google Scholar]
- 22.Hurvitz SA, Caswell-Jin JL, McNamara KL, Zoeller JJ, Bean GR, Dichmann R, et al. Pathologic and molecular responses to neoadjuvant trastuzumab and/or lapatinib from a phase II randomized trial in HER2-positive breast cancer (TRIO-US B07) Nat Commun. 2020;11(1):5824. doi: 10.1038/s41467-020-19494-2. [DOI] [PMC free article] [PubMed] [Google Scholar]
- 23.Liberati A, Altman DG, Tetzlaff J, Mulrow C, Gøtzsche PC, Ioannidis JPA, et al. The PRISMA statement for reporting systematic reviews and meta-analyses of studies that evaluate healthcare interventions: explanation and elaboration. BMJ. 2009;339:b2700. doi: 10.1136/bmj.b2700. [DOI] [PMC free article] [PubMed] [Google Scholar]
- 24.Higgins JP. Cochrane Handbook for Systematic Reviews of Interventions. Hoboken, NJ, USA: John Wiley & Sons; 2010. [Google Scholar]
- 25.Egger M, Davey Smith G, Schneider M, Minder C. Bias in meta-analysis detected by a simple, graphical test. BMJ. 1997;315(7109):629–634. doi: 10.1136/bmj.315.7109.629. [DOI] [PMC free article] [PubMed] [Google Scholar]
- 26.Piccart-Gebhart M, Holmes E, Baselga J, de Azambuja E, Dueck AC, Viale G, et al. Adjuvant lapatinib and trastuzumab for early human epidermal growth factor receptor 2-positive breast cancer: results from the randomized phase III adjuvant lapatinib and/or trastuzumab treatment optimization trial. J Clin Oncol. 2016;34(10):1034–1042. doi: 10.1200/JCO.2015.62.1797. [DOI] [PMC free article] [PubMed] [Google Scholar]
- 27.Guarneri V, Dieci MV, Frassoldati A, Maiorana A, Ficarra G, Bettelli S, et al. Prospective biomarker analysis of the randomized CHER-LOB study evaluating the dual anti-HER2 treatment with trastuzumab and lapatinib plus chemotherapy as neoadjuvant therapy for HER2-positive breast cancer. Oncologist. 2015;20(9):1001–1010. doi: 10.1634/theoncologist.2015-0138. [DOI] [PMC free article] [PubMed] [Google Scholar]
- 28.Guarneri V, Frassoldati A, Bottini A, Cagossi K, Bisagni G, Sarti S, et al. Preoperative chemotherapy plus trastuzumab, lapatinib, or both in human epidermal growth factor receptor 2-positive operable breast cancer: results of the randomized phase II CHER-LOB study. J Clin Oncol. 2012;30(16):1989–1995. doi: 10.1200/JCO.2011.39.0823. [DOI] [PubMed] [Google Scholar]
- 29.Fernandez-Martinez A, Krop IE, Hillman DW, Polley MY, Parker JS, Huebner L, et al. Survival, pathologic response, and genomics in CALGB 40601 (alliance), a neoadjuvant phase III trial of paclitaxel-trastuzumab with or without lapatinib in HER2-positive breast cancer. J Clin Oncol. 2020;38(35):4184–4193. doi: 10.1200/JCO.20.01276. [DOI] [PMC free article] [PubMed] [Google Scholar]
- 30.Carey LA, Berry DA, Cirrincione CT, Barry WT, Pitcher BN, Harris LN, et al. Molecular heterogeneity and response to neoadjuvant human epidermal growth factor receptor 2 targeting in CALGB 40601, a randomized phase III trial of paclitaxel plus trastuzumab with or without lapatinib. J Clin Oncol. 2016;34(6):542–549. doi: 10.1200/JCO.2015.62.1268. [DOI] [PMC free article] [PubMed] [Google Scholar]
- 31.Huober J, Holmes E, Baselga J, de Azambuja E, Untch M, Fumagalli D, et al. Survival outcomes of the NeoALTTO study (BIG 1-06): updated results of a randomised multicenter phase III neoadjuvant clinical trial in patients with HER2-positive primary breast cancer. Eur J Cancer. 2019;118:169–177. doi: 10.1016/j.ejca.2019.04.038. [DOI] [PubMed] [Google Scholar]
- 32.de Azambuja E, Holmes AP, Piccart-Gebhart M, Holmes E, Di Cosimo S, Swaby RF, et al. Lapatinib with trastuzumab for HER2-positive early breast cancer (NeoALTTO): survival outcomes of a randomised, open-label, multicentre, phase 3 trial and their association with pathological complete response. Lancet Oncol. 2014;15(10):1137–1146. doi: 10.1016/S1470-2045(14)70320-1. [DOI] [PubMed] [Google Scholar]
- 33.Criscitiello C, Azim HA, Jr, Agbor-tarh D, de Azambuja E, Piccart M, Baselga J, et al. Factors associated with surgical management following neoadjuvant therapy in patients with primary HER2-positive breast cancer: results from the NeoALTTO phase III trial. Ann Oncol. 2013;24(8):1980–1985. doi: 10.1093/annonc/mdt129. [DOI] [PubMed] [Google Scholar]
- 34.Baselga J, Bradbury I, Eidtmann H, Di Cosimo S, de Azambuja E, Aura C, et al. NeoALTTO Study Team. Lapatinib with trastuzumab for HER2-positive early breast cancer (NeoALTTO): a randomised, open-label, multicentre, phase 3 trial. Lancet. 2012;379(9816):633–640. doi: 10.1016/S0140-6736(11)61847-3. [DOI] [PMC free article] [PubMed] [Google Scholar]
- 35.Untch M, von Minckwitz G, Gerber B, Schem C, Rezai M, Fasching PA, et al. Survival analysis after neoadjuvant chemotherapy with trastuzumab or lapatinib in patients with human epidermal growth factor receptor 2-positive breast cancer in the GeparQuinto (G5) study (GBG 44) J Clin Oncol. 2018;36(13):1308–1316. doi: 10.1200/JCO.2017.75.9175. [DOI] [PubMed] [Google Scholar]
- 36.Untch M, Loibl S, Bischoff J, Eidtmann H, Kaufmann M, Blohmer JU, et al. Lapatinib versus trastuzumab in combination with neoadjuvant anthracycline-taxane-based chemotherapy (GeparQuinto, GBG 44): a randomised phase 3 trial. Lancet Oncol. 2012;13(2):135–144. doi: 10.1016/S1470-2045(11)70397-7. [DOI] [PubMed] [Google Scholar]
- 37.Takano T, Tsurutani J, Takahashi M, Yamanaka T, Sakai K, Ito Y, et al. A randomized phase II trial of trastuzumab plus capecitabine versus lapatinib plus capecitabine in patients with HER2-positive metastatic breast cancer previously treated with trastuzumab and taxanes: WJOG6110B/ELTOP. Breast. 2018;40:67–75. doi: 10.1016/j.breast.2018.04.010. [DOI] [PubMed] [Google Scholar]
- 38.Pivot X, Manikhas A, Żurawski B, Chmielowska E, Karaszewska B, Allerton R, et al. CEREBEL (EGF111438): a phase III, randomized, open-label study of lapatinib plus capecitabine versus trastuzumab plus capecitabine in patients with human epidermal growth factor receptor 2-positive metastatic breast cancer. J Clin Oncol. 2015;33(14):1564–1573. doi: 10.1200/JCO.2014.57.1794. [DOI] [PubMed] [Google Scholar]
- 39.Gelmon KA, Boyle FM, Kaufman B, Huntsman DG, Manikhas A, Di Leo A, et al. Lapatinib or trastuzumab plus taxane therapy for human epidermal growth factor receptor 2-positive advanced breast cancer: final results of NCIC CTG MA.31. J Clin Oncol. 2015;33(14):1574–1583. doi: 10.1200/JCO.2014.56.9590. [DOI] [PubMed] [Google Scholar]
- 40.Bonnefoi H, Jacot W, Saghatchian M, Moldovan C, Venat-Bouvet L, Zaman K, et al. Neoadjuvant treatment with docetaxel plus lapatinib, trastuzumab, or both followed by an anthracycline-based chemotherapy in HER2-positive breast cancer: results of the randomised phase II EORTC 10054 study. Ann Oncol. 2015;26(2):325–332. doi: 10.1093/annonc/mdu551. [DOI] [PMC free article] [PubMed] [Google Scholar]
- 41.Alba E, Albanell J, de la Haba J, Barnadas A, Calvo L, Sánchez-Rovira P, et al. Trastuzumab or lapatinib with standard chemotherapy for HER2-positive breast cancer: results from the GEICAM/2006-14 trial. Br J Cancer. 2014;110(5):1139–1147. doi: 10.1038/bjc.2013.831. [DOI] [PMC free article] [PubMed] [Google Scholar]
- 42.Robidoux A, Tang G, Rastogi P, Geyer CE, Jr, Azar CA, Atkins JN, et al. Lapatinib as a component of neoadjuvant therapy for HER2-positive operable breast cancer (NSABP protocol B-41): an open-label, randomised phase 3 trial. Lancet Oncol. 2013;14(12):1183–1192. doi: 10.1016/S1470-2045(13)70411-X. [DOI] [PubMed] [Google Scholar]
- 43.Holmes FA, Espina V, Liotta LA, Nagarwala YM, Danso M, McIntyre KJ, et al. Pathologic complete response after preoperative anti-HER2 therapy correlates with alterations in PTEN, FOXO, phosphorylated Stat5, and autophagy protein signaling. BMC Res Notes. 2013;5(6):507. doi: 10.1186/1756-0500-6-507. [DOI] [PMC free article] [PubMed] [Google Scholar]
- 44.Yu L, Fu F, Li J, Huang M, Zeng B, Lin Y, et al. Dual HER2 blockade versus a single agent in trastuzumab-containing regimens for HER2-positive early breast cancer: a systematic review and meta-analysis of randomized controlled trials. J Oncol. 2020;16(2020):5169278. doi: 10.1155/2020/5169278. [DOI] [PMC free article] [PubMed] [Google Scholar]
- 45.Clavarezza M, Puntoni M, Gennari A, Paleari L, Provinciali N, D'Amico M, et al. Dual block with lapatinib and trastuzumab versus single-agent trastuzumab combined with chemotherapy as neoadjuvant treatment of HER2-positive breast cancer: a meta-analysis of randomized trials. Clin Cancer Res. 2016;22(18):4594–4603. doi: 10.1158/1078-0432.CCR-15-1881. [DOI] [PubMed] [Google Scholar]
- 46.Xu ZQ, Zhang Y, Li N, Liu PJ, Gao L, Gao X, et al. Efficacy and safety of lapatinib and trastuzumab for HER2-positive breast cancer: a systematic review and meta-analysis of randomised controlled trials. BMJ Open. 2017;7(3):e013053. doi: 10.1136/bmjopen-2016-013053. [DOI] [PMC free article] [PubMed] [Google Scholar]
- 47.Ma W, Zhao F, Zhou C, Zhang Y, Zhao Y, Li N, et al. Targeted neoadjuvant therapy in the HER-2-positive breast cancer patients: a systematic review and meta-analysis. Onco Targets Ther. 2019;3(12):379–390. doi: 10.2147/OTT.S183304. [DOI] [PMC free article] [PubMed] [Google Scholar]
- 48.Guarneri V, Griguolo G, Miglietta F, Conte PF, Dieci MV, Girardi F. Survival after neoadjuvant therapy with trastuzumab-lapatinib and chemotherapy in patients with HER2-positive early breast cancer: a meta-analysis of randomized trials. ESMO Open. 2022;7(2):100433. doi: 10.1016/j.esmoop.2022.100433. [DOI] [PMC free article] [PubMed] [Google Scholar]
- 49.Ma W, Wei S, Zhang B, Li W. Molecular Mechanisms of Cardiomyocyte Death in Drug-Induced Cardiotoxicity. Front Cell Dev Biol. 2020;3(8):434. doi: 10.3389/fcell.2020.00434. [DOI] [PMC free article] [PubMed] [Google Scholar]
- 50.Leemasawat K, Phrommintikul A, Chattipakorn SC, Chattipakorn N. Mechanisms and potential interventions associated with the cardiotoxicity of ErbB2-targeted drugs: Insights from in vitro, in vivo, and clinical studies in breast cancer patients. Cell Mol Life Sci. 2020;77(8):1571–1589. doi: 10.1007/s00018-019-03340-w. [DOI] [PMC free article] [PubMed] [Google Scholar]
- 51.Mayo BJ, Secombe KR, Wignall AD, Bateman E, Thorpe D, Pietra C, et al. The GLP-2 analogue elsiglutide reduces diarrhoea caused by the tyrosine kinase inhibitor lapatinib in rats. Cancer Chemother Pharmacol. 2020;85(4):793–803. doi: 10.1007/s00280-020-04040-0. [DOI] [PubMed] [Google Scholar]
- 52.Sonnenblick A, de Azambuja E, Agbor-Tarh D, Bradbury I, Campbell C, Huang Y, et al. Lapatinib-related rash and breast cancer outcome in the ALTTO phase III randomized trial. J Natl Cancer Inst. 2016;108(8):djw037. doi: 10.1093/jnci/djw037. [DOI] [PMC free article] [PubMed] [Google Scholar]
Associated Data
This section collects any data citations, data availability statements, or supplementary materials included in this article.
Supplementary Materials
Additional file 1: Figure S1. Subgroup analysis of OS in accordance with tumor stage (L vs. T). Figure S2. Subgroup analysis of OS in accordance with therapy setting (T+L vs. T). Figure S3. Subgroup analysis of OS in accordance with therapy setting (L vs. T). Figure S4. Subgroup analysis of OS in accordance with hormone status (L vs. T). Figure S5. Subgroup analysis of DFS/EFS in accordance with therapy setting (T+L vs. T). Figure S6. Subgroup analysis of DFS/EFS in accordance with hormone status (T+L vs. T). Figure S7. Subgroup analysis of DFS/EFS in accordance with hormone status (L vs. T). Figure S8. Subgroup analysis of pCR(ypT0/is ypN0) in accordance with hormone status (T+L vs. T). Figure S9. Subgroup analysis of pCR(ypT0/is ypN0) in accordance with hormone status (L vs. T). Figure S10. Subgroup analysis of pCR(ypT0/is ypN0/+) in accordance with hormone status (T+L vs. T). Figure S11. Subgroup analysis of pCR(ypT0/is ypN0/+) in accordance with hormone status (L vs. T). Figure S12. Subgroup analysis of CHF in accordance with therapy setting (T+L vs. T). Figure S13. Subgroup analysis of decline of LVEF in accordance with therapy setting (T+L vs. T). Figure S14. Subgroup analysis of diarrhea in accordance with tumor stage (L vs. T). Figure S15. Subgroup analysis of diarrhea in accordance with therapy setting (T+L vs. T). Figure S16. Subgroup analysis of diarrhea in accordance with therapy setting (L vs. T). Figure S17. Subgroup analysis of neutropenia in accordance with tumor stage (L vs. T). Figure S18. Subgroup analysis of rash/skin toxicity in accordance with tumor stage (L vs. T). Figure S19. Subgroup analysis of rash/skin toxicity in accordance with therapy setting (T+L vs. T). Figure S20. Subgroup analysis of rash/skin toxicity in accordance with therapy setting (L vs. T).
Additional file 2: Figure S1. Egger’s test of OS (T+L vs. T). Figure S2. Egger’s test of OS (L vs. T). Figure S3. Egger’s test of DFS/EFS (T+L vs. T). Figure S4. Egger’s test of DFS/EFS (L vs. T).
Additional file 3: Table S1: Details of included trials
Additional file 4: Table 2: Summary of meta-analysis and subgroup analysis results
Data Availability Statement
The datasets generated during and/or analyzed during the current study are available in the CNKI, Wanfang, VIP, Sinomed, PubMed, Embase, and Cochrane CENTRAL databases.