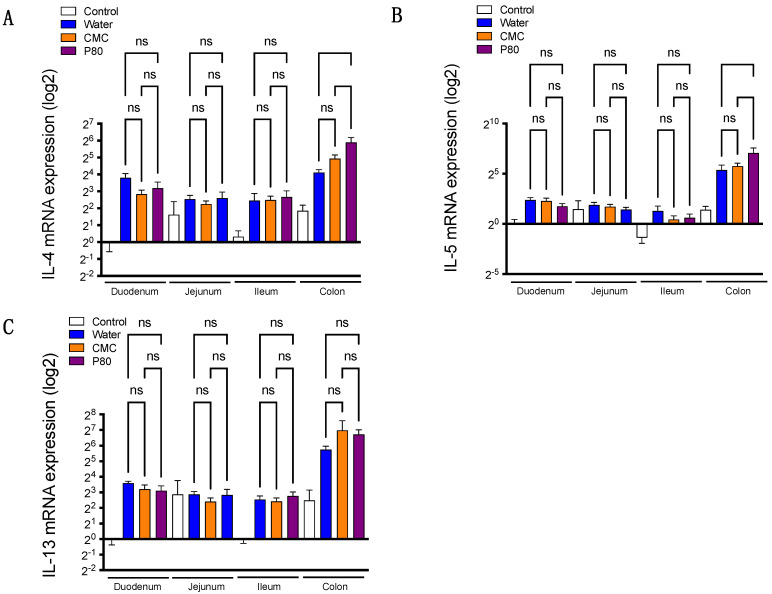
Figure 2.
(A–C) The mRNA expression for IL-4, IL-5, and IL-13 in duodenum, jejunum, ileum, and colon by using quantitative PCR. The white bar represents the control group without food allergy induction; the blue bar represents the food allergy-induced group treated with water (no dietary emulsifier treatment); orange bar represents CMC treated group; the purple bar represents P80 treated group. (n = 5, Control; n = 10, Water; n = 9, CMC; n = 9, P80). One-way ANOVA and Tukey’s Multiple Comparison Test were used to determine significance. Data are the means ± SEM. ns, not significant.

