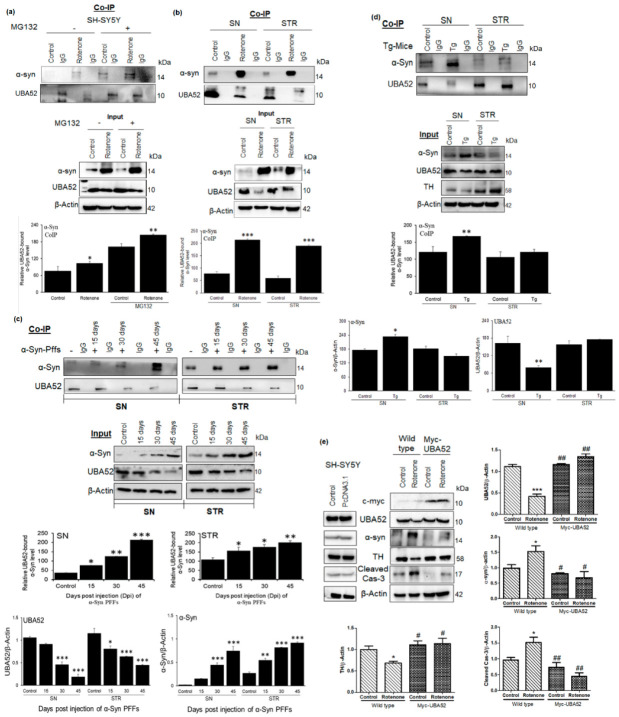
Figure 2.
UBA52 interacts with α-Syn, and its over-expression in SH-SY5Y cells deter the alteration in PD markers protein abundance, preventing the disease onset. Co-IP (Protein A Sepharose beads attached to the anti-UBA52 antibody/anti-IgG antibody) was performed, and the cell or tissue lysates were incubated with the antibody-beads complex, following which the beads were boiled with 2X-reducing buffer, centrifuged and the supernatant was resolved on a 4–16% gradient SDS-PAGE to detect the interacting proteins. (a,b) Representative images and analysis depicting the in vitro interaction of UBA52 and α-syn, against IgG as a negative control in SH-SY5Y cells with or without rotenone& MG132 treatment; and control& rotenone treated PD-related SN and STR region, respectively; rats used per group in each replicate = 4; nexp = 4. (c) Representative image and analysis depicting the Co-IP experiment to check the interaction of UBA52 and α-Syn, against IgG as a negative control in PBS-administered control& mouse recombinant α-Syn PFF treated PD-related SN and STR region, respectively at 15-, 30- and 45-days post-injection (dpi) to show the underlying mechanism of UBA52 in regulating α-Syn abundance; rats used per group per replicate = 5; nexp = 3. (d) Representative image and analysis depicting the Co-IP experiment to check the interaction of UBA52 and α-Syn, against IgG as a negative control in the PD-related SN and STR region of the control C57BL mice and the C57BL/6J-Tg (Th-SNCA*A30P*A53T) 39Eric/J transgenic (Tg) mice, respectively; mice used per group per replicate = 5; nexp = 2. (e) PcDNA3.1 or Myc-UBA52 transfected SH-SY5Y cells with or without rotenone treatment were immunoblotted for PD-related protein markers; nexp = 3. Quantification is the mean and SEM of at least three independent experiments, and statistical analysis was performed using two-way ANOVA, followed by Tukey’s multiple comparison test. * p < 0.05, ** p < 0.01, *** p < 0.001 control vs. Rotenone/αSyn PFFs/Transgenic (Tg); # p < 0.05, ## p < 0.01.

