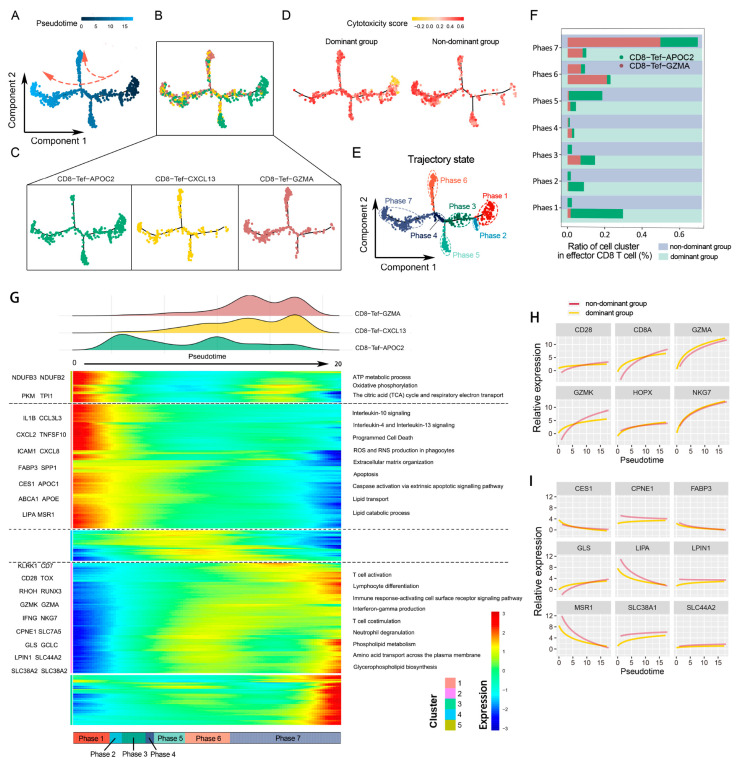
Figure 5.
Differentiation directions of Tef subsets under different glutamine metabolic stress. (A) Pseudotime-ordered analysis of Tef cells. Arrows indicate direction of development. (B,C) Trajectory trees showing the distribution of Tef cell subtypes along the developmental trajectories. T cell subtypes are labeled by color: CD8-Tef-GZMA is colored with brown, CD8-Tef-CXCL13 with yellow, and CD8-Tef-APOC2 with green. (D) 2D pseudotime plot showing the dynamics of cytotoxic score of Tef cells in the dominant group and nondominant group. (E) 2D graph of pseudotime-ordered Tef cells. The trajectory state is labeled by color. (F) Histogram showing the cell distributions of CD8-Tef-GZMA and CD8-Tef-APOC2 over 7 phases between the dominant group and nondominant group. Tef subtypes are labeled by colors. (G) Heatmap showing the dynamic changes in gene expression along pseudotime. Representative genes of clusters 1, 2, and 5 are listed to the left of the heatmap. The DEGs of this heatmap are listed in Supplementary Table S8. Immune-regulation-related and metabolism-related pathways are marked to the right of the heatmap. Enriched pathways (GO and REACTOME) of the three clusters are listed in Supplementary Table S9. (H,I) Two-dimensional plots showing the dynamic expressions of metabolism-associated genes (I) and immune-associated genes (H) during Tef cell transitions along pseudotime.

