

Abstract
Background:
Exposure to ethanol during pregnancy is the cause of fetal alcohol spectrum disorder. The function of L1 cell adhesion molecule (L1), critical for proper brain development, is dependent on detergent-resistant membrane microdomains (DRM). Ethanol at low concentrations disrupts L1 function measured by inhibition of downstream signaling and alterations in L1-DRM distribution in cerebellum in vivo and in cerebellar granule neurons (CGN) in vitro. We have previously shown that choline pretreatment of CGN partially prevents ethanol toxicity through improving L1 function in vitro. Here we show that choline supplementation reduces the impact of ethanol on L1 in cerebellum in vivo.
Methods:
Pregnant rat dams were placed on choline free diet on gestational day 5 (G5). Pups were treated with saline or choline from postnatal day (P) 1–5. On P5, pups were intubated twice 2 h apart with ethanol or Intralipid® for a total dose of 6 g/kg/d and sacrificed 1 h after the last intubation. The cerebella were harvested and L1 phosphorylation/dephosphorylation status and distribution in DRM were analyzed.
Results:
Ethanol reduced L1 tyrosine phosphorylation and L1-Y1176 dephosphorylation in cerebella, and caused an increase in the percent of L1 in DRM. Choline supplementation of pups reduced the ethanol-induced changes in L1 phosphorylation status and ameliorated ethanol-induced redistribution of L1 into DRM.
Conclusion:
Choline supplementation before an acute dose of ethanol ameliorates changes in L1 in vivo.
Keywords: L1 cell adhesion molecule, fetal alcohol spectrum disorder, choline, ethanol, lipid rafts, detergent-resistant membranes, signal transduction
Introduction
Drinking alcohol during pregnancy can result in a number of physical, neurological and mental effects that range in severity. These effects fall under the term Fetal Alcohol Spectrum Disorder (FASD). It is estimated to affect 10–50 per 1000 live births in the US and some European countries.(P A May et al., 2018; Philip A May et al., 2009) The incidence of Fetal Alcohol Syndrome (FAS), the most severe manifestation of FASD, may be as high as 68.0 – 89.2 per 1000 live births to heavily drinking pregnant women in South Africa.(P A May et al., 2007) In three states, it has been reported to be at 3 per 1,000 live births.(Miller & Tolliver, 2002) In comparison, the incidence of two other common causes of intellectual disability, Down’s Syndrome and Fragile X, have incidences of 2.2/1,000 and 0.09/1,000 of all births respectively.(de Graaf, Buckley, Dever, & Skotko, 2017; Hunter et al., 2014; Loane et al., 2013) Thus, FAS is the most common cause of intellectual disability and is 100% preventable.
The severity of FASD symptoms varies, with some children experiencing symptoms to a far greater degree than others. Signs and symptoms of FASD may include a mix of physical defects, intellectual or cognitive disabilities, and problems with daily functioning. There is no cure for FASD, but research shows that early intervention treatment can improve the development of a child with FASD.(Paley & O’Connor, 2011) Children and adults with FASD have cerebellar dysfunction (gait, postural balance, motor coordination and eyeblink conditioning).(Connor, Sampson, Streissguth, Bookstein, & Barr, 2006; Jirikowic et al., 2013; Lubetzky-Vilnai, Jirikowic, & McCoy, 2011; Spottiswoode et al., 2011) Therefore, there is a need for greater understanding of the mechanisms by which prenatal ethanol exposure results in cerebellar dysfunction. The cerebellum develops during the third trimester of pregnancy for a human; the equivalent time in the rat is the end of the gestation period and the first two weeks of postnatal development.(Altman, 1982)
Children who are born with FASD develop birth defects similar to those seen in children with mutations involving the L1 cell adhesion molecule (L1).(Bearer, 2001; Ramanathan, Wilkemeyer, Mittal, Perides, & Charness, 1996) L1 is a transmembrane glycoprotein with an extracellular domain containing a homophilic binding site.(Moos et al., 1988) L1 can bind to the extracellular domain of L1 on a neighboring neuron or to L1 bound to the extracellular matrix. This binding results in the clustering of L1 that triggers a signal cascade and protein trafficking leading to enhanced neurite outgrowth. The signal cascade consists of activation of Src kinase, followed by tyrosine phosphorylation of L1, then dephosphorylation of the specific tyrosine Y1176 of L1 and activation of ERK1/2.(Yeaney et al., 2009) Inhibition of the dephosphoryatiion of Y1176-L1 or tyrosine phosphorylation of L1 results in inhibition of L1 mediated neurite outgrowth.(Schmid, Pruitt, & Maness, 2000) Uninhibited, this chain of reactions ensures formation of functional nerve tracts. Ethanol has been shown to inhibit L1 to L1 cell adhesion and L1 mediated neurite outgrowth.(Bearer, Swick, O’Riordan, & Cheng, 1999; Charness, Safran, & Perides, 1994; Ramanathan et al., 1996) Our previous study demonstrates that the functions of L1 depend on intact detergent-resistant membrane microdomains (DRM, also referred to as lipid rafts).(Tang et al., 2011) Using a rat pup model, we have previously shown that ethanol affects the phosphorylation status of L1 with a decrease in dephosphorylated Y1176 and a decrease in the overall tyrosine phosphorylation of L1 in the cerebellum. In addition, the proportion of L1 in DRM of the cerebellum was increased.(Littner, Tang, He, & Bearer, 2013)
Choline is an essential nutrient that ameliorates biochemical effects of ethanol in vitro (Tang et al., 2014) and behavioral effects of ethanol in vivo.(Bearer, Wellmann, Tang, He, & Mooney, 2015; Ryan, Williams, & Thomas, 2008; Thomas, Abou, & Dominguez, 2009; Thomas, Biane, O’Bryan, O’Neill, & Dominguez, 2007; Thomas, Idrus, Monk, & Dominguez, 2010; Thomas, La Fiette, Quinn, & Riley, 2000; Thomas & Tran, 2012) Our objective was to determine if choline supplementation would ameliorate the ethanol induced decrease in L1-Y1176 dephosphorylation, the decrease in L1 tyrosine phosphorylation and the increase in the percent of L1 associated with DRM in cerebella in vivo using a rat pup model.
Materials and methods
Antibodies
Horseradish peroxidase-conjugated cholera toxin B subunits were obtained from Sigma-Aldrich (St Louis, MO, USA). Mouse monoclonal anti-transferrin receptor antibody was from Invitrogen (Carlsbad, CA, USA). Goat polyclonal anti-neural cell adhesion molecule L1 cytoplasmic domain (anti-L1CD) was from Santa Cruz Biotechnology (Santa Cruz, CA, USA). The mouse monoclonal antibody 74-5H7 that recognizes dephosphorylated Y1176 on the cytoplasmic tail of L1 was previously described (Schaefer et al., 2002). Monoclonal antibody to phosphotyrosine (PY-100) was obtained from Cell Signaling (Danvers, MA, USA). Polyclonal antibody to beta actin was obtained from ThermoFisher Scientific (Waltham, MA, USA). All secondary antibodies for immunoblot analysis were from Jackson Immuno Research Laboratories (West Grove, PA, USA).
Animals
Timed pregnant Sprague Dawley rat dams were obtained on gestational day (G) 5 from Harlan Laboratories (Indianapolis, IN, USA) and maintained in an AAALAC accredited facility at the University of Maryland School of Medicine. Prior to arrival at the University of Maryland, the rats were kept on a diet of standard rat chow. All procedures were performed with prior approval of the Institutional Animal Care and Use Committee at the University of Maryland, Baltimore (AUP 0212002) and were in accordance with guidelines for animal care established by the National Institutes of Health. A total of 7 pregnant rats were obtained.
Pregnant dams received diets without choline (Diet #718755, Dyets In, Bethlehem, PA, USA) starting on G5. Newborn rat pups were divided initially into 3 groups: a handled only control group (Con), a group injected subcutaneously with 1.88 mg/d choline (Thomas, Garrison, & O’Neill, 2004)(C), and a group injected with an equal volume of saline (S). Injections were given daily on postnatal days (P) 1–5. Pups were weighted daily to determine appropriate dose (n, (M/F): Con = 6 (3/3), S = 12(6/6), C = 12 (6/6)). On P5, pups from the C and S treatment groups were orogastrically gavaged twice 2 hours apart to receive a total dose of 6 g/kg ethanol in intralipid® (E) (Thomas et al., 2004) or intralipid® made isocaloric by the addition of maltose-dextrin (I), resulting in 5 treatment groups: Con, SI, SE, CI, and CE. The blood alcohol concentrations (mean +/− SD) in the animals 2 hours after the second dose of ethanol were 577 +/− 180 mg/dL.(Littner et al., 2013) On P5, pups were weighed and received their injections, followed by gavage. Pups were decapitated into liquid nitrogen 1 h after the second gavage and stored at −80°C. The cerebella of half the pups in each group (Con, CI, CE, SI, SE) were analyzed for L1 phosphorylation status, and half analyzed for L1 distribution in lipid rafts (Con = 3 (2/1), SI = 3 (1/2), SE = 3 (1/2), CI 3 (2/1), CE = 3 (2/1) for phosphorylation, Con = 3 (1/2), SI = 3 (2/1), SE = 3 (2/1), CI (1/2), CE = 3 (1/2) for lipid raft distribution).
Tissue Preparation
Each cerebellum was homogenized in ice cold Tris-buffered saline containing 1% Triton X100, 10 μM sodium vanadate, 2 μM aprotinin, 100 pM cypermethrin, phosphatase inhibitor cocktail I (Sigma-Aldrich), and phosphatase inhibitor cocktail II (Sigma-Aldrich). Homogenates were kept on ice for 30 min and then centrifuged at 13,000g for 10 minutes at 4°C, and supernatants were collected. Protein was determined using the BCA Protein Assay Kit (ThermoFisher Scientific, Waltham, MA, USA)
Immunoprecipitation
Supernatants containing equal amounts of protein were pre-cleared of nonspecific proteins and endogenous Ig by incubation with rabbit serum at 4°C for 1 h, and then mixed with a 30% slurry of protein A/G agarose (ThermoFisher Scientific, Waltham, MA, USA) for 1 hour. Two μg anti-L1CD antibody and 30 μg protein A/G agarose beads were added to the cleared supernatants and incubated overnight at 4°C. Non-specific binding was assessed by addition of Goat IgG followed by agarose beads. The beads were washed 3 times with phosphate buffered saline and samples were eluted from the beads by reducing in dithiothreitol (100 mM, Sigma-Aldrich) and boiling for 5 min. The sample buffer containing the immunoprecipitates was collected by centrifugation of 1,000g for 4 minutes and analyzed by immunoblot.
DRM Isolation
All procedures were carried out on ice and all buffers were kept at 4°C for the duration of the procedure. One ml of supernatant was mixed with an equal amount of 80% sucrose solution and placed in a 12 ml ultracentrifuge tube. A discontinuous 5–35-40% sucrose gradient was formed by layering 4 ml of 35% (w/v) sucrose solution on top of the 2 ml homogenate, followed by 4 ml 5% (w/v) sucrose solution. The samples were centrifuged at 180,000×g for 24 hours at 4°C in a Beckman SW41 rotor. Ten 1 ml fractions were collected from the top of each gradient. An aliquot from each fraction was analyzed by immunoblot analysis for the presence of GM1 ganglioside. All fractions containing GM1 ganglioside were combined into a DRM containing pool. All remaining fractions were combined in a non-DRM (N) pool.
Immunoblotting
Samples were mixed with lithium dodecyl sulfate sample buffer (Invitrogen, Grand Island, NY, USA) and boiled for 5 minutes. Boiled samples were electrophoresed in 4–15% sodium dodecyl sulfate-polyacrylamide gel electrophoresis (SDS-PAGE) and then transferred to a polyvinylidene difluoride membrane. The membranes were blocked for 1 h with 5% nonfat milk and then incubated with a primary antibody overnight at 4°C. Blots were incubated in a horseradish peroxidase-conjugated secondary antibody against the primary at room temperature for 1 h. The blots were developed using the enhanced chemiluminescence system (GE Healthcare, Piscataway, NJ, USA) and visualized using Fluorchem HD2 imaging system (Alpha Innotech, Santa Clara, CA, USA). Where indicated, membranes were stripped and re-blotted for L1 or beta actin to confirm equal loading and to detect changes in L1 expression under the different treatment conditions. Densitometry was performed using the NIH image J program (National Institutes of Health, Bethesda, MD, USA) to quantitate optical density to calculate percent of L1 phosphorylated or dephosphorylated or proportion of L1 in lipid rafts.
Statistical Analysis
To assess changes in the amount of L1 in each condition, pixels in the L1 band were divided by the pixels in the beta actin band. For the proportion of L1 with tyrosine phosphorylation or dephosphorylation, the pixels in either the phosphorylated or the dephosphorylated L1 band were divided by the pixels in the L1 band. Each blot was normalized to the control condition (PY100x/L1x)/(PY100con/L1con) or (L1–1176x/L1x)/L1–1176con/L1con). The results were expressed as mean ± standard error of the mean (SEM) using Microsoft Excel software (Redmond, WA, USA). For percent of L1 in DRM, pixels in the DRM band were divided by the sum of the pixels in both the DRM and N bands and multiplied by 100. One-way ANOVA was performed to assess for differences in subject weights over time. Two-way ANOVA was used to determine the effect of ethanol exposure, choline exposure, and the interaction of ethanol and choline exposure on L1 amount and phosphorylation. Post-hoc analysis was performed using the Tukey Test. Statistical analysis was performed using SAS 9.3 software (Cary, NC).
Results
Choline administration improved weight gain of pups compared to saline treated animals.
As shown in Figure 1, although there was no significant difference in initial weights (p=0.38, F-ratio=1), pups who received either saline (n=12) or choline (n=12) injections were significantly lighter by day 5 than control animals (n=6) who were handled only, indicating the increase in stress of those pups receiving injections. The reduction in weight gain was apparent and persistent by day 2 (p=0.0008, F-ratio 9.6) in the saline group vs. controls. However, a reduction in weight gain was not apparent until day 3 in the choline group vs. controls (p=0.002, F-ratio=15.2). On the day of sacrifice (P5), the choline group was significantly lighter than the control group (p<0.0001) and the saline group was significantly lighter than the choline group (p=0.012) (Model F-ratio=43.7).
Figure 1. Choline supplementation improves weight gain of rat pups.

Growth curves of pups from postnatal Day 1 to 5 prior to ethanol administration. Significant differences determined by post-hoc Tukey Test denoted by: (#) for Control vs. Saline, (*) for Control vs. Choline, (+) for Choline vs. Saline. There were no significant differences in weights between the three treatment groups on Day 1. Pups receiving saline injections were significantly lighter than the Control group by Day 2 (p=0.0008), while those receiving choline were not significantly lighter than Controls until Day 3 (p=0.0016).
Choline ameliorates the ethanol suppression of dephosphorylated tyrosine Y1176 of L1.
No treatment affected the amount of L1 in the cerebella (Figure 2) (Model F-Ratio 0.15, p=0.9305). No difference existed in the proportion of Y1176 dephosphorylated L1 between control animals (Con) and saline injected/intralipid gavaged animals (SI) (p=0.467), and these two groups were combined for further comparisons with ethanol and choline. As shown in Figure 3, the proportion of dephosphorylated Y1176 is significantly reduced in animals that received saline/ethanol (SE) compared to control and saline injected/intralipid gavaged animals (Con and SI) (p=0.0001, Cohen’s D=6.6). In animals receiving choline from P1 – 5, and intralipid on P5 (CI), the proportion of L1 dephosphorylated Y1176 was not different from Con and SI animals (p=0.7767, Cohen’s D=0.7). In animals treated with both choline and ethanol (CE), the proportion of dephosphorylated Y1176 in L1 increased significantly compared to the SE animals (p=0.0154, Cohen’s D=2.3), and returned to similar levels as the CI animals (p=0.525, Cohen’s D=0.8) and Con/SI animals (p=0.103, Cohen’s D=1.6). F-ratio for the 2-way ANOVA model was 16.5 (p=0.0002).
Figure 2. L1 expression in cerebella is the same regardless of treatment group.

A) Representative immunoblot of L1 from cerebella of rat pups under the 5 treatment conditions. The blot shows two bands, the 220 kD band representing the full length form of L1, and the 80 kD band representing the cleaved transmembrane-intracellular domain. By convention, the 80 kD band is used to quantify L1 due to the difficulty in transferring the full length L1. B) Representative immunoblot of β–actin from cerebella of rat pups under the 5 treatment groups. The blot shows a single band at 42 kD representing β–actin. C) Bar Graph: Mean +/− SEM of the ratio of total L1 to β–actin (n=3 pups per treatment group from 3 different litters). There was no significant difference using ANOVA with (p=0.97469) or without (p=0.94669) the control group.
Figure 3. Choline supplementation ameliorates the reduction of dephosphorylated L1-Y1176 by ethanol in vivo.
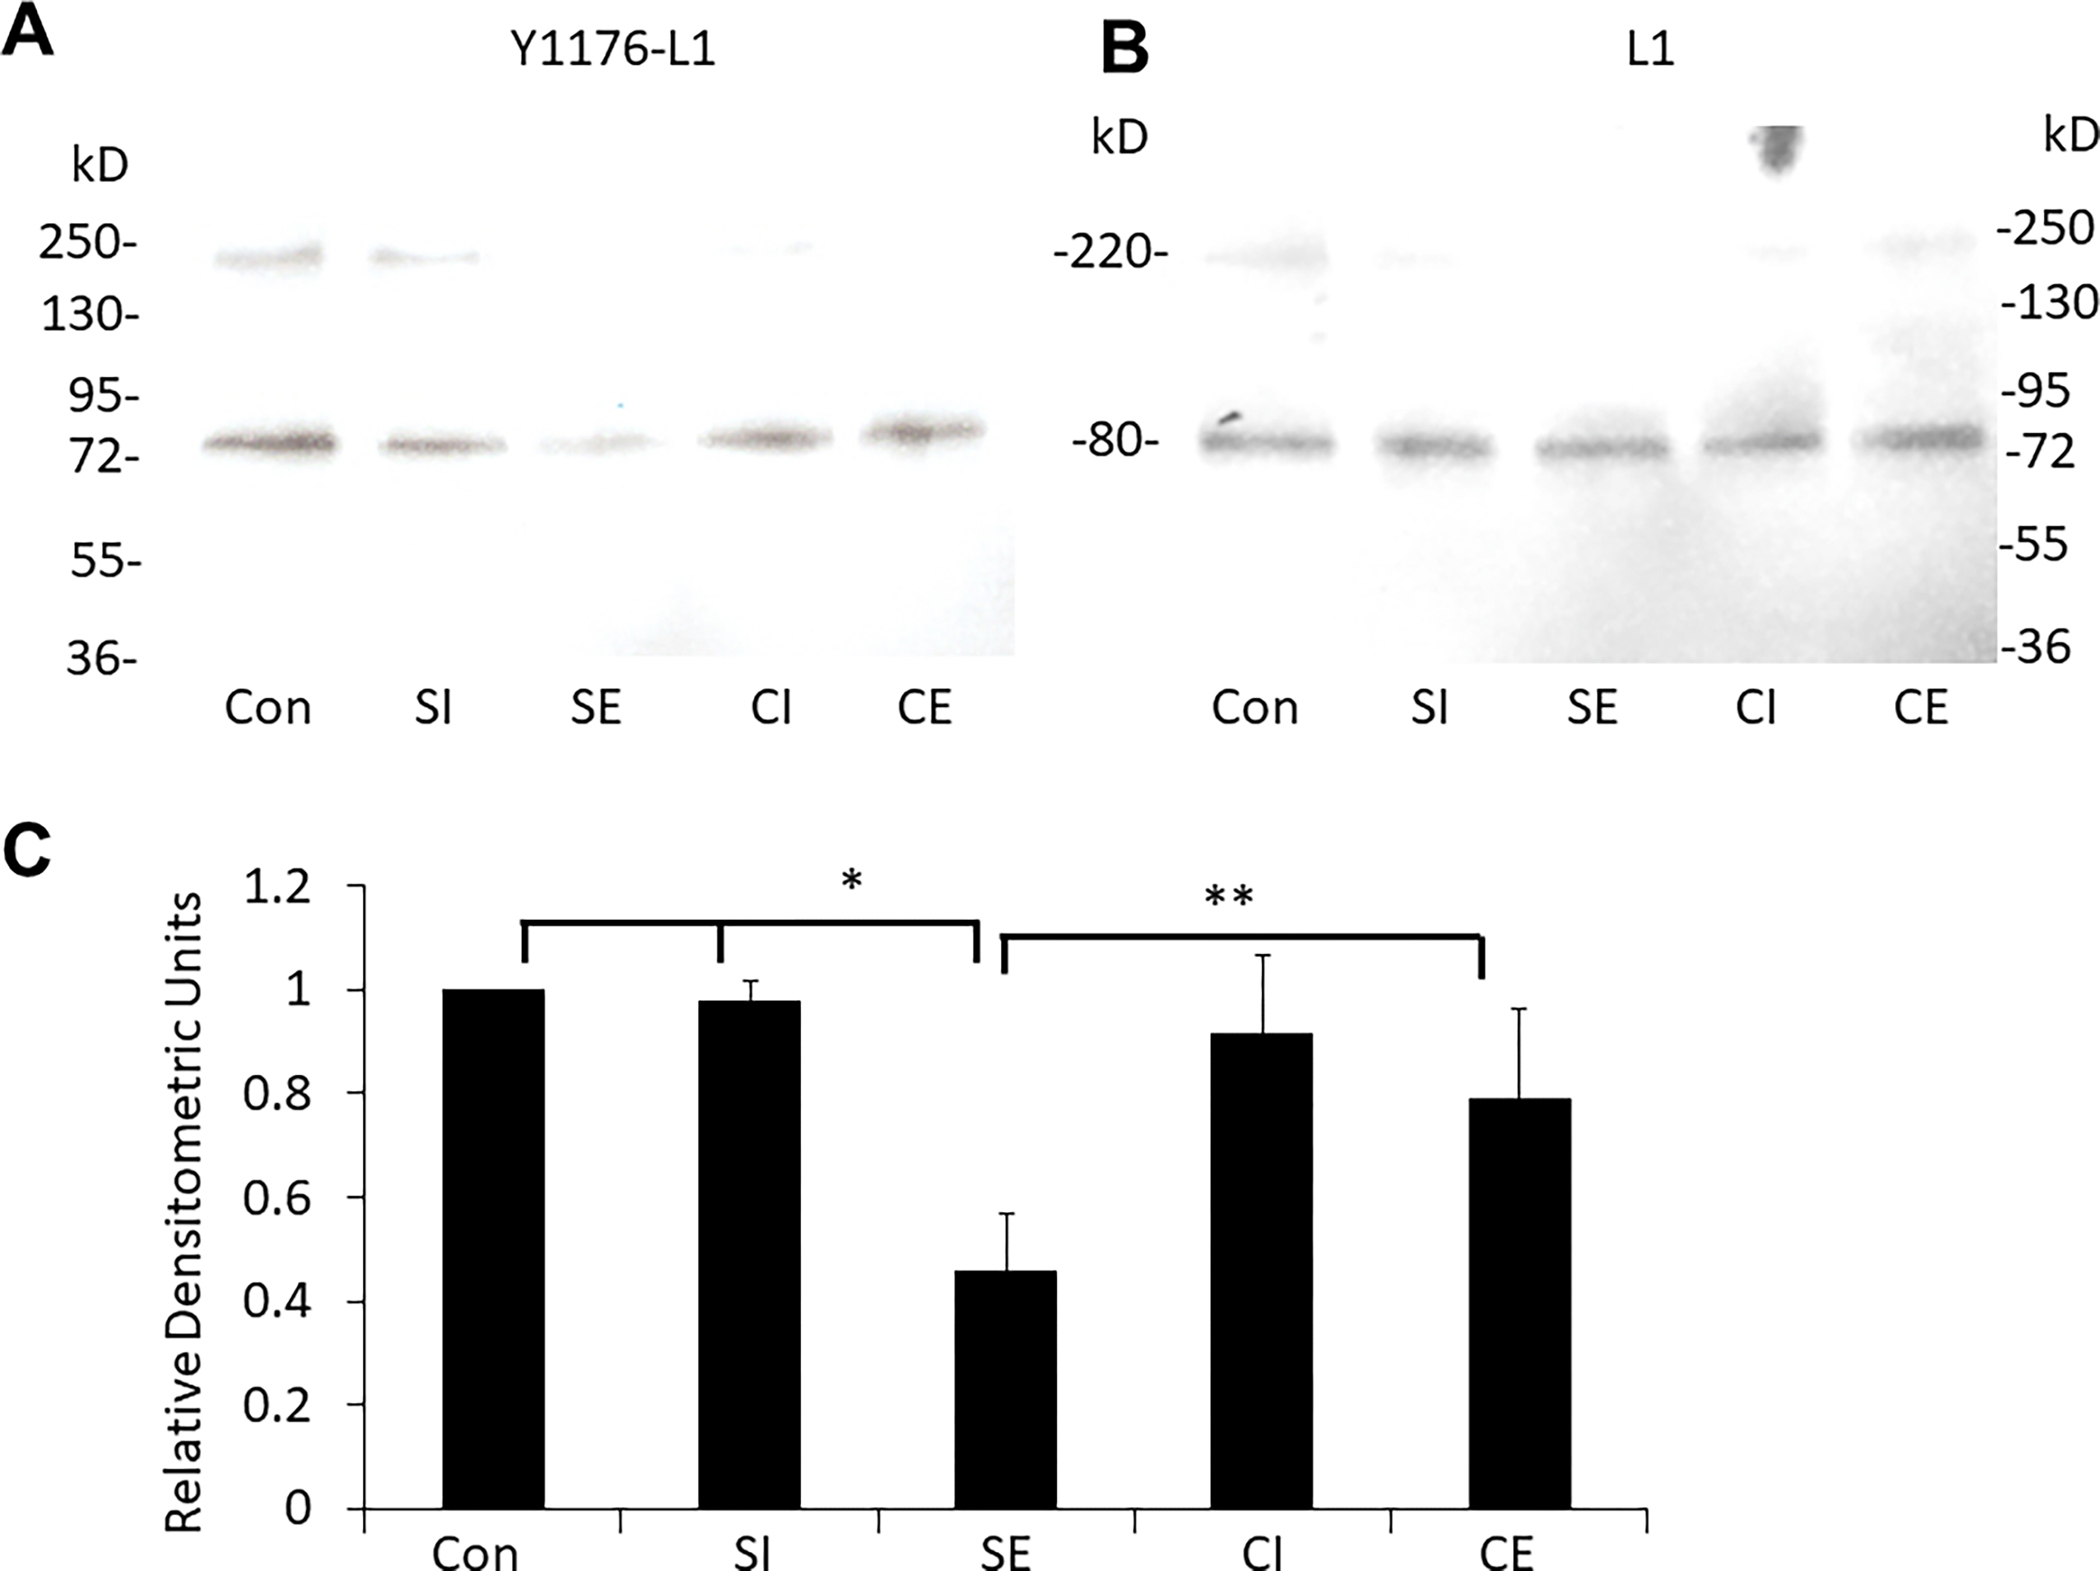
A) Representative immunoblot of dephosphorylated L1-Y1176 of cerebella from rat pups. B) The blot was stripped and immunoblotted for L1 as a loading control. C) Bar Graph: Mean +/− SEM of the ratio of L1-Y1176/L1 normalized to control (n=3 pups per treatment group from 3 different litters). *SE vs (Con and SI) (p=0.0001, Cohen’s D=6.6). **SE vs CE (p=0.0154, Cohen’s D=2.3)
Choline ameliorates the ethanol suppression of L1 tyrosine phosphorylation.
Immunoprecipitation with Goat IgG followed by immunoblot with either goat anti-L1CD with a secondary of donkey anti-goat IgG or PY100 followed by secondary rabbit anti-mouse IgG showed no non-specific bands (Figure 4). As shown in Figure 5, the relative amount of L1 with tyrosine phosphorylation in the handled only control (CON) was not significantly different from the saline/intralipid control group (SI) (p=0.4). F-ratio for the 2-way ANOVA model was 10.8 (p=0.0013). Ethanol significantly decreased the relative amount of L1 with tyrosine phosphorylation (SE) compared to the SI and CON group (p=0.0022, Cohen’s D=4.1). Choline supplementation of the pups in the absence of ethanol (CI) did not significantly change the proportion of L1 with tyrosine phosphorylation from that of the combined Con and SI groups (p=0.727, Cohen’s D=0.7). Prior choline supplementation of animals who were treated with ethanol (CE) increased the proportion of L1 with tyrosine phosphorylation compared to saline treated animals receiving ethanol (SE), though this effect did not quite achieve statistical significance (p=0.064, Cohen’s D=2.3). Prior supplementation with choline in those treated with ethanol (CE) increased the proportion of L1 with tyrosine phosphorylation so that there was no significant difference when compared to CON and SI animals (p=0.413, Cohen’s D=1) or CI animals (p=0.157, Cohen’s D=1.5).
Figure 4. Immunoprecipitation using goat IgG resulted in no nonspecific bands in either the immunoblot for phosphotyrosine (PY100) or for that of L1.

Immunoprecipitation of lysates from each of the 3 control pups were performed using either goat polyclonal antibody to L1CD or goat IgG. Immunoprecipitants were blotted for either A) phosphotyrosine (PY100) or B) L1 (using antibody to L1CD). The immunoblot with PY100 (A) shows only the 220 kD and 80 kD bands consistent with L1. The immunoblot for L1 (B) only shows the heavy chain of the goat IgG from the immunoprecipiatation at 50 kD in addition to the 220 kD and 80 kD bands for L1 when the secondary antibody was donkey anti-goat IgG.
Figure 5. Choline supplementation ameliorates the reduction of tyrosine phosphorylation of L1 by ethanol in vivo.

A) Representative Western blot using anti-phosphotyrosine antibody (PY100) of immunoprecipitated L1 from cerebella of rat pups. B) The blot was then stripped and immunoblotted for total L1 as a loading control. C) Bar Graph: Mean +/− SEM of the ratio of tyrosine phosphorylated form of L1/total L1 normalized to the control group (n=3 pups per treatment group from 3 different litters). *Con/SI vs SE, (p=0.0022, Cohen’s D=4.1); **SE vs CE, (p=0.064, Cohen’s D=2.3).
Choline treatment reduces the effect of ethanol on L1 redistribution in DRM.
As shown in Figure 6, the percent of L1 in DRM of pups who received no treatments (CON) and pups that received saline injections from P1–5 and intralipid on P5 (SI) were 5.3% ± 3.1% and 6.1% ± 2.0%, respectively. There is no significant difference between the two groups (p=0.7012). F-ratio for the 2-way ANOVA model was 21.6 (p<0.0001). In the SE group, administration of 6g/kg ethanol to pups on P5 significantly increased the percent of L1 in DRM to 18.7% ± 3.8% compared to the SI and CON groups (p<0.0001, Cohen’s D=4.1). In the CI group (choline injections followed by gavage with intralipid), there is no significant change in the percent of L1 in DRM compared to SI and CON animals (p=0.9977, Cohen’s D=0.17). In the CE group, pretreatment of the pups with choline ameliorates the effect of ethanol on L1 distribution in DRM, significantly decreasing the percent of L1 in DRM to 10.8% ± 1.84% compared to the SE group (p=0.0107, Cohen’s D=2.7). Prior supplementation with choline when exposed to ethanol (CE) also decreased the percent of L1 in DRM so there was no significant difference in the CE group when compared to the CI group (p=0.0873, Cohen’s D=3.3) or to the SI and CON group (p=0.06, Cohen’s D=2.4).
Figure 6. Choline ameliorates EtOH induced redistribution of L1 into DRM of the cerebellum in vivo.

A) Representative immunoblot of L1 in detergent-resistant microdomains (DRM) and non-DRM (N) pools from cerebella of treated animals. B) Bar graph: Mean +/− SEM of percent of L1 in DRM (n=3 pups per treatment group from 3 different litters). *Con/SI vs SE (p<0.0001, Cohen’s D=4.1), **SE vs CE (p=0.0107, Cohen’s D=2.7).
Discussion
L1 is a transmembrane glycoprotein closely correlated with neuronal maturation, migration, and neurite outgrowth. Multiple studies in vitro and in vivo have shown that the functions of L1 are inhibited by ethanol.(Bearer et al., 1999; Chen & Charness, 2012; Littner, Cudd, O’Riordan, Cwik, & Bearer, 2008; Ramanathan et al., 1996; Tang et al., 2006; Yeaney et al., 2009) Those functions include L1 homophilic binding, L1 mediated neurite outgrowth, L1 activation of p60src and extracellular receptor kinase ½ (ERK1/2), L1 tyrosine phosphorylation and dephosphorylation of Y1176 in L1. The ability of L1 to traffic through DRM is also essential to maintain L1 functions. Disruption of DRM with cholesterol chelation, treatment with lovastatin or treatment with fumonisin B reduces neurite length of CGN plated on L1 demonstrating the dependence of L1 on trafficking through DRM.(Nakai & Kamiguchi, 2002; Tang et al., 2011) Treatment of both CGN and rat pups with ethanol increases the percent of L1 in DRM, suggesting a disruption of protein trafficking through DRM.(Littner et al., 2013; Tang et al., 2011)
Choline, an essential nutrient, has been found to mitigate behavioral deficits caused by ethanol exposure.(Bearer et al., 2015; Ryan et al., 2008; Thomas et al., 2009, 2007, 2004, 2000) Choline supplementation of CGN mitigates the effects of ethanol on L1 mediated neurite outgrowth and reduces the inhibition of ethanol on L1 stimulated tyrosine phosphorylation, p60src and ERK1/2 activation, and dephosphorylation of Y1176.(Tang et al., 2014) In addition, choline pretreatment of CGN significantly reduced the increased proportion of L1 in DRM caused by ethanol.(Tang et al., 2014) This paper demonstrates that choline supplementation of rat pups also ameliorates the reduction of tyrosine phosphorylation of L1, the reduction of dephosporylation of Y1176 in L1, and the increase in percent of L1 in DRM in the cerebella of rat pups gavaged with ethanol.
Choline can be metabolized by 3 different pathways: 1) Choline can be phosphorylated to phosphocholine (PC) by the choline kinases of which CKα is the most important in the developing nervous system.(Gallego-Ortega et al., 2009; Wu & Vance, 2010) PC is the precursor for both phosphatidylcholine and sphingomyelin, major constituents of the plasma membrane. These choline metabolites can be modulated by dietary choline.(Yaqoob & Shaikh, 2010) 2) Choline can be oxidized by choline dehydrogenase (CDHD) to betaine which is a precursor to methionine and is a 1-carbon donor for methylation via S-adenosylmethionine (SAMe).(Zeisel, 2011) 3) Choline can be acetylated by choline acetyltransferase to acetylcholine, a major neurotransmitter in the forebrain and hippocampus.(Monk, Leslie, & Thomas, 2012) The molecular role of choline in preventing ethanol neurotoxicity has not been investigated. Several possibilities can be hypothesized. Choline may restore sphingomyelin levels. Chronic exposure to alcohol in adult and juvenile mice alters the sphingomyelin concentrations in the brain lipid.(Roux et al., 2015) Chronic ethanol exposure also leads to a decrease in the content of newly synthesized sphingomyelin and to an increase in the level of ceramide and the ceramide/sphingomyelin ratio in the hippocampus.(Babenko & Semenova, 2010) Loss of sphingomyelin would destabilize the DRM, weakening its ability to traffic L1 and impairing L1 functions. Supplementation of pups in vivo with choline may increase the incorporation of sphingomyelin into DRMs and increase their stability.
As before mentioned, choline can be converted by CDHD to betaine and subsequently to SAMe, a methyl donor. SAMe is also involved in the regulation of gene expression through protein RNA and DNA methylation.(Anderson, Sant, & Dolinoy, 2012) Recent evidence shows that ethanol inhibits the DNA methylation in astrocytes leading to increased expression and release of tissue plasminogen activator which is an important factor in modulating neuronal plasticity.(X. Zhang, Kusumo, Sakharkar, Pandey, & Guizzetti, 2014) Prenatal ethanol exposure is also noted to be associated with promoter DNA methylation and H3K4 trimethylation in hippocampus.(C. R. Zhang, Ho, Vega, Burne, & Chong, 2015) DNA and histone methylation are both influenced by ethanol and choline.(Otero, Thomas, Saski, Xia, & Kelly, 2012). Ethanol administration to rat pups resulted in an increase in methylation in hippocampus and prefrontal cortex that choline reduced. Choline administration by itself also resulted in an increase in methylation. If choline serves solely as a direct methyl donor, one would expect methylation to increase with choline supplementation even in the presence of ethanol. However, if choline also is incorporated into membrane lipids with the result of strengthening DRM-dependent signaling, then the downstream effects on gene methylation and hence expression could increase or decrease depending on the specific signals coming from the proteins dependent on DRM. Thus, methylation might increase or decrease, an effect of choline which has been reported.(Otero et al., 2012)
The present study identified choline pretreatment (choline treatment precedes ethanol exposure) as a novel target for further dietary intervention on prevention of fetal alcohol spectrum disorder and provides additional in vivo evidence that disruption of protein trafficking through DRM may be a mechanism of ethanol toxicity. As shown in this study, choline supplementation improves L1 and DRM functions in vivo, however it does not abrogate ethanol effects on L1 completely. More studies are needed to further elucidate the relation between L1 function and choline metabolism in neurons.
Funding:
Supported by NIH/NIAAA 1 R01 AA016398-01A1 (CFB), Cobey Endowment (CFB), and the Munro Fund (CFB)
Footnotes
The authors have no conflict of interest.
Data sharing:
The data that supports the findings of this study are available from the corresponding author upon reasonable request.
References:
- Altman J (1982). Morphological development of rat cerebellum and some of its mechanisms. Experimental Brain Research, Suppl. 6, 8–49. [Google Scholar]
- Anderson OS, Sant KE, & Dolinoy DC (2012). Nutrition and epigenetics: an interplay of dietary methyl donors, one-carbon metabolism and DNA methylation. The Journal of Nutritional Biochemistry, 23(8), 853–859. 10.1016/j.jnutbio.2012.03.003 [doi] [DOI] [PMC free article] [PubMed] [Google Scholar]
- Babenko NA, & Semenova y. a. (2010). No Title. Neurophysiology, 42, 169–174. [Google Scholar]
- Bearer CFF (2001). Mechanisms of brain injury: L1 cell adhesion molecule as a target for ethanol-induced prenatal brain injury. Seminars in Pediatric Neurology, 8(2), 100–107. 10.1053/spen.2001.25227 [DOI] [PubMed] [Google Scholar]
- Bearer CFF, Swick ARR, O’Riordan MAA, & Cheng G (1999). Ethanol inhibits L1-mediated neurite outgrowth in postnatal rat cerebellar granule cells. Journal of Biological Chemistry, 274(19), 13264–13270. 10.1074/jbc.274.19.13264 [DOI] [PMC free article] [PubMed] [Google Scholar]
- Bearer CFF, Wellmann KAA, Tang N, He M, & Mooney SMM (2015). Choline Ameliorates Deficits in Balance Caused by Acute Neonatal Ethanol Exposure. Cerebellum (London, England), 14(4), 413–420. 10.1007/s12311-015-0691-7 [doi] [DOI] [PMC free article] [PubMed] [Google Scholar]
- Charness ME, Safran RM, & Perides G (1994). Ethanol inhibits neural cell-cell adhesion. Journal of Biological Chemistry, 269, 9304–9309. [PubMed] [Google Scholar]
- Chen S, & Charness ME (2012). Ethanol disrupts axon outgrowth stimulated by netrin-1, GDNF, and L1 by blocking their convergent activation of Src family kinase signaling. Journal of Neurochemistry, 123(4), 602–612. https://doi.org/10.1111/j.1471-4159.2012.07954.x; 10.1111/j.1471-4159.2012.07954.x [DOI] [PMC free article] [PubMed] [Google Scholar] [Retracted]
- Connor PD, Sampson PD, Streissguth AP, Bookstein FL, & Barr HM (2006). Effects of prenatal alcohol exposure on fine motor coordination and balance: A study of two adult samples. Neuropsychologia, 44(5), 744–751. 10.1016/j.neuropsychologia.2005.07.016 [DOI] [PubMed] [Google Scholar]
- de Graaf G, Buckley F, Dever J, & Skotko BG (2017). Estimation of live birth and population prevalence of Down syndrome in nine U.S. states. American Journal of Medical Genetics. Part A, 173(10), 2710–2719. 10.1002/ajmg.a.38402 [DOI] [PubMed] [Google Scholar]
- Gallego-Ortega D, Ramirez de Molina A, Ramos MA, Valdes-Mora F, Barderas MG, Sarmentero-Estrada J, & Lacal JC (2009). Differential role of human choline kinase alpha and beta enzymes in lipid metabolism: implications in cancer onset and treatment. PloS One, 4(11), e7819. 10.1371/journal.pone.0007819 [DOI] [PMC free article] [PubMed] [Google Scholar]
- Hunter J, Rivero-Arias O, Angelov A, Kim E, Fotheringham I, & Leal J (2014). Epidemiology of fragile X syndrome: a systematic review and meta-analysis. American Journal of Medical Genetics. Part A, 164A(7), 1648–1658. 10.1002/ajmg.a.36511 [DOI] [PubMed] [Google Scholar]
- Jirikowic TL, McCoy SW, Lubetzky-Vilnai A, Price R, Ciol MA, Kartin D, … Astley SJ (2013). Sensory control of balance: a comparison of children with fetal alcohol spectrum disorders to children with typical development. Journal of Population Therapeutics and Clinical Pharmacology = Journal de La Therapeutique Des Populations et de La Pharamcologie Clinique, 20(3), e212–28. [PMC free article] [PubMed] [Google Scholar]
- Littner Y, Cudd TAA, O’Riordan MAA, Cwik A, & Bearer CFF (2008). Elevated fatty acid ethyl esters in meconium of sheep fetuses exposed in utero to ethanol--a new animal model. Pediatric Research, 63(2), 164–168. 10.1203/PDR.0b013e31815f651e [DOI] [PMC free article] [PubMed] [Google Scholar]
- Littner Y, Tang N, He M, & Bearer CFF (2013). L1 cell adhesion molecule signaling is inhibited by ethanol in vivo. Alcoholism, Clinical and Experimental Research, 37(3), 383–389. https://doi.org/10.1111/j.1530-0277.2012.01944.x; 10.1111/j.1530-0277.2012.01944.x [DOI] [PMC free article] [PubMed] [Google Scholar]
- Loane M, Morris JK, Addor M-C, Arriola L, Budd J, Doray B, … Dolk H (2013). Twenty-year trends in the prevalence of Down syndrome and other trisomies in Europe: impact of maternal age and prenatal screening. European Journal of Human Genetics : EJHG, 21(1), 27–33. 10.1038/ejhg.2012.94 [DOI] [PMC free article] [PubMed] [Google Scholar]
- Lubetzky-Vilnai A, Jirikowic TL, & McCoy SW (2011). Investigation of the Dynamic Gait Index in children: a pilot study. Pediatric Physical Therapy : The Official Publication of the Section on Pediatrics of the American Physical Therapy Association, 23(3), 268–273. https://doi.org/10.1097/PEP.0b013e318227cd82; 10.1097/PEP.0b013e318227cd82 [DOI] [PMC free article] [PubMed] [Google Scholar]
- May PA, Chambers CD, Kalberg WO, Zellner J, Feldman H, Buckley D, … Hoyme HE (2018). Prevalence of Fetal Alcohol Spectrum Disorders in 4 US Communities. Jama, 319(5), 474–482. 10.1001/jama.2017.21896 [doi] [DOI] [PMC free article] [PubMed] [Google Scholar]
- May PA, Gossage JP, Marais AS, Adnams CM, Hoyme HE, Jones KL, … Viljoen DL (2007). The epidemiology of fetal alcohol syndrome and partial FAS in a South African community. Drug and Alcohol Dependence, 88(2–3), 259–271. https://doi.org/S0376-8716(06)00425-X [pii] [DOI] [PMC free article] [PubMed] [Google Scholar]
- May, Philip A, Gossage JP, Kalberg WO, Robinson LK, e D, Manning M, & Hoyme HE (2009). Prevalence and epidemiologic characteristics of FASD from various research methods with an emphasis on recent in-school studies. Developmental Disabilities Research Reviews, 15(3), 176–192. 10.1002/ddrr.68 [DOI] [PubMed] [Google Scholar]
- Miller L, & Tolliver R (2002). Fetal alcohol syndrome--Alaska, Arizona, Colorado, and New York, 1995–1997. Mortality & Morbidity Weekly Report, 51, 433–435. [PubMed] [Google Scholar]
- Monk BR, Leslie FM, & Thomas JD (2012). The effects of perinatal choline supplementation on hippocampal cholinergic development in rats exposed to alcohol during the brain growth spurt. Hippocampus, 22(8), 1750–1757. https://doi.org/10.1002/hipo.22009; 10.1002/hipo.22009 [DOI] [PMC free article] [PubMed] [Google Scholar]
- Moos M, Tacke R, Schere H, Teplow D, Fruh K, & Schachner M (1988). Neural adhesion molecule L1 as a member of the immunoglobulin superfamily with binding domains similar to fibronectin. Nature, 334, 701–703. [DOI] [PubMed] [Google Scholar]
- Nakai Y, & Kamiguchi H (2002). Migration of nerve growth cones requires detergent-resistant membranes in a spatially defined and substrate-dependent manner. Journal of Cell Biology, 159(6), 1097–1108. [DOI] [PMC free article] [PubMed] [Google Scholar]
- Otero NK, Thomas JD, Saski CA, Xia X, & Kelly SJ (2012). Choline supplementation and DNA methylation in the hippocampus and prefrontal cortex of rats exposed to alcohol during development. Alcoholism, Clinical and Experimental Research, 36(10), 1701–1709. https://doi.org/10.1111/j.1530-0277.2012.01784.x; 10.1111/j.1530-0277.2012.01784.x [DOI] [PMC free article] [PubMed] [Google Scholar]
- Paley B, & O’Connor MJ (2011). Behavioral interventions for children and adolescents with fetal alcohol spectrum disorders. Alcohol Research & Health : The Journal of the National Institute on Alcohol Abuse and Alcoholism, 34(1), 64–75. [PMC free article] [PubMed] [Google Scholar]
- Ramanathan R, Wilkemeyer MF, Mittal B, Perides G, & Charness ME (1996). Alcohol inhibits cell-cell adhesion mediated by human L1. The Journal of Cell Biology, 133(2), 381–390. [DOI] [PMC free article] [PubMed] [Google Scholar]
- Roux A, Muller L, Jackson SN, Baldwin K, Womack V, Pagiazitis JG, … Woods AS (2015). Chronic ethanol consumption profoundly alters regional brain ceramide and sphingomyelin content in rodents. ACS Chemical Neuroscience, 6(2), 247–259. 10.1021/cn500174c [doi] [DOI] [PMC free article] [PubMed] [Google Scholar]
- Ryan SH, Williams JK, & Thomas JD (2008). Choline supplementation attenuates learning deficits associated with neonatal alcohol exposure in the rat: effects of varying the timing of choline administration. Brain Research, 1237, 91–100. 10.1016/j.brainres.2008.08.048 [DOI] [PMC free article] [PubMed] [Google Scholar]
- Schmid RS, Pruitt WM, & Maness PF (2000). A MAP kinase-signaling pathway mediates neurite outgrowth on L1 and requires Src-dependent endocytosis. Journal of Neuroscience, 20(11), 4177–4188. [DOI] [PMC free article] [PubMed] [Google Scholar]
- Spottiswoode BS, Meintjes EM, Anderson AW, Molteno CD, Stanton ME, Dodge NC, … Jacobson SW (2011). Diffusion tensor imaging of the cerebellum and eyeblink conditioning in fetal alcohol spectrum disorder. Alcoholism, Clinical and Experimental Research, 35(12), 2174–2183. https://doi.org/10.1111/j.1530-0277.2011.01566.x; 10.1111/j.1530-0277.2011.01566.x [DOI] [PMC free article] [PubMed] [Google Scholar]
- Tang N, Bamford P, Jones J, He M, Kane MAA, Mooney SMM, & Bearer CFF (2014). Choline partially prevents the impact of ethanol on the lipid raft dependent functions of l1 cell adhesion molecule. Alcoholism, Clinical and Experimental Research, 38(11), 2722–2730. 10.1111/acer.12554 [doi] [DOI] [PMC free article] [PubMed] [Google Scholar]
- Tang N, Farah B, He M, Fox S, Malouf A, Littner Y, & Bearer CFF (2011). Ethanol causes the redistribution of L1 cell adhesion molecule in lipid rafts. Journal of Neurochemistry, 119(4), 859–867. https://doi.org/10.1111/j.1471-4159.2011.07467.x; 10.1111/j.1471-4159.2011.07467.x [DOI] [PMC free article] [PubMed] [Google Scholar]
- Tang N, He M, O’Riordan MAA, Farkas C, Buck K, Lemmon V, & Bearer CFF (2006). Ethanol inhibits L1 cell adhesion molecule activation of mitogen-activated protein kinases. Journal of Neurochemistry, 96(5), 1480–1490. 10.1111/j.1471-4159.2006.03649.x [DOI] [PMC free article] [PubMed] [Google Scholar]
- Thomas JD, Abou EJ, & Dominguez HD (2009). Prenatal choline supplementation mitigates the adverse effects of prenatal alcohol exposure on development in rats. Neurotoxicology and Teratology, 31(5), 303–311. 10.1016/j.ntt.2009.07.002 [DOI] [PMC free article] [PubMed] [Google Scholar]
- Thomas JD, Biane JS, O’Bryan KA, O’Neill TM, & Dominguez HD (2007). Choline supplementation following third-trimester-equivalent alcohol exposure attenuates behavioral alterations in rats. Behavioral Neuroscience, 121(1), 120–130. 10.1037/0735-7044.121.1.120 [DOI] [PubMed] [Google Scholar]
- Thomas JD, Garrison M, & O’Neill TM (2004). Perinatal choline supplementation attenuates behavioral alterations associated with neonatal alcohol exposure in rats. Neurotoxicology and Teratology, 26(1), 35–45. 10.1016/j.ntt.2003.10.002 [DOI] [PubMed] [Google Scholar]
- Thomas JD, Idrus NM, Monk BR, & Dominguez HD (2010). Prenatal choline supplementation mitigates behavioral alterations associated with prenatal alcohol exposure in rats. Birth Defects Research. Part A, Clinical and Molecular Teratology, 88(10), 827–837. 10.1002/bdra.20713 [DOI] [PMC free article] [PubMed] [Google Scholar]
- Thomas JD, La Fiette MH, Quinn VR, & Riley EP (2000). Neonatal choline supplementation ameliorates the effects of prenatal alcohol exposure on a discrimination learning task in rats. Neurotoxicology and Teratology, 22(5), 703–711. [DOI] [PubMed] [Google Scholar]
- Thomas JD, & Tran TD (2012). Choline supplementation mitigates trace, but not delay, eyeblink conditioning deficits in rats exposed to alcohol during development. Hippocampus, 22, 619–630. https://doi.org/10.1002/hipo.20925; 10.1002/hipo.20925 [DOI] [PMC free article] [PubMed] [Google Scholar]
- Wu G, & Vance DE (2010). Choline kinase and its function. Biochemistry and Cell Biology = Biochimie et Biologie Cellulaire, 88(4), 559–564. 10.1139/O09-160 [DOI] [PubMed] [Google Scholar]
- Yaqoob P, & Shaikh SR (2010). The nutritional and clinical significance of lipid rafts. Current Opinion in Clinical Nutrition and Metabolic Care, 13(2), 156–166. 10.1097/MCO.0b013e328335725b [DOI] [PubMed] [Google Scholar]
- Yeaney NKK, He M, Tang N, Malouf ATT, O’Riordan MAA, Lemmon V, & Bearer CFF (2009). Ethanol inhibits L1 cell adhesion molecule tyrosine phosphorylation and dephosphorylation and activation of pp60(src). Journal of Neurochemistry, 110(3), 779–790. 10.1111/j.1471-4159.2009.06143.x [DOI] [PMC free article] [PubMed] [Google Scholar]
- Zeisel SH (2011). Nutritional genomics: defining the dietary requirement and effects of choline. The Journal of Nutrition, 141(3), 531–534. 10.3945/jn.110.130369 [DOI] [PMC free article] [PubMed] [Google Scholar]
- Zhang CR, Ho MF, Vega MC, Burne TH, & Chong S (2015). Prenatal ethanol exposure alters adult hippocampal VGLUT2 expression with concomitant changes in promoter DNA methylation, H3K4 trimethylation and miR-467b-5p levels. Epigenetics & Chromatin, 8, 40-015-0032-6. eCollection 2015. 10.1186/s13072-015-0032-6 [doi] [DOI] [PMC free article] [PubMed] [Google Scholar]
- Zhang X, Kusumo H, Sakharkar AJ, Pandey SC, & Guizzetti M (2014). Regulation of DNA methylation by ethanol induces tissue plasminogen activator expression in astrocytes. Journal of Neurochemistry, 128(3), 344–349. 10.1111/jnc.12465 [doi] [DOI] [PMC free article] [PubMed] [Google Scholar]
Associated Data
This section collects any data citations, data availability statements, or supplementary materials included in this article.
Data Availability Statement
The data that supports the findings of this study are available from the corresponding author upon reasonable request.