

Abstract
Objectives: The aim was to find the relationship between nasal smear eosinophil (NSE) counts and allergic rhinitis (AR) along with the impact of treatment on peak nasal inspiratory flow rates and symptom scores in these patients. Material and methods: An observational, comparative study was carried out with 75 patients of AR. Nasal smears were drawn and eosinophil counts were estimated. Nasal symptoms were assessed and compared by visual analogue scale (VAS) and peak nasal inspiratory flow (PNIF) rates before and after treatment. Equal number of healthy individuals formed the control group. Results: There was a strong association between increase in eosinophil count in nasal smears and AR (p = 0.000). A NSE count of 0.2/HPF had a specificity of 98.7%, sensitivity of 53.3%, and positive predictive value of 97.6% in the diagnosis of AR. The mean VAS scores for nasal obstruction improved from 7.35 to 1.01 and the mean peak nasal inspiratory flow from 69.00 L/min to 103.73 L/min (p < 0.0001) after treatment. The mean NSE counts reduced from 4.20/HPF to 0.090/HPF proving a strong correlation between improvement of symptom scores and NSE counts (p = 0.000) in AR. The study also determined that a PNIF value of ≤ 77.50 L/min can be used as a cut off for diagnosing nasal obstruction in these patients. Conclusion: A NSE count of ≥ 0.2 /HPF is to be considered as diagnostic of AR. Nasal congestion is the commonest symptom associated with AR and addition of systemic decongestant is required for management of these patients.
Keywords: Allergic rhinitis, Nasal smear eosinophil, Peak nasal inspiratory flow rate, Skin prick test
Introduction
AR is a common chronic affliction in the industrialized world with a significant impact on daily life. Based on the present scenario it is rightly termed as “the epidemic of twenty-first century”. AR affects about 15–25% of the world’s population and is increasing in prevalence [1]. Nasal cytology directly reflects nasal inflammation and NSE count is accepted as a useful finding in the diagnosis and management of AR [2]. This study was conducted to evaluate the utility of NSE count and its application as a simple, non-invasive and inexpensive method for the diagnosis, management and evaluation of the treatment response in patients of AR.
Aims and Objectives
To find out the association between the NSE counts and AR.
To find out the impact of treatment on NSE counts and PNIF values.
Materials and Methods
An observational, comparative study was carried out at a tertiary referral hospital in West Bengal, India between June 2017 and May 2018 with the approval of the institutional ethics committee (Ref.No.F-24/PR/COMJNMH/IEC/17/1549). Written informed consent was obtained from 150 study subjects. The patient (suffering from AR) and the comparison groups comprised of 75 individuals each, based on the following criteria:
Inclusion Criteria
Persons with AR Patients attending outpatient department (OPD) with clinical diagnosis of AR according to Allergic rhinitis and its impact on asthma (ARIA) guidelines. Patients with positive skin prick test (SPT).
Persons without AR Equal number of apparently healthy subjects from the general population in the community without any active nasal disease and a negative SPT.
Exclusion Criteria
Patients with gross obstructive anomalies of nose such as deviated nasal septum, polyps, mass in the nose.
Patients who have received treatment for any form of rhinitis in the preceding 30 days.
Patients who are on treatment with drugs which reduces the eosinophil counts.
Patients below 10 years age.
Detailed history and clinical examination was used to establish a clinical diagnosis of AR. The diagnosed patients were then classified according to the ARIA guidelines (2001) into intermittent and persistent groups and further sub classified into mild and moderate-to-severe groups. An equal number of age and sex matched apparently healthy subjects from the general population in the community formed the comparison group.
All participants were subjected to SPT with 50 commercially available standardized allergen extracts native to the said geographical location. A wheal of > 3 mm in the SPT was considered positive. Only patients having positive SPT results were included in the ‘patient’ group.
NSE counts of the subjects were prepared by scraping medial surface of inferior turbinate with a sterile saline soaked swab stick. The secretions were then spread uniformly on to two glass slides (one for each side), air dried and fixed with 95% alcohol followed by staining with May-Grunwald Giemsa stain. The slides were numbered and EO counts were recorded in terms of number of EO per high power field (HPF). As the cells were unevenly distributed in smears, the numbers of EO were counted in at least 50 HPFs and the average count recorded. This was done for smears from both the left and right nostrils and then an average of the two counts was recorded.
As nasal obstruction is one of the predominant symptoms of AR, PNIF values of these patients were measured by using Clement Clark international limited model IN-CHECK ORAL ATM DEVICE. The highest of the three satisfactory maximum inspiration values was noted as the maximum PNIF. Patients were given a VAS to grade their nasal obstruction by marking the point on the scale that best corresponds to their nasal obstruction.
Those patients with intermittent AR were prescribed antihistamines with or without oral decongestants depending on their symptoms. Those with persistent AR were prescribed intra nasal corticosteroids for one month.
The NSE counts and PNIF values were also noted for the comparison group of 75 individuals. All patients of the study group were re-assessed for PNIF values, VAS score for nasal obstruction and NSE count after treatment.
Results
The minimum age at presentation in our study group was 12 years while maximum was 61 years with the mean age being 32.27(SE–1.442) years. The mean age of the comparison group was similar to that of the patients (31.27 years) (Fig. 1). The patient group had 57.3% females and 42.7% males while the comparison group had 54.7 and 45.3% respectively. The earliest age of onset of AR in our study was 2 years. Among patients the average duration of symptoms at presentation was 1.83 months.
Fig. 1.

Bar diagram showing age distribution of the study group
There was a strong association between high EO count in nasal smears and AR (p = 0.000) (Table 1).It is seen that patients who had an EO count ≥ 0.10/HPF, the probability of having AR was 85.52% and with a count of ≥ 0.20/HPF, the probability was 97.6%. The probability was 100% with an EO count of ≥ 0.25/HPF. Among those who had an EO count < 0.10/ HPF, the probability of having no AR was 70.5% while with a count of < 0.20/HPF, this probability was 67.9%. The probability of being free of AR further reduces to 66.4% with an EO count of < 0.25/HPF. A NSE count of 0.2/HPF had a specificity of 98.7% and a sensitivity of 53.3% in the diagnosis of AR. This translates to a positive predictive value of 97.6% (Table 2).
Table 1.
NSE count and allergic rhinitis
| Eosinophil count (/HPF) | Allergic rhinitis present, n (%) | Allergic rhinitis absent, n (%) | Statistics χ2 = 66.747, df = 3 | |
|---|---|---|---|---|
| 0.00–0.10 | 31 | (41.3) | 73 (97.3) | p = 0.000 |
| 0.11–0.20 | 7 (9.3) | 2 (2.7) | ||
| 0.21–0.30 | 1 (1.3) | 0 (0.0) | ||
| > 0.30 | 36 (48.0) | 0 (0.0) | ||
Table 2.
Sensitivity, specificity, positive predictive value and negative predictive value of EO count in diagnosing a case of AR
| Eosinophil cut off value (No./HPF) | Sensitivity (%) | Specificity (%) | Positive predictive value (%) | Negative predictive value (%) |
|---|---|---|---|---|
| ≥ 0.10 | 62.7 | 89.3 | 85.5 | 70.5 |
| ≥ 0.20 | 53.3 | 98.7 | 97.6 | 67.9 |
| ≥ 0.25 | 49.3 | 100 | 100 | 66.4 |
The NSE counts wasn’t a predictor of type or severity of AR (p > 0.05). Neither did the counts determine the presence or absence of any of the major symptoms such as sneezing, itching, nasal discharge (p > 0.05).Though the EO counts were high before treatment it did not determine the age of onset of the disease. Both are negatively correlated, but not very significant (Pearson correlation r = −0.034). There was a positive correlation between EO count and duration of symptoms but this was not significant as it had a Pearson’s correlation value very close to 0 (r = 0.12) (Table 3).
Table 3.
Correlation between the nasal eosinophil count and the type and duration of symptoms
| Sl. no. | Pearson’s correlation | |
|---|---|---|
| 1 | Eosinophil count and duration of symptoms (in months) | 0.120 |
| 2 | Eosinophil count and age of onset of AR | − 0.034 |
The difference between the proportions of EO count in between two groups of disease type and severity was also not significant (P > 0.05).However, there was a strong association between raised EO counts and positive SPT (P = 0.000). This in turn indicates a strong correlation between a raised NSE count and AR.
The distribution of symptoms in the patients of AR is shown in Fig. 2. Nasal obstruction was by far the commonest symptom associated with AR with all (100%) patients complaining of it to varying degrees. This was followed by sneezing and nasal discharge (both at 93.3%). Itching was the least common symptom, though not insignificant at 88%.
Fig. 2.
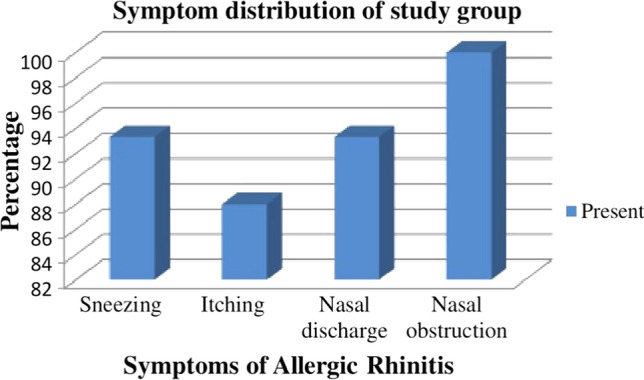
Bar diagram showing symptom distribution of the study group
The mean (SE) VAS for nasal obstruction before and after treatment were 7.35 (0.247) and 1.01 (0.141) respectively. This shows that there is a statistically significant reduction of symptom scores after one month of treatment. The mean PNIF was increased from 69.00 L/min to 103.73 L/min after treatment. This shows that there is a statistically significant reduction of symptom scores for nasal obstruction after 1 month of treatment (p < 0.0001) (Table 4). The mean NSE count reduced from 4.2 to 0.09 after treatment. This reflects a significant reduction of EO count after treatment (p = 0.000). Thus, reduction in NSE counts can be seen as a reflection of reduction in symptoms scores and treatment response in AR patients (Table 5).
Table 4.
Descriptive statistics of VAS score and PNIF for assessment of nasal obstruction before and after treatment among patients (n = 75)
| Variables | Minimum | Maximum | Mean (SE) | P value |
|---|---|---|---|---|
| VAS BT | 2 | 10 | 7.3 (0.247) | ** < 0.0001 |
| VAS AT | 0 | 5 | 1.01 (0.141) | |
| PNIF BT (L/min) | 40 | 140 | 69.00(2.663) | ** < 0.0001 |
| PNIF AT (L/min) | 50 | 200 | 103.73(0.576) |
SE–Standard error, ** highly significant
VAS BT–Visual analogue scale score before treatment. PNIF BT–PNIF before treatment
VAS AT–Visual analogue scale score after treatment. PNIF BT–PNIF before treatment
Table 5.
Correlation between NSE count before and after treatment among patients
| Variable | Mean (SE) | Paired differences statistics |
|---|---|---|
| Eosinophil count BT (/HPF) | 4.20 (0.972) | Mean (SE) = 4.11 (0.973), CI = 2.17–6.05, t = 4.230, P = 0.000 |
| Eosinophil count AT (/HPF) | 0.090 (0.055) |
The average PNIF value was significantly lower in patients with AR (Table 6) compared to the comparison group and the difference in proportions at different levels of PNIF was found as statistically significant (p = 0.000). PNIF is a good screening tool to diagnose nasal blockage as shown in the ROC curve in Fig. 3. As the area under the curve is more than 0.500 and close to 1.000 and the curve itself is running very close to the vertical axis we can say that PNIF is a good diagnostic tool to identify nasal blockage in AR. True positive is represented by vertical axis and false positive by horizontal axis. A test is considered to be very good if it is very close to upper left corner of the curve. This ROC comes close to the upper left corner. If we consider PNIF value of 77.50L/min as cut off to diagnose nasal blockage in AR it gives the test a sensitivity of 72% and specificity of 83%.
Table 6.
PNIF value and allergic rhinitis
| PNIF value (L/min) | Allergic rhinitis present, n (%) | Allergic rhinitis absent, n (%) | Statistics |
|---|---|---|---|
| 40–80 | 59 (78.7%) | 29 (38.7%) | χ2 = 25.45, df = 2 P = 0.000 |
| 81–120 | 14 (18.7%) | 35 (46.7%) | |
| > 120 | 2 (2.7) | 11 (14.7%) |
Fig. 3.
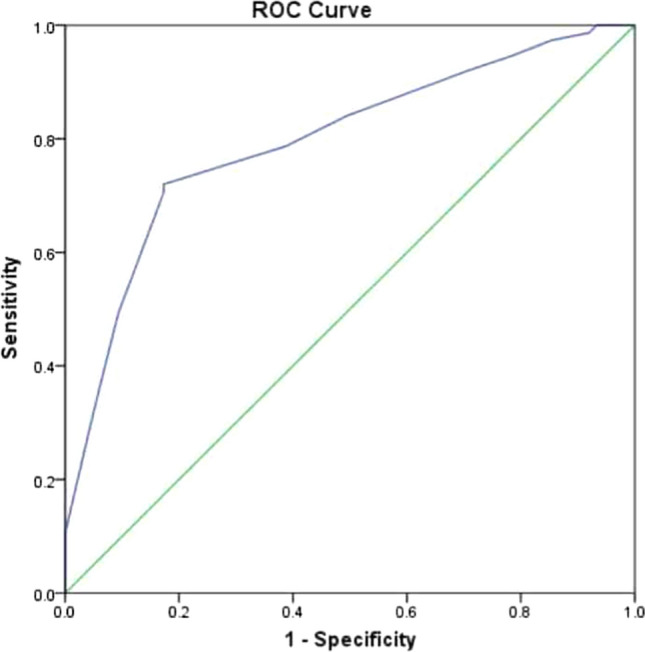
Receiver Operating Characteristic (ROC) curve for PNIF values in diagnosing nasal blockage
Discussion
AR is the most common allergic disease and one of the leading chronic conditions in children. In 80% of cases the symptoms develop before the age of 20 years [3, 4]. In our study, the age of the patients ranged from 12 to 61 years with a mean (SE) age of 32.27(1.442) years; the comparison group had a similar age distribution (mean 31.27 years). The peak prevalence of AR in our study was seen in 3rd decade of life, followed by 4th decade (Fig. 1).
In some studies like the one by Kuldeepa et al. [5], AR had a significant male preponderance while another study showed slight female preponderance [6]. Most of the other authors have found no significant gender predilection [3, 7, 8]. We too did not come across any significant gender predilection in our study.
Most studies have quoted that persistent type of AR is most common with figures varying from 32.2 [9] to 64.3% [6, 10]. Our study agrees by and large with the literature [6, 10]. Data showed that 72% of our patients suffered from persistent type of AR while 28% patients had intermittent type.
A majority of the studies quote nasal obstruction as the commonest symptom of AR. It varies from 90 [11] to 52% [9, 12]. In our study all patients had nasal obstruction (100%). Sneezing, runny nose (93.3% each) and itching (88%) came next. Since, only the irritative symptoms of itching, sneezing and nasal discharge respond to anti-histamines, the addition of a systemic decongestant like phenylephrine will be required for most patients. This point needs to be remembered while prescribing, indenting or requisitioning medications for management of AR patients in hospitals.
Different methods are used to assess nasal obstruction in AR. Literature review shows various studies which have suggested the use of VAS [12–14] and PNIF [15–17] as simple and reliable tools for assessing nasal airway patency. In our study we employed both VAS and PNIF for the same reasons. We found that there was significant reduction in the mean VAS score from 7.35 before treatment to 1.01 after treatment. The mean PNIF scores improved from 69.00 L/min to 103.73 L/min after treatment in our patients. So, we conclude that both VAS and PNIF serve as simple, fast, reliable and cost-effective methods to assess changes in the nasal patency caused by AR and also for monitoring treatment response to the symptoms of nasal congestion.
Extensive search of literature on PubMed for baseline PNIF values for use as a cut off value for nasal obstruction did not yield any results. In the literature a few authors have suggested a formula for obtaining reference values of PNIF for subjects aged from 8 to 15 years [17]. In our study we arrived at a cut off value of PNIF based on ROC curve. Test accuracy is shown as the area under the curve. The greater the area under the curve, the more accurate the test. A perfect test has an area under the ROC curve of 1. The diagonal line in a ROC curve represents perfect chance. If the area under the diagonal is 0.5 or less then the test is of limited utility. If the area under the curve of a diagnostic test is more than 0.9 then it is an excellent diagnostic test. If it is in between 0.8 and 0.9, it a good test to diagnose a condition. Since the area under the curve of our diagnostic test, PNIF is 0.795, PNIF can be considered as a good test to diagnose nasal blockage in AR patients. We can choose PNIF value of 77.50 L/min as the cut off for diagnosing nasal blockage in AR as this value will give the test a sensitivity of 72% and specificity of 83%, which is a fairly good compromise between the inversely related specificity and sensitivity values.
Nasal cytology allows assessment of the pathophysiological changes occurring in the nasal mucosa and monitoring response to treatment. It has both diagnostic and therapeutic utility. EO and mast cells are normally scanty in the nasal mucosa of healthy individuals [18, 19]. In spite of the fact that nasal cytology is a simple, noninvasive, repeatable and cost-effective method, its use in otolaryngology is relatively rare. The reason is that its validity and reliability are not clear [20]. For assessment of nasal cytology, we used a saline soaked cotton swab to scrape the medial surface of the inferior turbinate as it is less traumatic compared to biopsy. It gave us a good yield in terms of the number of cells in the smears. In our study, we used the absolute EO count per HPF to determine a cutoff value of the EO count. An important drawback of estimating the absolute EO count in a smear is the uneven distribution of the nasal secretion in the smears. To minimize this problem, we scrutinized at least 50 HPFs for every smear and then calculated the average EO count from them.
The sensitivity of NSE count in the diagnosis of AR varies from 51.3 [21] to 74% [22] whereas specificity varies from 82.7 [2] to 100% [20]. The positive predictive value varies from 87 [21] to 100% [20]; the negative predictive value varies from 54 [23] to 77% [22]. Ahmadiafshar et al.concluded that using EO count as a diagnostic criterion for AR is more specific than sensitive. In our study 48% of AR patients had an EO count of > 0.30/HPF and 41.3% of them had an EO count of < 0.10/HPF. The maximum EO count per HPF seen in the comparison group was < 0.10 /HPF. There was thus a strong association between increase in EO count in nasal smears and AR (p = 0.000). The mean (SE) EO count before treatment in our study was 4.20(0.972) which reduced significantly to a mean (SE) of 0.090(0.055)/HPF after treatment. Thus, the decrease in the NSE counts was a strong indicator of treatment response and symptom improvement following treatment. In our study, for an EO count of ≥ 0.20/HPF we were getting a specificity value of 98.7%, sensitivity of 53.3%, positive predictive value of 97.6% and negative predictive value of 67.9%. Further increase in the EO count to ≥ 0.25/HPF would increase the specificity and the positive predictive value to 100%, but with a compromise of sensitivity at 49.3%. We consider a NSE count cut off of ≥ 0.2 /HPF to be diagnostic of AR as it gives the best compromise between the reciprocal sensitivities and specificities. It serves as a simple, fast, reliable diagnostic tool and as an objective method for evaluating treatment efficacy. Other values can also be used as cut offs for NSE counts as shown in Table 2 with the corresponding changes in sensitivity or specificity value.
Amperayani et al.in their study showed that there is significant correlation between NSE and severity of AR (p < 0.001) [24]. However, in our study we could not find any association between an elevated NSE count or the mean EO count and severity, type of AR. We also found no association between the age of onset, duration of symptoms and EO counts. We used Pearson’s Correlation Coefficient in order to measure the strength of linear relationship between EO count with age of onset of AR and duration of its symptoms. The Pearson correlation is the most common measure of correlation. It is an index of relationship between two variables. It has a value between −1 and 1, with a value of -1 meaning a total negative linear correlation, 0 being no correlation and + 1 meaning total positive correlation. Though the EO count were high before treatment, it did not determine the age of onset of AR. Both are negatively correlated but not significant (r = −0.034).With respect to duration of symptoms in our study participants we found a positive correlation between EO count and the duration but was not significant as the value was close to 0 (r = 0.120 as depicted in Table 3.
Klaewsong kram et al. [25] found a positive correlation between the nasal EO count and the symptom of nasal obstruction (p = 0.037), although not with total nasal symptom scores. We could not find any positive correlation between raised nasal smear EO counts and symptoms of AR in our study. Further there was no correlation seen between NSE counts and VAS scores or PNIF values before treatment.
Conclusion
NSE count is a simple, fast, reliable tool for diagnosing AR and should be an essential part of the diagnostic work up of patients suspected of AR. A EO count of ≥ 0.2 /HPF is to be considered as diagnostic of AR with a specificity of 98.7%, sensitivity of 53.3% and positive predictive value of 97.6%.
NSE count is uniformly increased in cases of AR but it does not determine the symptoms, age of onset, duration of AR nor does it reflect the type and severity of AR. NSE count though not related to any of the above characteristics of AR, it does reflect resolution of symptoms. Thus, it can be used as a simple and useful parameter for monitoring treatment response in AR.
Nasal congestion is the commonest symptom associated with AR. This means that most of the patients will not have adequate symptom control with anti-histamines alone since only the irritative symptoms of itching, sneezing and nasal discharge are taken care of. The addition of systemic decongestant like phenylephrine is required for a large number of patients. This point needs to be remembered while prescribing, indenting or requisitioning medications for management of AR patients in hospitals.
A PNIF value of ≤ 77.50 L/min can be used as a cut off for diagnosing nasal obstruction in AR. However; there is little correlation between the subjective VAS scores and the more objective PNIF values for assessment of nasal obstruction.
Acknowledgements
We would like to thank department of Otorhinolaryngology, College of Medicine and JNM Hospital, Kalyani, West Bengal University of Health Sciences for the support throughout the study.
Funding
No funding sources.
Declarations
Conflicts of interest
None.
Footnotes
Publisher's Note
Springer Nature remains neutral with regard to jurisdictional claims in published maps and institutional affiliations.
References
- 1.Passali D, Cingi C, Staffa P, Passali F, BayarMuluk N, Bellussi ML. The international study of the allergic rhinitis survey: outcomes from 4 geographical regions. Asia Pac Allerg. 2018;8(1):e7. doi: 10.5415/apallergy.2018.8.e7. [DOI] [PMC free article] [PubMed] [Google Scholar]
- 2.Nurkic J, Ahmad MA, Arifhodzic N, Jusufovic E. The role of target organ diagnosticapproach in seasonal allergic Rhinitis: nasal smear Eosinophils. Matersociomed. 2016;28(2):125–128. doi: 10.5455/msm.2016.28.125-128. [DOI] [PMC free article] [PubMed] [Google Scholar]
- 3.Skoner DP. Allergic rhinitis: defnition, epidemiology, pathophysiology, detection and diagnosis. The J Allerg Clin Immunol. 2001;108(1):S2–S8. doi: 10.1067/mai.2001.115569. [DOI] [PubMed] [Google Scholar]
- 4.Newacheck PW, Stoddard JJ. Prevalence and impact of multiple childhood chronicillnesses. J Pediatr. 1994;124:40–48. doi: 10.1016/S0022-3476(94)70252-7. [DOI] [PubMed] [Google Scholar]
- 5.Vaidya A, PaiNagaraj STS. A study on utility of nasal smearexamination in diagnosing allergic rhinitis and its histopathological correlation in allergicnasal polyps. Int J Basic Appl Med Sci. 2015;5(1):291–297. [Google Scholar]
- 6.Asha’ari ZA, Yusof S, Ismail R. Clinical features of allergic rhinitis and skin prick test analysis based on the ARIA classification: a preliminary study in Malaysia. Ann Acad Med Singapore. 2010;39:619–624. [PubMed] [Google Scholar]
- 7.Sood A (2005) Diagnostic significance of nasal eosinophilia in allergic rhinitis. Indian J Otolaryngol Head Neck Surg 57(1) [DOI] [PMC free article] [PubMed]
- 8.Chinn S, Jarvis D, Luczynska CM, Lai E, Burney PG. Measuring atopy in a multi-centreepidemiological study. Eur J Epidemiol. 1996;12:155–162. doi: 10.1007/BF00145501. [DOI] [PubMed] [Google Scholar]
- 9.Chandrika D. Allergic rhinitis in India; an overview. Int J Otorhinolaryngol Head Necksurgery. 2017;3:1–6. [Google Scholar]
- 10.Saini A, Gupta M, Sharma B, Kakkar M, Chaturvedy G, Gupta M. Rhinitis, sinusitis andocular disease-2085. Prevalence of allergic rhinitis in urban school children, Jaipur city India. World allergy Org J. 2013;6(1):164. doi: 10.1186/1939-4551-6-S1-P164. [DOI] [Google Scholar]
- 11.Fauzi F, Sudiro M, Lestari BW (2015) Prevalence of allergic rhinitis based on World Health Organization (ARIA-WHO) questionnaire among Batch 2010 Students of the Faculty of Medicine Universitas Padjadjaran, Department of Otolaryngol AMJ December
- 12.Gani F, Lombardi C, Barrocu L, Landi M, Ridolo E, Bugiani M. The control of allergic rhinitis in real life: a multicenter cross- sectionalItalian study. Clin Mol Allergy. 2018;16:4. doi: 10.1186/s12948-018-0082-y. [DOI] [PMC free article] [PubMed] [Google Scholar]
- 13.Bousquet PJ, Combescure C, Neukirch F, Klossek JM, Méchin H, Daures JP, Bousquet J. Visual analog scales assess the severity of rhinitis graded according to ARIA guidelines. Allergy. 2007;62:367–372. doi: 10.1111/j.1398-9995.2006.01276.x. [DOI] [PubMed] [Google Scholar]
- 14.Hellings PW, Muraro A, Fokkens W, Mullol J, Bachert C, Canonica GW, Price D, Papadopoulos N, Scadding G, et al. A common language to assess allergic rhinitis control: results from a survey conducted during EAACI Congress. Clin Trans Allergy. 2015;27(5):36. doi: 10.1186/s13601-015-0080-9. [DOI] [PMC free article] [PubMed] [Google Scholar]
- 15.Teixeira RUF, Zappelini CEM, Alves FS, da Costa EA (2011) Peak nasal inspiratory flow evaluation as an objective methodof measuring nasal airflow.Braz.j.otorhinolaryngol.(Impr.)vol.77 no.4 saopaulojuly/Aug.2011 [DOI] [PMC free article] [PubMed]
- 16.De Souza Campos Fernandes S, Ribeiro de Andrade C, da Cunha Ibiapina C (2014) Application of peak nasal inspiratory flow reference values in the treatment of allergic Rhinitis. Rhinology. 52(2):133–6 [DOI] [PubMed]
- 17.da Cunha IC, Ribeiro de Andrade C, Augusto Cruz A. Reference values for peaknasal inspiratory flow in children and adolescents in Brazil. Rhinology. 2011;49(3):304–308. doi: 10.4193/Rhino10.266. [DOI] [PubMed] [Google Scholar]
- 18.Tarchalska-Kryńska B (2009) Diagnostic cytology. In: Diagnostic methods in rhinology, Krzeski A (ed), pp 83–88, Medycynapraktyczna, Cracow
- 19.Gelardi M, Marseglia GL, Licari A, et al. Nasal cytology in children: recent advances. Ital J Pediatr. 2012;38:51. doi: 10.1186/1824-7288-38-51. [DOI] [PMC free article] [PubMed] [Google Scholar]
- 20.Pal I, Sinha Babu A, Halder I, Kumar S. Nasal smear Eosinophils and allergic rhinitis. Ear Nose Throat J. 2017;96(10–11):E17–E22. doi: 10.1177/0145561317096010-1105. [DOI] [PubMed] [Google Scholar]
- 21.Bakhshaee M, Fereidouni M, Farzadnia M, Varasteh A-R. The nasal smear for eosinophils, its value, and its relation to nasal mucosal eosinophilia in allergic rhinitis. Iran J Otorhinolaryngol. 2010;22(60):73–78. [Google Scholar]
- 22.Ahmadiafshar A, Taghiloo D, Esmailzadeh A, Falakaflaki B. Nasal Eosinophilia as amarker for allergic rhinitis: a controlled study of 50 patients. Ear Nose Throat J. 2012;91(3):122–124. doi: 10.1177/014556131209100309. [DOI] [PubMed] [Google Scholar]
- 23.Sanli A, Aydin S, Ateş G, Eken M, Celebi O. Comparison of nasal smear Eosinophilia with skin prick test positivity in patients with allergic rhinitis. Kulak Burun BogazIhtis Derg. 2006;16(2):60–63. [PubMed] [Google Scholar]
- 24.Amperayani S, Kuravi N. Correlation of nasal smear Eosinophilia with class of allergic rhinitis. Indian Pediatr. 2011;48(4):329–330. doi: 10.1007/s13312-011-0059-0. [DOI] [PubMed] [Google Scholar]
- 25.Klaewsongkram J, Ruxrungtham K, Wannakrairot P, et al. Eosinophil count in nasalmucosa is more suitable than the number of ICAM-1-positive nasal epithelial cells to evaluate the severity of house dust mite-sensitive allergic rhinitis: a clinical correlation study. Int Arch Allergy Immunol. 2003;132(1):68–75. doi: 10.1159/000073266. [DOI] [PubMed] [Google Scholar]