Abstract
Physiological and/or pathological implications of the dynamics of sleep stage transitions have not, to date, been investigated. We report detailed duration and transition statistics between sleep stages in healthy subjects and in others with chronic fatigue syndrome (CFS); in addition, we also compare our data with previously published results for rats. Twenty-two healthy females and 22 female patients with CFS, characterized by complaints of unrefreshing sleep, underwent one night of polysomnographic recording. We find that duration of deep sleep (stages III and IV) follows a power-law probability distribution function; in contrast, stage II sleep durations follow a stretched exponential and stage I, and REM sleep durations follow an exponential function. These stage duration distributions show a gradually increasing departure from the exponential form with increasing depth of sleep toward a power-law type distribution for deep sleep, suggesting increasing complexity of regulation of deeper sleep stages. We also find a substantial number of REM to non-REM sleep transitions in humans, while this transition is reported to be virtually nonexistent in rats. The relative frequency of this REM to non-REM sleep transition is significantly lower in CFS patients than in controls, resulting in a significantly greater relative transition frequency of moving from both REM and stage I sleep to awake. Such an alteration in the transition pattern suggests that the normal continuation of sleep in light or REM sleep is disrupted in CFS. We conclude that dynamic transition analysis of sleep stages is useful for elucidating yet-to-be-determined human sleep regulation mechanisms with pathophysiological implications.
Keywords: sleep stage dynamics, relative transition frequency, duration distribution, power-law
it has long been known that humans display consolidated sleep based upon distinct sleep stages or states: waking, light sleep (stages I and II), deep sleep (stages III and IV), and rapid eye movement (REM) sleep (25). Historically, sleep architecture has been characterized by simple descriptive statistics, such as sleep efficiency (the percentage of time asleep relative to the time in bed), the number of awakenings, latencies to sleep onset and REM sleep, and total duration of each sleep stage. Surprisingly, more sophisticated analyses, including study of the nature of transition dynamics between these sleep stages have only recently been done. For instance, Yassouridis et al. (37) studied survival time statistics of a particular stage ended by other different stages with their event history analysis, a modification of the Cox regression analysis of life tables (9), by assuming an exponential P(t)~e−t/τ decay of sleep stage durations, where the P(t) is a probability distribution of durations t of a stage and the τ is a constant. Recently, Comte et al. (7) reported that duration statistics of REM sleep in rats take a power-law P(t)~t−α probability distribution, where the α is a constant, partially devaluing the exponential survival time analysis. Finding a power-law relation in REM sleep and waking durations rather than an exponential decay characteristic of random survival times (18, 19) points to the presence of an underlying complex mechanism governing sleep stage transitions; this idea is reinforced by the fact that power-law or heavy-tailed distributions of survival times are often observed in a variety of complex systems (29, 31).
Data do not exist as to whether the sleep stage transition patterns seen in rats (7) occur also in humans, and, in fact, what the physiological implications of these patterns might be. To determine these, we decided to study sleep stage transitions in healthy humans. In addition, we decided to extend our studies to include patients with chronic fatigue syndrome (CFS) (13). CFS is a medically unexplained illness characterized by persistent or relapsing fatigue lasting at least 6 mo, which substantially interferes with normal activity. In addition to severe fatigue, one of the most common and disturbing symptoms of CFS is unrefreshing sleep (26, 32). As the literature is unclear as to whether CFS patients have normal sleep or subtle abnormalities in polysomnography (1, 11, 26, 35, 36), we hypothesized that it may be possible to identify differences in the pattern of sleep stage transitions between patients and controls, possibly explaining the severe fatigue of this patient group.
METHODS
Subjects.
The subjects were 44 women: 22 healthy controls (age: 38 ± 8 years) and 22 CFS patients (age: 42 ± 8 years). None of these subjects had clinically evident sleep disorders in the form of restless leg syndrome or sleep-disturbed breathing (see Polysomnography). The patients fulfilled the 1994 case definition for CFS and thus had neither any medical explanation for their symptoms based on history, physical examination, and exclusionary blood tests, nor serious psychiatric diagnoses, including schizophrenia, eating disorders, substance abuse, or bipolar disorder (13). Controls all reported their health to be excellent or good and had normal exams and normal blood tests. Psychiatric diagnosis, according to DSM-IV criteria was made using the computerized version of the Diagnostic Interview Schedule (DIS-IV) (27). Because sleep-EEG changes are frequent symptoms of MDD (21), we used this diagnostic interview to confirm that no subject with MDD was included. To reduce variability additionally, menstruating subjects were all studied in the follicular phase of their menstrual cycles.
All of the subjects gave their informed consent, and their participation in this research was approved by the New Jersey Medical School’s Institutional Review Board. Following instructions to refrain from alcohol and caffeine ingestion and avoid engaging in prolonged and/or strenuous exercise in the daytime before study nights, the subjects underwent one night of polysomnographic recording in a quiet, shaded hospital room. The subjects went to bed at their usual bedtime and awoke the next morning between 7:15 and 8:00 AM.
Polysomnography.
Subjects underwent full nocturnal polysomnography consisting of EEG (C3/A2, O1/A2, and FZ/A2), electrooculogram, submental electromyogram (EMG), anterior tibialis EMG, a lead II ECG, thoracic and abdominal motion, airflow using a nasal cannula/pressure transducer and an oral thermistor, and pulse oximetry.
Sleep was scored every 30 s by a single scorer, according to standard criteria of Rechtschaffen and Kales (25). Sleep stages are usually scored by dividing a sleep recording into nonoverlapping epochs of equal duration, and a single stage is assigned to each epoch. If more than one sleep stage occurred within an epoch, the sleep stage that occupies the greatest portion of the epoch was scored as the stage of the whole epoch. An arousal was defined according to standard American Academy of Sleep Medicine criteria (2) as a return to alpha or fast-frequency EEG activity, well differentiated from the background, lasting at least 3 s but no more than 15 s. If alpha or fast-frequency EEG activity lasted at least 15 s within an epoch, the stage of the epoch was scored as “awake.”
Respiratory events were defined as any combination of apnea and hypopnea lasting at least 10 s or airflow, suggesting flow limitation lasting at least 10 s associated with an arousal. Apnea was defined as a reduction in airflow to less than 10% of waking level in the nasal cannula and absent airflow in the oral thermistor, and hypopnea was defined as a decrease in inspiratory airflow to <50% of waking levels. Flow limitation was considered to occur when there were two or more consecutive breaths (for an event duration generally ≥10 s) that had a flattened or nonsinusoidal appearance but had peak inspiratory amplitudes that did not meet the >50% reduction requirement of hypopnea. These events were required to end abruptly with a return to breaths with sinusoidal shape. Respiratory disturbance index (RDI) was defined as the total number of apneas, hypopneas, and flow limitation events per hour of sleep (3). The RDI, including the flow limitation events terminated by arousal has been previously shown to be essentially identical to the number of the esophageal manometry events terminated by arousal, which have been called respiratory effort-related arousals (3). On the basis of results by Ayappa et al. (3), it was assumed that an RDI >20 events/h was sufficient to account for excessive daytime sleepiness on the basis of sleep-disordered breathing, and the diagnosis of sleep-disturbed breathing was then made for patients and healthy controls with this finding. Periodic leg movements (PLM) were defined as four or more consecutive, involuntary leg movements/h during sleep, lasting 0.5–5.0 s, with an intermovement interval of 5–90 s. Patients were labeled as having periodic leg movements in sleep syndrome (PLMS) when the number of PLM/h (index) was greater than 5/h. Using these criteria, we confirmed that none of the subjects in this study had either abnormal RDI >20 or PLMS.
Stage transition analysis.
The relative stage transition frequencies were calculated based on two classification approaches: awake, REM, and non-REM sleep; and awake, REM sleep, and stages I, II, III, and IV sleep. The relative transition frequencies were calculated both by dividing the number of transitions between stages by the total number of all transitions (the global relative transition frequency) and by dividing the number of transitions from the specific stage to one of the other stages by the total number of the transitions from the specific stage to another stage (the normed relative transition frequency). Means (SD) of the number of stages analyzed per subject are shown in Table 1. Averages of relative transition frequencies in Figs. 1-4 and Tables 2 and 3 are shown using mean relative transition frequencies for the whole group.
Table 1.
Number of stages analyzed per subject
| Stage | Healthy | CFS |
|---|---|---|
| Awake | 23.4 (6.1) | 23.0 (12.2) |
| REM | 15.5 (6.6) | 7.6 (4.4) |
| non-REM | 36.3 (8.2) | 28.4 (12.9) |
| Stage I | 50.1 (17.1) | 36.4 (20.7) |
| Stage II | 53.0 (15.6) | 42.6 (14.7) |
| Stage III | 20.6 (11.3) | 19.9 (14.1) |
| Stage IV | 2.2 (3.4) | 3.2 (5.3) |
Values are presented as means (SD). REM, rapid eye movement; CFS, chronic fatigue syndrome.
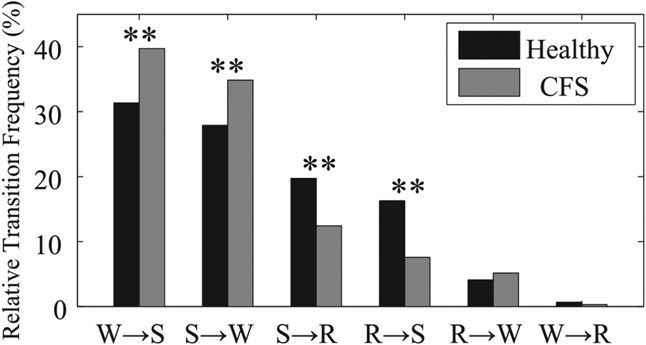
Fig. 1.
Global relative transition frequencies between awake (W), REM (R), and non-REM sleep (S) for healthy controls (black) and patients with chronic fatigue syndrome (CFS) (gray). **P < 0.01 from healthy controls.
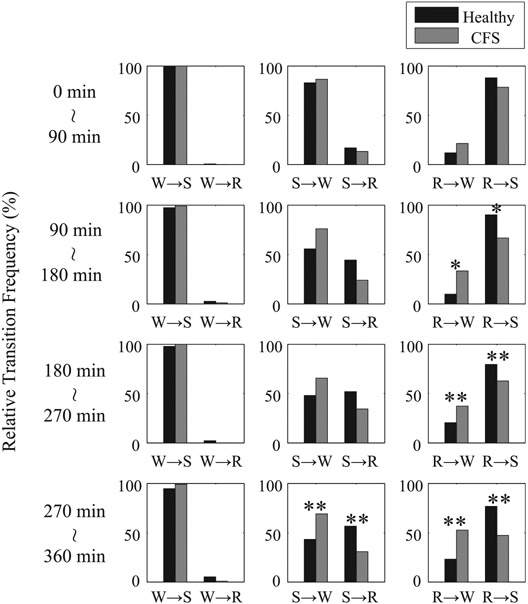
Fig. 4.
Normed relative transition frequencies between W, R, and S every 90 min from the first appearance of stage I sleep for healthy controls (black) and patients with CFS (gray). *P < 0.05 and **P < 0.01 from healthy controls.
Table 2.
Global relative transition frequencies between six stages
| Healthy |
CFS |
|||||||||||
|---|---|---|---|---|---|---|---|---|---|---|---|---|
| W | I | II | III | IV | R | W | I | II | III | IV | R | |
| W | 13.2 | 1.3 | 0.0 | 0.0 | 0.3 | 16.1 | 1.7 | 0.0 | 0.0 | 0.1 | ||
| I | 5.3 | 19.0 | 0.0 | 0.0 | 5.9 | 7.6 | 17.1 | 0.0 | 0.0 | 2.4† | ||
| II | 7.2 | 10.4 | 11.2 | 0.0 | 3.2 | 7.4 | 8.6 | 12.7 | 0.0 | 3.2 | ||
| III | 0.3 | 0.1 | 10.7 | 1.3 | 0.0 | 0.4 | 0.2 | 11.9 | 2.4 | 0.0 | ||
| IV | 0.0 | 0.0 | 0.1 | 1.2 | 0.0 | 0.2 | 0.0 | 0.1 | 2.1 | 0.0 | ||
| R | 1.9 | 6.6 | 0.9 | 0.0 | 0.0 | 2.3 | 2.3† | 1.1 | 0.0 | 0.0 | ||
Global relative transition frequencies between awake (W), REM sleep (R), and stages I, II, III and IV sleep for healthy controls and patients with CFS. Characters (W, I, II, III, IV, and R) represented in rows are preceding stages, and those in columns are subsequent stages of transitions. † P < 0.01 from healthy controls.
P < 0.01 from healthy controls.
Table 3.
Normed relative transition frequencies between six stages
| Healthy |
CFS |
|||||||||||
|---|---|---|---|---|---|---|---|---|---|---|---|---|
| W | I | II | III | IV | R | W | I | II | III | IV | R | |
| W | 89.4 | 8.6 | 0.0 | 0.0 | 2.0 | 89.8 | 9.3 | 0.2 | 0.0 | 0.8 | ||
| I | 17.5 | 63.1 | 0.0 | 0.0 | 19.4 | 28.0* | 63.0 | 0.1 | 0.0 | 8.9** | ||
| II | 22.6 | 32.4 | 35.0 | 0.0 | 10.0 | 23.2 | 27.0 | 39.9 | 0.0 | 9.9 | ||
| III | 2.2 | 0.7 | 86.3 | 10.8 | 0.0 | 2.7 | 1.4 | 79.9 | 16.0 | 0.0 | ||
| IV | 2.0 | 0.0 | 6.1 | 91.8 | 0.0 | 8.6 | 0.0 | 4.3 | 87.1 | 0.0 | ||
| R | 20.2 | 70.5 | 9.4 | 0.0 | 0.0 | 40.5** | 39.9** | 19.6 | 0.0 | 0.0 | ||
Normed relative transition frequencies between W, R, and stages I, II, III, and IV sleep for healthy controls and patients with CFS. Characters (W, I, II, III, IV, and R) represented in rows are preceding stages and those in columns are subsequent stages of transitions.
P< 0.05 and
P< 0.01 from healthy controls.
Sleep processes exhibit a rhythmic aspect of transitions, consisting of ~90-min sleep cycles, but this pattern may not be homogeneous throughout the course of the night (4, 6). Therefore, we also investigated the temporal dependence of transition statistics between awake, REM, and non-REM sleep by dividing sleep time into four sections every 90 min (0 to 90 min, 90 to 180 min, 180 to 270 min, and 270 to 360 min) from the first appearance of stage I sleep.
Statistical analysis.
Differences in variables between groups were assessed using a multivariate analysis of variance (MANOVA), including Bonferroni corrections for all subsequent a-posteriori tests, which was performed on relative transition frequencies for subjects who had nonzero-normed relative transition frequencies. Also, if differences did not show statistical significance on the multivariate level in MANOVA, they were then investigated on the univariate level by the nonpaired t-tests. Duration distributions for each sleep stage were analyzed by pooling those of all of the individuals in each group, that is, in that of healthy controls and in CFS patients. However, to assess interindividual differences in distributions, we used the Kolmogorov-Smirnov test for all of the pairs of individuals. Statistical significance was accepted when P < 0.05.
RESULTS
Relative transition frequencies.
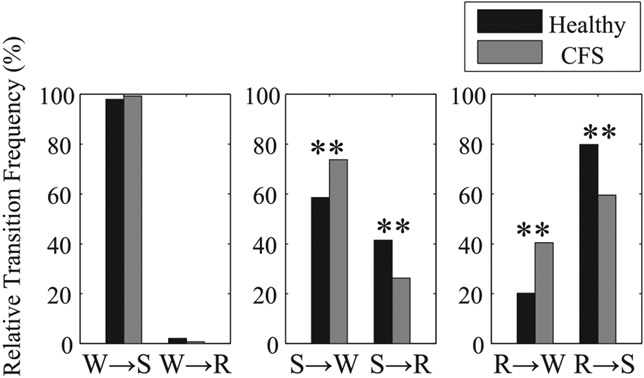
Global and normed relative frequencies of transitions between three sleep stages (awake, REM, and non-REM sleep) are shown in Fig. 1 and Fig. 2, respectively. The mean global relative transition frequencies of healthy individuals from REM sleep to awake (R → W) and from REM to non-REM sleep (R → S) are 4.1% and 16.3%, respectively. Transitions from awake to REM sleep (W → R), which is one of the symptoms of narcolepsy, rarely occur in either healthy controls (0.7%) or patients with CFS (0.3%). When comparing CFS patients with healthy controls, both the global and normed relative frequencies in transitions from non-REM sleep to awake (S → W) are significantly greater in CFS patients (34.8% and 73.7%, respectively) than in healthy controls (27.9% and 58.6%, respectively). In addition, although the global relative frequency of transitions from REM sleep to awake (R → W) does not differ significantly between groups, its normed relative frequency is significantly greater in CFS patients than in healthy controls. Both the global and normed relative frequencies in transitions between REM and non-REM sleep (R ↔ S) are significantly greater in healthy controls than in patients with CFS.
Fig. 2.
Normed relative transition frequencies between W, R, and S for healthy controls (black) and patients with CFS (gray). **P < 0.01 from healthy controls.
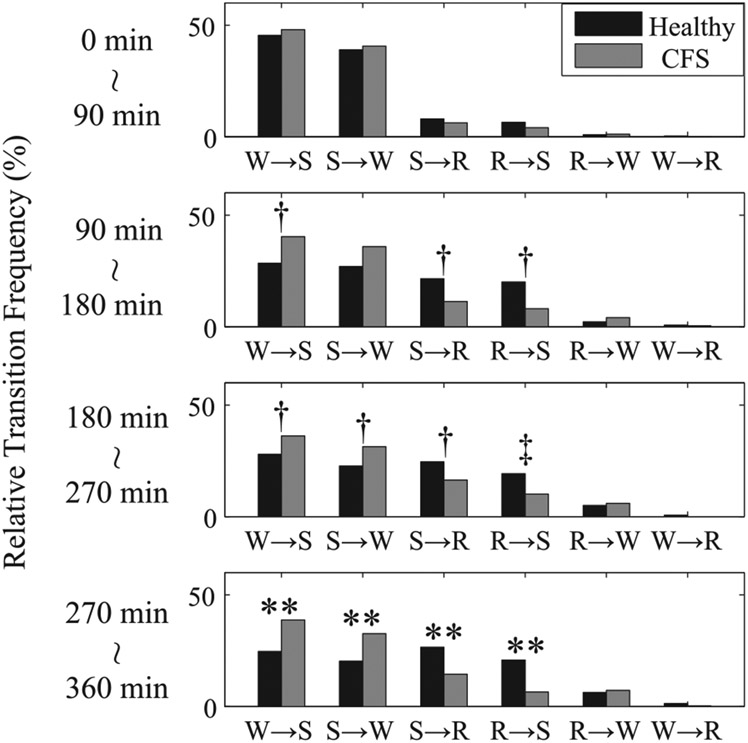
As for the temporal dependence of transition statistics between awake, REM, and non-REM sleep, none of the global relative transition frequencies from 0 to 90 min differed significantly between healthy controls and CFS patients. However, as the night-time advances, the global relative transition frequencies between awake and non-REM sleep (W ↔ S) are greater in CFS patients than in healthy controls, and those between non-REM and REM sleep (S ↔ R) are greater in healthy controls than in patients with CFS, and both of these were significantly different by MANOVA for 270 to 360 min and in addition by nonpaired t-test for 90 to 180 min and 180 to 270 min (Fig. 3). In addition, while the normed relative frequencies in transitions following non-REM sleep (S → W and S → R) and from REM to non-REM sleep (R → S) show the same tendency as the global transitions, the normed relative frequencies in the transition from REM sleep to awake (R → W) are different from the global relative frequency, being much greater with a statistically significant difference in patients with CFS than in healthy controls as the night advances (Fig. 4).
Fig. 3.
Global relative transition frequencies between W, R, and S every 90 min from the first appearance of stage I sleep for healthy controls (black) and patients with CFS (gray). **P < 0.01 from healthy controls by MANOVA. †P < 0.05 and ‡P < 0.01 from healthy controls by nonpaired t-test.
Global and normed relative frequencies of transitions between six sleep stages (awake, REM sleep, and stages I, II, III, and IV sleep) are shown in Table 2 and Table 3, respectively. Both in the global and normed relative transition frequencies between awake, REM sleep, and stages I–IV sleep, the transitions between stage I and REM sleep (stage I ↔ REM sleep) are significantly greater in healthy controls than in patients with CFS. In the normed relative frequencies, the transitions from stage I and REM sleep to awake (I → W and R → W, respectively) are significantly greater in patients with CFS than in healthy controls. The increase in these transitions to the awake stage suggests the existence of disturbed sleep for patients when they are in these sleep phases.
Duration distributions.
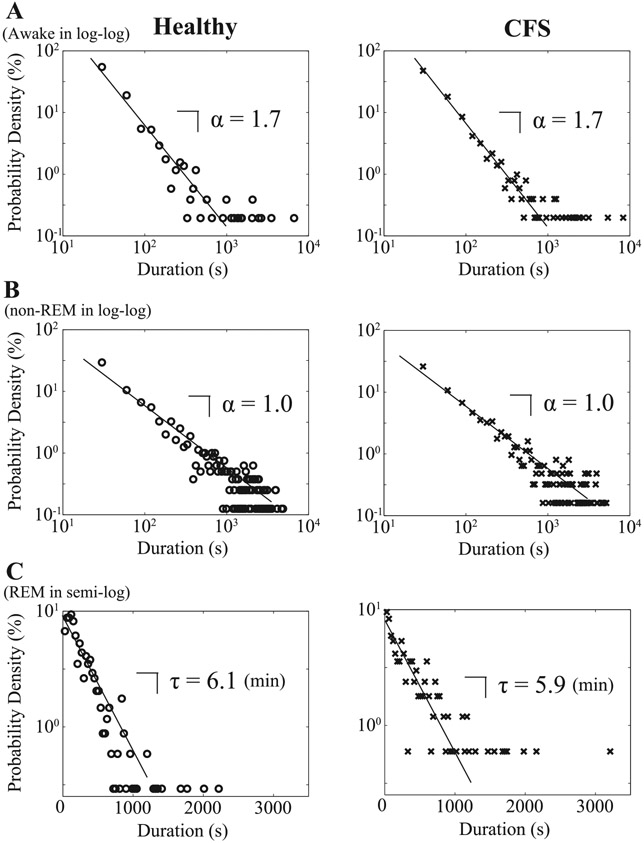
Distributions of durations of three sleep stages are shown in Fig. 5. To verify that the data from individual recordings for awake, REM, and non-REM sleep periods are respectively drawn from the same probability distribution, we applied the nonparametric Kolmogorov-Smirnov test and compared the probability densities pairwise between subjects for all individual sleep stages. For awake and non-REM sleep periods, the percentages of individual pairs for which the null hypothesis of identical distribution is rejected, seen in Table 4, are fairly low. This suggests that both in the case of awake and non-REM sleep, duration periods are respectively drawn from the same distributions for each subject, with the data from all of the individuals collapsing onto respective, unique distribution forms (Fig. 5A for awake and Fig. 5B for non-REM sleep). For REM sleep periods, such percentages of the positive Kolmogorov-Smirnov test are slightly higher (21.6% for healthy controls and 22.8% for CFS patients). This leads to a spread of plots, particularly for longer REM sleep durations (Fig. 5C), although shorter REM sleep periods than 1,000 s seem to follow a unique distribution form. Consequently, the probability densities for awake and non-REM sleep durations follow a power-law (linear on the semi-log plots; A, B), while those for REM sleep follow an exponential function (linear on the semi-log plot; C), which is characteristic of random processes, for both healthy controls and patients with CFS (Fig. 5). Linear fitting was performed on the data of healthy controls and patients with CFS to calculate the coefficients that characterize the behavior of the power-law or exponential function. The power-law exponent, which is estimated as the slope of the double logarithmic plot, is equal to α = 1.7 for awake and α = 1.0 for non-REM sleep for both healthy controls and patients with CFS. The time constant, which is estimated as the slope of the semilogarithmic plot, is equal to τ = 6.1 min for healthy controls and τ = 5.9 min for patients with CFS for REM sleep.
Fig. 5.
Distributions for durations of sequential runs for awake and non-REM sleep in double logarithmic plot (A and B), and REM sleep in semi-logarithmic plot (C) for healthy controls (○) and patients with CFS (x).
Table 4.
The percentage of individual pairs with positive Kolmogorov-Smirnov test
| Stage | Healthy, % | CFS, % |
|---|---|---|
| Awake | 2.6 | 1.7 |
| REM | 21.6 | 22.9 |
| non-REM | 4.3 | 8.7 |
| Stage I | 1.7 | 13.9 |
| Stage II | 21.2 | 12.6 |
| Stage III | 7.8 | 10.5 |
| Stage IV | 13.9 | 4.4 |
The percentage of individual pairs for which the null hypothesis is rejected for each stage for healthy controls and patients with CFS.
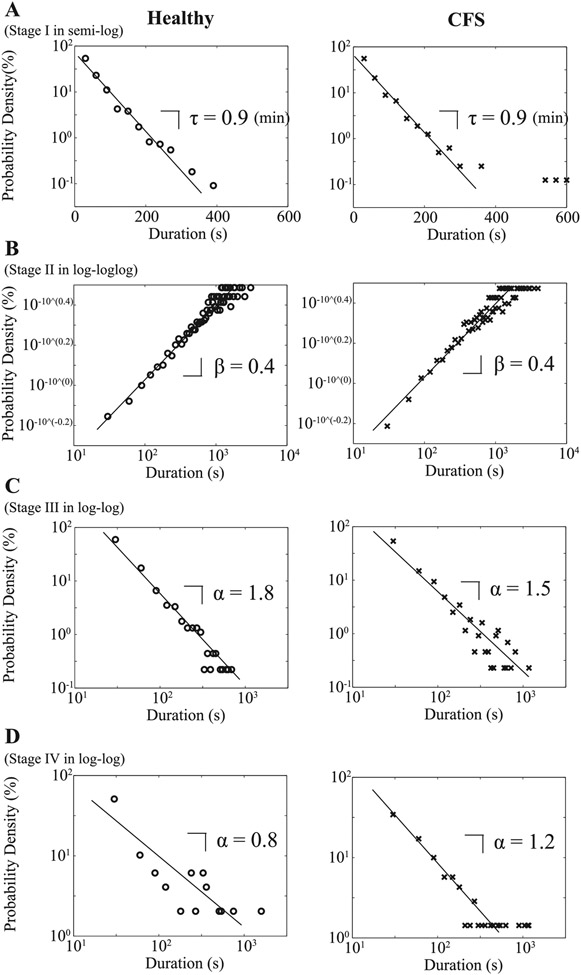
As for the probability densities of non-REM sleep durations, those for deep sleep (stages III and IV) follow a power-law function, with the power-law exponent α = 1.8 for stage III sleep (Fig. 6C) and α = 0.8 for stage IV sleep (Fig. 6D) for healthy controls and α = 1.5 for stage III sleep (Fig. 6C) and α = 1.2 for stage IV sleep (Fig. 6D) for patients with CFS. The probability density of durations of stage I sleep takes an exponential function with a characteristic timescale τ = 0.9 min for both groups (Fig. 6A) and that of stage II sleep seems to obey a stretched exponential function P(t)~e−(t/τ)β, where the log vs. log log plot exhibits a linear relationship (Fig. 6B). The value of the slope is equal to β = 0.4 for both groups. By the Kolmogorov-Smirnov test for each of the stages I–IV sleep, in most cases, we are not able to reject the null hypothesis that duration distributions for each subject are drawn from the same distribution for each stage; the percentage of positive Kolmogorov-Smirnov test is relatively high (21.1%) only for stage II sleep in healthy controls (Table 4).
Fig. 6.
Distributions for durations of sequential runs for stage I sleep in semilogarithmic plot (A), stage II sleep in log vs. log log plot (B), and stage III sleep, and stage IV sleep in double logarithmic plots (C and D) for healthy controls (○) and patients with CFS (x).
DISCUSSION
Sleep dynamics emerge from complex interactions between neuronal populations in many brain regions (14, 15, 20, 24, 28). Annotated sleep stages from EEG recordings could potentially provide a noninvasive means to obtain valuable insights into the mechanisms of these interactions (8) and ultimately into the very nature of sleep regulation. However, to date, sleep stage analysis has been quite limited, only recently expanding the scope of the traditional descriptive statistics to more dynamic assessments evaluating transitions between sleep stages (7, 18, 19) and temporal pattern of relative transition frequencies between different stages (37).
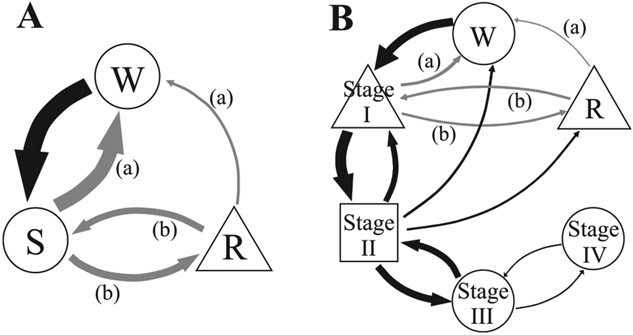
In the present study, we elucidate for the first time detailed duration and dynamic transition statistics among sleep stages for healthy humans and patients with CFS, who have significant sleep complaints and evidence of disturbed sleep by reduced sleep efficiency (12, 23, 30, 34). The findings are summarized in Fig. 7. In the three-stage model (Fig. 7A), both awake and non-REM sleep durations possess power-law distributions and large relative transition frequencies between them, suggestive of complex underlying mechanisms responsible for these transitions. By contrast, REM sleep durations obey an exponential function associated with random survival times. In healthy subjects, the transitions between sleep stages (non-REM ↔ REM sleep) dominate, indicating that, once asleep, transitions to the awake stage are less likely than in CFS patients. In contrast, CFS patients have the propensity to awaken, especially during the later hours of sleep (Figs. 3 and 4). This finding may explain the patients’ common complaint of poor sleep quality with resulting daytime fatigue, because the normal continuation of sleep after either non-REM or REM sleep is disrupted. In addition, the pattern in CFS is associated with a selective increase in the REM sleep to awake transitions, which may contribute further to their reports of poor sleep.
Fig. 7.
A diagram of relative transition frequencies between each sleep stage and functional form of distributions of durations of sequential runs for each stage in healthy controls. A: a three stage model: W, R, and S. B: a six stage model: W, R, and stages I, II, III, and IV sleep. Arrow thickness represents the ratio of global relative transition frequencies. Gray arrows indicate that the normed relative transition frequency is significantly greater (a) and smaller (b) in CFS patients than in healthy controls. A circle, triangle, or square indicates that their distributions follow a power-law, an exponential, and a stretched exponential function, respectively.
The results for the six-stage model (Fig. 7B) are qualitatively the same as those for the three-stage model in that the relative frequency of the REM to stage I sleep transition is significantly lower in the patients than in the controls, resulting in a significantly greater REM sleep to awake, as well as greater stage I sleep to awake relative transition frequencies. Furthermore, the six-stage model reveals that the power-law nature of non-REM sleep durations above is ascribed to that of deep sleep (stages III and IV) durations, while the durations of stage I sleep take an exponential function and those of stage II sleep obey a stretched exponential form characteristic of a multifactorial decay (31). The duration distributions show a gradually increasing departure from the exponential form with increasing depth of sleep, toward a strong tail, power-law type distribution for deep sleep, suggesting increasing complexity of regulation of deeper sleep stages. These results were robust against changing the length of window for sleep stage scoring; we confirmed that the results remained qualitatively the same when the length of the scoring window was increased up to 90 s (not shown).
Such results for humans contrast with those reported for rats in two ways. First, the mean global relative transition frequencies of healthy individuals from REM sleep to awake (R → W; 4.1%) and from REM to non-REM sleep (R → S; 16.3%) are lower and higher, respectively, than those reported in rats (13.2% and 0.2%, respectively) (8). Second, the probability densities for non-REM sleep durations in humans follow a power-law, while those for REM sleep follow an exponential function. These observations for humans are different from those shown in rats (7), where non-REM and REM sleep durations follow exponential and power-law functions, respectively. We thus suggest that the acquisition of an ability to continue to sleep after REM periods and the increased complexity (power-law nature) of a system governing non-REM sleep characterize human sleep.
Over the course of the many decades, sleep researchers have used simple descriptive statistics to characterize and summarize the total duration of sleep. While this methodology has been extremely useful in defining the abnormalities that currently constitute sleep pathology, this approach does not explain specific patient complaints of disturbed and unrefreshing sleep. However, a dynamic analysis complements the classical approach by allowing an analysis of transition dynamics between sleep stages. In 2002, Lo et al. (19) studied the dynamics of two-state asleep-awake transitions during sleep in humans, focusing on the duration distributions, and found entirely different behavior in the periods “awake” and “asleep.” Subsequently, Lo et al. (18) expanded their investigations in humans to other mammalian species, but their studies were confined to only two-state (“asleep” and “awake”) duration distributions. Comte et al. (7) investigated rats’ sleep dynamics, focusing on the relative transition frequencies and duration distributions of three sleep stages (awake, REM, and non-REM sleep). In the present study, we have investigated detailed transition dynamics in humans for six stages (awake, REM sleep, and stages I, II, III, and IV sleep), the entire set of sleep stages in humans. Each sleep stage is characterized by distinct features as revealed by our analysis. Therefore, these features likely reflect stage-specific neural activities (10, 14, 16, 22), and theories explaining different duration or survival time distributions (31) might give deeper insights into the underlying mechanisms governing sleep stage regulations.
Diagnostic criteria for CFS include “unrefreshing sleep” as one of the eight associated symptoms (13), and it is indeed one of the commonest symptoms in CFS (5). Some studies have revealed reduced sleep efficiency, prolonged sleep onset, a reduction in REM sleep, daytime napping, a lower percentage of stage IV sleep and alpha-intrusion during non-REM sleep in CFS (12, 17, 23, 30, 33). However, these results are not consistent between studies or subjects, as pointed out in review articles by Fischer (11) and Afari and Buchwald (1). Reeves et al. (26) have even concluded that there are no statistically significant differences in sleep parameters between CFS patients and controls.
In contrast, our approach shows robust differences in sleep dynamics between patients and controls. The results obtained from our analysis of relative transition frequencies between sleep stages indicate that the influence of factors interfering with the continuation of REM sleep and non-REM sleep (stage I) may be different between healthy controls and CFS patients, while the fundamental mechanisms determining durations of each sleep stage are similar. In other words, CFS patients might not have a dysfunction in systems maintaining each sleep stage, because the distributions of durations of each stage are not different between healthy controls and CFS patients. Instead, they may have a disturbed switching mechanism governing sleep stage transitions, because the relative frequencies in transition between some stages do differ between healthy controls and CFS patients. Some studies have used descriptive statistics to demonstrate a relation between subjective fatigue and periods of wakefulness or poorer sleep efficiency in CFS (23, 30). Our data suggest that the major complaint of CFS patients of “unrefreshing sleep” may be derived from this sudden arousal from both stage I and especially from REM sleep, which is a characteristic of “dreaming sleep.”
Perspectives and Significance
We find that the dynamic transitions of sleep stages are remarkably rich, with asymmetry and nonuniformity of relative transition frequencies, and differences between species (rats and humans). Using this approach should be useful for elucidating as yet unappreciated mechanisms of human sleep regulation and its evolutionary perspective, as well as uncovering processes that might lead to disease. Theoretical modeling of sleep stages with known survival time distributions and dynamic transitions among them would be promising for future research.
ACKNOWLEDGMENTS
This work was supported, in part, by National Institutes of Health Grant AI-54478.
REFERENCES
- 1.Afari N, Buchwald D. Chronic fatigue syndrome: a review. Am J Psychiatry 160: 221–236, 2003. [DOI] [PubMed] [Google Scholar]
- 2.American Sleep Disorders Association. EEG arousals: scoring rules and examples: a preliminary report from the Sleep Disorders Atlas Task Force of the American Sleep Disorders Association. Sleep 15:173–184, 1992. [PubMed] [Google Scholar]
- 3.Ayappa I, Norman RG, Krieger AC, Rosen A, O’Malley RL, Rapoport DM. Non-invasive detection of respiratory effort-related arousals (RERAs) by a nasal cannula/pressure transducer system. Sleep 23:763–771, 2000. [DOI] [PubMed] [Google Scholar]
- 4.Born J, Hansen K, Marshall L, Mölle M, Fehm HL. Timing the end of nocturnal sleep. Nature 397: 29–30, 1999. [DOI] [PubMed] [Google Scholar]
- 5.Brimacombe M, Helmer D, Natelson BH. Clinical differences exist between patients fulfilling the 1988 and 1994 case definitions of chronic fatigue syndrome. J Clin Psychol Med Settings 9: 309–314, 2002. [Google Scholar]
- 6.Carskadon MA, Dement WC. Normal human sleep: an overview. In: Principles and Practice of Sleep Medicine, edited by Kryger MH, Roth T, Dement WC. Elsevier Saunders, Philadelphia, PA, 4th ed., 2005, p. 13–23. [Google Scholar]
- 7.Comte JC, Ravassard P, Salin PA. Sleep dynamics: a self-organized critical system [Online]. Phys Rev E Stat Nonlin Soft Matter Phys 73: 056127, 2006. [DOI] [PubMed] [Google Scholar]
- 8.Comte JC, Schatzman M, Ravassard P, Luppi PH, Salin PA. A three states sleep-waking model. Chaos Solitons Fractals 29: 808–815, 2006. [Google Scholar]
- 9.Cox DR. Regression models and life-tables. J R Stat Soc B 34:187–220, 1972. [Google Scholar]
- 10.De Gennaro L, Ferrara M. Sleep spindles: an overview. Sleep Med Rev 7: 423–440, 2003. [DOI] [PubMed] [Google Scholar]
- 11.Fischer B. Review of clinical and psychobiological dimensions of the chronic fatigue syndrome: differentiation from depression and contribution of sleep dysfunctions. Sleep Med Rev 3:131–146, 1999. [DOI] [PubMed] [Google Scholar]
- 12.Fischer B, Le Bon O, Hoffmann G, Cluydts R, Kaufman L, De Meirleir K. Sleep anomalies in the chronic fatigue syndrome. A comorbidity study. Neuropsychobiology 35:115–122, 1997. [DOI] [PubMed] [Google Scholar]
- 13.Fukuda K, Straus SE, Hickie I, Sharpe MC, Dobbins JG, Komaroff A, and International Chronic Fatigue Syndrome Study Group. The chronic fatigue syndrome: a comprehensive approach to its definition and study. Ann Intern Med 121: 953–959, 1994. [DOI] [PubMed] [Google Scholar]
- 14.Hobson JA, Lydic R, Baghdoyan HA. Evolving concepts of sleep cycle generation: from brain centers to neuronal populations. Behav Brain Sci 9: 371–448, 1986. [Google Scholar]
- 15.Jones BE. Paradoxical REM sleep promoting and permitting neuronal networks. Arch Ital Biol 142: 379–396, 2004. [PubMed] [Google Scholar]
- 16.Koyama Y, Hayaishi O. Firing of neurons in the preoptic/anterior hypothalamic areas in rat: its possible involvement in slow wave sleep and paradoxical sleep. Neurosci Res 19: 31–38, 1994. [DOI] [PubMed] [Google Scholar]
- 17.Krupp LB, Jandorf L, Coyle PK, Mendelson WB. Sleep disturbance in chronic fatigue syndrome. J Psychosom Res 37: 325–331, 1993. [DOI] [PubMed] [Google Scholar]
- 18.Lo CC, Chou T, Penzel T, Scammell TE, Strecker RE, Stanley HE, Ivanov PC. Common scale-invariant patterns of sleep-wake transitions across mammalian species. Proc Natl Acad Sci USA 101: 17545–17548, 2004. [DOI] [PMC free article] [PubMed] [Google Scholar]
- 19.Lo CC, Nunes Amaral LA, Havlin S, Ivanov PC, Penzel T, Peter JH, Stanley HE. Dynamics of sleep-wake transitions during sleep. Europhys Lett 57: 625–631, 2002. [Google Scholar]
- 20.Luppi PH, Gervasoni D, Boissard R, Verret L, Goutagny R, Peyron C, Salvert D, Leger L, Barbagli B, Fort P. Brainstem structures responsible for paradoxical sleep onset and maintenance. Arch Ital Biol 142: 397–411, 2004. [PubMed] [Google Scholar]
- 21.Maes M, Lambrechts J, Bosmans E, Jacobs J, Suy E, Vandervorst C, De Jonckheere C, Minner B, Raus J. Evidence for a systemic immune activation during depression: results of leukocyte enumeration by flow cytometry in conjunction with monoclonal antibody staining. Psychol Med 22: 45–53, 1992. [DOI] [PubMed] [Google Scholar]
- 22.McCarley RW. Neurobiology of REM and NREM sleep. Sleep Med 8: 302–330, 2007. [DOI] [PubMed] [Google Scholar]
- 23.Morriss R, Sharpe M, Sharpley AL, Cowen PJ, Hawton K, Morriss J. Abnormalities of sleep in patients with the chronic fatigue syndrome. BMJ 306:1161–1164, 1993. [DOI] [PMC free article] [PubMed] [Google Scholar]
- 24.Pace-Schott EF, Hobson JA. The neurobiology of sleep: genetics, cellular physiology and subcortical networks. Nat Rev Neurosci 3: 591–605, 2002. [DOI] [PubMed] [Google Scholar]
- 25.Rechtschaffen A, Kales A. A manual of standardized terminology, techniques and scoring system for sleep stages of human subjects. Washington, DC: U.S. Government Printing Office, 1968. [DOI] [PubMed] [Google Scholar]
- 26.Reeves WC, Heim C, Maloney EM, Youngblood LS, Unger ER, Decker MJ, Jones JF, Rye DB. Sleep characteristics of persons with chronic fatigue syndrome and non-fatigued controls: results from a population-based study [Online]. BMC Neurol 6: 41, 2006. [DOI] [PMC free article] [PubMed] [Google Scholar]
- 27.Robins LN, Cottler LB, Bucholz KK, Compton WM, North CS, Rourke KM. Diagnostic interview schedule for the DSM-IV (DIS-IV) 2000, version III, revised (DIS-III-R). St. Louis, MO: Washington University. [Google Scholar]
- 28.Saper CB, Chou TC, Scammell TE. The sleep switch: hypothalamic control of sleep and wakefulness. Trends Neurosci 24:726–731, 2001. [DOI] [PubMed] [Google Scholar]
- 29.Sethna JP, Dahmen KA, Myers CR. Crackling noise. Nature 410: 242–250, 2001. [DOI] [PubMed] [Google Scholar]
- 30.Sharpley A, Clements A, Hawton K, Sharpe M. Do patients with “pure” chronic fatigue syndrome (neurasthenia) have abnormal sleep? Psychosom Med 59: 592–596, 1997. [DOI] [PubMed] [Google Scholar]
- 31.Sornette D. Critical phenomena in natural sciences: chaos, fractals, self-organization and disorder: concepts and tools (2nd ed.). Berlin, Germany: Springer, 2004. [Google Scholar]
- 32.Unger ER, Nisenbaum R, Moldofsky H, Cesta A, Sammut C, Reyes M, Reeves WC. Sleep assessment in a population-based study of chronic fatigue syndrome. BMC Neurol 4: 6, 2004. [DOI] [PMC free article] [PubMed] [Google Scholar]
- 33.Van Hoof E, De Becker P, Lapp C, Cluydts R, De Meirleir K. Defining the occurrence and influence of alpha-delta sleep in chronic fatigue syndrome. Am J Med Sci 333: 78–84, 2007. [DOI] [PubMed] [Google Scholar]
- 34.Vassallo CM, Feldman E, Peto T, Castell L, Sharpley AL, Cowen PJ. Decreased tryptophan availability but normal post-synaptic 5-HT2c receptor sensitivity in chronic fatigue syndrome. Psychol Med 31: 585–591, 2001. [DOI] [PubMed] [Google Scholar]
- 35.Watson NF, Jacobsen C, Goldberg J, Kapur V, Buchwald D. Subjective and objective sleepiness in monozygotic twins discordant for chronic fatigue syndrome. Sleep 27: 973–977, 2004. [DOI] [PubMed] [Google Scholar]
- 36.Watson NF, Kapur V, Arguelles LM, Goldberg J, Schmidt DF, Armitage R, Buchwald D. Comparison of subjective and objective measures of insomnia in monozygotic twins discordant for chronic fatigue syndrome. Sleep 26: 324–328, 2003. [DOI] [PubMed] [Google Scholar]
- 37.Yassouridis A, Steiger A, Klinger A, Fahrmeir L. Modelling and exploring human sleep with event history analysis. J Sleep Res 8: 25–36, 1999. [DOI] [PubMed] [Google Scholar]


