

Abstract
Background:
Although there is consensus that having a “high-enough” dose of buprenorphine (BUP-NX) or methadone is important for reducing relapse to opioid use, there is debate about what this dose is and how it should be attained. We estimated the extent to which different dosing strategies would affect risk of relapse over 12 weeks of treatment, separately for BUP-NX and methadone.
Methods:
This was a secondary analysis of three comparative effectiveness trials. We examined four dosing strategies: 1) increasing dose in response to participant-specific opioid use, 2) increasing dose weekly until some minimum dose (16mg BUP, 100mg methadone) was reached, 3) increasing dose weekly until some minimum and increasing dose in response to opioid use thereafter (referred to as the hybrid strategy), and 4) keeping dose constant after the first 3 weeks of treatment. We used a longitudinal sequentially doubly robust estimator to estimate contrasts between dosing strategies on risk of relapse.
Results:
For BUP-NX, increasing dose following the hybrid strategy both resulted in the lowest risk of relapse. For methadone, holding dose constant resulted in greatest risk of relapse; the other three strategies performed similarly. For example, the hybrid strategy reduced week 12 relapse risk by 13% (RR: 0.87, 95%CI: 0.83–0.95) and by 20% (RR: 0.80, 95%CI: 0.71–0.90) for BUP-NX and methadone respectively, as compared to holding dose constant.
Conclusions:
Doses should be targeted toward minimum thresholds and, in the case of BUP-NX, raised when patients continue to use opioids.
Keywords: opioid use disorder, buprenorphine, methadone, dynamic dosing, dynamic treatment, adaptive treatment, personalized medicine
Introduction
Opioid use disorder (OUD) continues to be a leading cause of morbidity and mortality in the United States (US),1–4 and estimates suggest that its prevalence has increased during recent years of the Covid-19 pandemic.5,6 The most effective treatments for OUD are long-term treatment with buprenorphine-naloxone (BUP-NX), methadone, or extended-release injection naltrexone (XR-NTX).7 While on long-term medication for OUD, risk of death is estimated to decline by 50%, but remains unacceptably high given the approximately 20-fold increased risk of early death faced by those with OUD.8 For methadone and BUP-NX, dose and dose adjustment are likely important factors in treatment effectiveness (dose is fixed for XR-NTX), but clinicians are tasked with making these decisions with little or no quantitative, evidence-based guidance.
Evidence suggests that dose is important for reducing risk of relapse and dropping out of treatment. Higher BUP-NX dosages more fully occupy opioid receptors9,10 thereby blocking positive reinforcement of opioid use.11,12 Higher BUP-NX dosages may reduce risk of drug use while on treatment13 and may reduce risk of overdose.12 Current guidance recommends BUP-NX dose of at least 16mg,14 and trials have found that such a threshold is important for suppressing illicit opioid use during treatment.15 However, treatment guidance currently discourages doses >24mg.14
Higher methadone doses (i.e., above 100mg daily) have been shown to provide better control of withdrawal symptoms between doses, likely through inducing tolerance. Better control of withdrawal symptoms reduces the reinforcing effects of illicit opioids, which may ultimately reduce opioid use.16–19 Current guidance recommends methadone dosage of at least 60mg, and more typically, 80–120mg.14 However, the effectiveness of dose increases beyond 100mg have not been well-studied.
Despite evidence of the importance of a “high enough” dose, underdosing for both BUP-NX and methadone treatment is common in practice20 and implicated as contributing to suboptimal OUD treatment outcomes.21 For methadone, although average dose has increased over time, in 2017, more than 40% of patients were still receiving methadone doses <80 mg.21 Clinicians and patients may be reluctant to increase doses due to concern about side effects (which can lead to medication discontinuation), or stigma attached to buprenorphine or methadone treatment (e.g., some providers equating MOUD with illicit substance use),22 resulting in a treatment philosophy that the smallest possible dose should be used. Further, some patients can be successfully treated on doses that are far lower than the maximum,14 and patients can often do well being maintained on a lower dose after the initial treatment period.23,24
Although there is some consensus on minimum dosage for methadone and BUP-NX, there is less consensus on how these minimum dosages should be reached (e.g., a dose increase schedule) and if/how dose should be tailored after the minimum is reached.14 One recommended dosing strategy is to increase dose in response to individual-level opioid use until some maximum is reached, the rationale being that illicit use of opioids while in treatment, especially early in treatment,25 is associated with risk of relapse.26,27 Rudolph et al., 202128 recently demonstrated evidence in favor of such a dosing strategy, finding that increasing BUP-NX dose in response to an individual’s opioid use reduced risk of relapse to OUD by 13% relative to a treatment strategy where BUP-NX dose remained constant.
Another recommended strategy is to increase dose early in treatment until some minimum threshold dose is reached, to more fully occupy opioid receptors (in the case of buprenorphine) and suppress withdrawal symptoms (in the case of methadone), and prevent opioid use early in treatment. Studies suggest that high buprenorhpine doses (e.g., 32 mg) may be necessary for full or near-full receptor occupancy and, consequently, clinical effect.9 However, this upper range has not been tested; typical clinical doses are 10–18 mg.20 Studies also suggest that higher methadone doses (e.g., >100 mg17,29 or even 120–700 mg30) provide better agonist effects and lowers risk of relapse.
In summary, although there is consensus that having a “high-enough dose” is important for reducing relapse to opioid use, there is limited consensus on what this dose is or how it should be attained. While dose comparison questions can be addressed by randomized trials, such trials are di cult and expensive to conduct, and as a consequence, are rare. A recommended alternative strategy is to harness the naturalistic variation in dose and dose adjustments in relation to outcomes (in this case, abstinence from versus use of illicit opioids), in existing data to predict outcomes under different hypothetical dosing strategies.31,32 We do so here, using existing data across three clinical trials with natural variability in methadone and BUP-NX dose/dose adjustments. We use a sequentially doubly robust and efficient estimator of longitudinal, time-varying treatments33 to estimate the difference in risk of relapse under four dosing strategies, separately for BUP-NX and methadone: 1) where dose is increased in response to participant-specific opioid use, 2) where dose is increased weekly until some minimum threshold dose is reached, 3) where dose is increased until some minimum threshold dose is reached and then increased in response to opioid use thereafter, and 4) where dose is held constant after week 3 of treatment. Thus, we provide empirical evidence for the extent to which different dosing strategies for the treatment of OUD could reduce risk of treatment drop out and relapse.
Methods
Data and Sample.
We use data harmonized across three large randomized trials for OUD treatment that were part of the NIDA Clinical Trials Network (CTN): CTN0027,23,34 Phase 2 of CTN0030,35 and CTN005136 (we exclude the extended release naltrexone arm of this trial). Data was discretized into weekly increments for this analysis. All trials included patient treatment and monitoring over 12 weeks. Further details of the trials and their exclusion/inclusion criteria are in the Appendix.
We used data from N=1,863 participants who initiated treatment (by receiving at least one dose) with either BUP-NX or methadone. The Institutional Review Boards at the New York State Psychiatric Institute and Columbia University determined this secondary analysis of de-identified data to be non-human subject research.
Measures.
BUP-NX dose.
BUP-NX was used in all three trials, dispensed for participants to self-administer sublingually daily. Over the first 12 weeks of treatment, it was dispensed at weeks 0, 1, 2, 3, 4, 6, 8, 10, and 12 in CTN0051, dispensed weekly in CTN0030, and dispensed either daily or 3 times weekly in CTN0027. Dose and dose adjustment were based on clinical judgement in all three trials. In all trials, dose ranged from 2–32mg and could be increased in 2mg increments. In CTN0027 and CTN0051, clinicians were encouraged to increase dose in response to opioid use or symptoms of craving or withdrawal,23,36 but this guidance was not always followed. In CTN0030, clinicians were encouraged to achieve rapid dose stabilization following induction.35 Maximum daily dose for an individual during the outcome time-frame and prior to outcome occurrence was as follows by trial. For CTN0027: range=2–32mg, median=24mg, interquartile range (IQR)=16–32mg. For CTN0030: range=4–32mg, median=16mg, IQR=14–24mg. For CTN0051: range=4–32mg, median=16mg, IQR=12–20mg. We used the maximum dose reported for the week.
Methadone dose.
Methadone treatment occurred in CTN0027 and was dispensed daily with dose and dose adjustment based on clinical judgement. Study clinicians were instructed to have a maximum dose on the first day of treatment of no more than 40mg, to increase in 10mg increments, and to increase dosage in response to opioid use or symptoms of craving or withdrawal.23 However, as was the case with buprenorphine, there was variability in the extent to which this guidance was followed. Maximum daily dose for an individual was: range = 10–270mg, median=75mg, IQR 60–100mg. As with BUP-NX, we used the maximum dose reported for the week.
Outcome.
The outcome was time to opioid relapse, occurring between 20 days post-randomization and prior to the end of 12 weeks of follow-up (the initial 20 days were excluded to preclude a relapse determination on the basis of opioids used for medically managed withdrawal (methadone, buprenorphine)). Relapse was operationalized as occurring on the last day of 7 days of daily use of non-study opioids, or on the first day of the fourth consecutive week of at-least-once-weekly use, where use is defined based on 1) urine drug screens, 2) Timeline Followback interviews,37 3) missed visits, and 4) refused urine screens, with additional details below.
As in the primary outcome papers for these trials, missed visits or refused urine samples were considered as positive for opioid use.24,34,36 Although this likely introduces some measurement error, research suggests is a reasonable assumption.24,38–40 For example, Hser et al., 201739 showed that individuals’ long-term treatment participation trends are inversely related to their long-term opioid use trends. Weiss et al., 201124 and Weiss et al., 201540 showed that even long after the conclusion of the clinical trials, the majority of those not in treatment regularly use opioids. In Phase 1 of CTN0027, among those who were briefly treated (for 4 weeks) for prescription opioid use disorder, only 6.6% were not regular using opioids at 12 weeks of follow-up. The CTN0027 population had good prognostic characteristics,24 so we would expect that percentage to be even lower for the general population of those with OUD.
Baseline covariates.
We considered numerous baseline covariates, measured across all three harmonized trials, that could potentially act as confounders and/or effect modifiers, many of which were used in previous analyses,36,41 listed in Table 1. We note that we use SuperLearner in model fitting (discussed below), and this data-adaptive modeling approach will incorporate these baseline covariates as confounders as well as effect modifiers when such effect modifier incorporation improves model t. Baseline covariates included study site (unique across trials), race/ethnicity (non-Hispanic/Latinx white, non-Hispanic/Latinx black, Hispanic/Latinx, other (including multiracial)), age (years), sex (male, female), highest level of past opioid withdrawal discomfort (none, mild, moderate, severe), past-year substance use disorders: alcohol use disorder, cocaine use disorder; history of neurological injury, epilepsy diagnosis, history of psychiatric disorders: schizophrenia, bipolar, anxiety or panic disorder, major depressive disorder; history of IV drug use; and past 30-day drug use: amphetamines, cannabis, and benzodiazepines.
Table 1:
Descriptive statistics for those initiating treatment with BUP-NX or methadone
| All | Never used | Used | Increased | ||
|---|---|---|---|---|---|
| BUP-NX | N = 1348 | 318 | 1030 | 577 | |
| Trial | |||||
| CTN0027 | 53.3% | 33.0% | 59.5% | 50.8% | |
| CTN0030 | 26.7% | 28.6% | 26.1% | 23.1% | |
| CTN0051 | 20.0% | 38.4% | 14.4% | 26.2% | |
| Age | 34.92 (10.72) | 35.62 (10.74) | 34.71 (10.72) | 35.64 (10.93) | |
| Women | 33.8% | 35.2% | 33.3% | 34.3% | |
| Race/ethnicity | |||||
| Non-Hispanic white | 72.0% | 78.9% | 69.9% | 68.6% | |
| Non-Hispanic Black | 6.8% | 4.4% | 7.6% | 9.2% | |
| Hispanic | 14.2% | 11.3% | 15.1% | 16.8% | |
| Other (including multiracial) | 6.9% | 5.3% | 7.4% | 5.4% | |
| Current IV drug use | 51.4% | 44.2% | 53.5% | 52.3% | |
| Current cannabis use | 36.1% | 36.2% | 36.1% | 36.6% | |
| Current amphetamine use | 12.8% | 11.9% | 13.0% | 13.9% | |
| Current benzodiazepine drug use | 23.8% | 24.5% | 23.6% | 13.9% | |
| Alcohol use disorder | 19.6% | 23.1% | 18.5% | 23.2% | |
| Cocaine use disorder | 25.6% | 26.9% | 25.2% | 25.9% | |
| Neurological injury | 12.0% | 13.2% | 11.7% | 14.4% | |
| History of epilepsy | 4.8% | 6.3% | 4.4% | 6.8% | |
| History of schizophrenia | 1.6% | 0.9% | 1.8% | 1.0% | |
| History of bipolar disorder | 10.7% | 10.7% | 10.7% | 12.3% | |
| History of anxiety disorder | 33.8% | 35.5% | 33.3% | 37.4% | |
| Opioid withdrawl discomfort (1–4) | 2.58 (0.66) | 2.66 (0.74) | 2.55 (0.64) | 2.62 (0.72) | |
| Max dose (mg) [median] | 19.54 (7.60) | 18.81 (6.95) | 19.77 (7.78) | 21.61 (6.61) | |
| Max dose (mg) [IQR] | 16.00, 24.00 | 14.00, 24.00 | 16.00, 24.00 | 16.00, 24.00 | |
| No. dose increases | 0.62 (0.85) | 0.68 (0.90) | 0.60 (0.83) | 1.44 (0.71) | |
| Week of relapse | 9.29 (3.95) | 11.73 (2.79) | 8.54 (3.96) | 10.12 (3.54) | |
| Relapse by week 12 | 52.2% | 20.1% | 62.0% | 45.4% | |
| Methadone | N = 515 | 75 | 440 | 428 | |
| Age | 36.93 (10.92) | 35.39 (10.86) | 37.19 (10.92) | 36.70 (10.90) | |
| Women | 32.6% | 42.7% | 30.9% | 32.7% | |
| Race/ethnicity | |||||
| Non-Hispanic white | 68.9% | 80.0% | 67.0% | 70.8% | |
| Non-Hispanic Black | 8.7% | 5.3% | 9.3% | 7.9% | |
| Hispanic | 15.5% | 12.0% | 16.1% | 15.2% | |
| Other (including multiracial) | 6.8% | 2.7% | 7.5% | 6.1% | |
| Current IV drug use | 70.8% | 44.0% | 75.4% | 69.6% | |
| Current cannabis use | 27.6% | 34.7% | 26.4% | 27.3% | |
| Current amphetamine use | 13.4% | 6.7% | 14.6% | 12.4% | |
| Current benzodiazepine drug use | 15.6% | 12.0% | 16.2% | 12.4% | |
| Alcohol use disorder | 22.0% | 24.3% | 21.5% | 23.6% | |
| Cocaine use disorder | 33.1% | 27.0% | 34.2% | 32.5% | |
| Neurological injury | 9.3% | 9.3% | 9.3% | 10.3% | |
| History of epilepsy | 1.9% | 1.3% | 2.0% | 1.4% | |
| History of schizophrenia | 2.1% | 0.0% | 2.5% | 1.9% | |
| History of bipolar disorder | 12.1% | 12.0% | 12.1% | 11.9% | |
| History of anxiety disorder | 31.1% | 29.3% | 31.4% | 33.5% | |
| Opioid withdrawl discomfort (1–4) | 2.45 (0.57) | 2.50 (0.60) | 2.44 (0.57) | 2.45 (0.56) | |
| Max dose (mg) | 78.94 (33.73) | 86.16 (48.27) | 77.71 (30.48) | 85.97 (32.06) | |
| Max dose (mg) [IQR] | 57.50, 100.00 | 53.50, 102.50 | 60.00, 95.00 | 65.00, 100.00 | |
| No. dose increases | 2.33 (1.92) | 3.11 (2.17) | 2.20 (1.85) | 2.81 (1.77) | |
| Week of relapse | 8.90 (4.00) | 12.04 (2.51) | 8.37 (3.96) | 9.40 (3.86) | |
| Relapse by week 12 | 56.1% | 14.7% | 63.2% | 51.4% | |
Time-varying covariates.
We considered the time-varying covariates of 1) most recently prescribed dose and 2) weekly illicit opioid use that was under the threshold of what was considered relapse. Missing BUP-NX dose was carried forward from the previous week (methdone dose had no missingness). Weekly illicit opioid use was assessed weekly, and was positive if the participant’s urine drug screen was positive or if the participant reported illicit opioid use in the Timeline Followback interview or if it was missing. Urine drug screens at weeks 1 and 2 could have been affected by medication used for medically managed withdrawal, so for these weeks we did not use drug screen data.
Statistical analysis.
Using weekly data, we modeled the longitudinal relationship between the time-varying exposure of dose increase on risk of relapse during the subsequent week, conditional on the previous week’s opioid use and dose (time-varying covariates), and baseline covariates. This longitudinal modeling approach uses sequential regression42–44 such that the most recently prescribed dose and previous week’s opioid use influence the likelihood of having a dose increase, which then affects the dose administered and likelihood of subsequent opioid use in a reciprocal manner.45,46 We include a directed acyclic graph depicting the longitudinal data structure and denoting the relationships that contribute to the longitudinal effect estimates in Figure A1 in the appendix. We then used this model to predict risk of relapse under four treatment strategies:
Dynamic dose increase, d1: If, every time there was opioid use, dose was subsequently increased (by any amount), up to the allowable maximum (32mg for BUP-NX, and the observed maximum of 397mg for methadone).
Increase dose to threshold, d2: If dose was increased (by any amount) every week until a minimum threshold of 16mg for BUP-NX or 100mg for methadone was reached. These thresholds were chosen based on prior research15,16,47–49 and the median maximum daily dose values in the data.
Threshold and dynamic dose increase, d3: A hybrid strategy, where dose was increased every week until a minimum threshold of 16mg for BUP-NX or 100mg for methadone was reached, and then increased every time there was opioid use thereafter. This is a combination of the previous two treatment scenarios.
Constant dose, d4: If dose remained constant after the third week of treatment, regardless of use.
We use t to denote week of treatment, and t = 0 denotes randomization. Let At = 1 denote increased dose at week t for t ∈ {2, 3, …, 11}. Let Lt denote the time-varying covariates at week t. We estimated the effect of a dosing strategy, d(Lt−1), in which dose increase at week t would be assigned according to the values of the time-varying covariates Lt−1 for t ∈ {2, 3, …, 11}. Specifically, d(Lt−1) = 1 denotes increased dose at week t in response to the values Lt−1. We define each of the above strategies in terms of this notation in the Appendix.
The time-varying covariate of opioid use was missing for 13.2%–17.7% of BUP-NX patients, depending on week, and for 12.6%–17.8% of methadone patients. However, missed visits or refused urine samples were considered positive for opioid use (discussed above), resulting in functionally no missingness for this variable or for the outcome. The time-varying covariate of buprenorphine dose was missing for between 0.1% and 2.6% of uncensored participants, depending on the timepoint (where uncensored at time t means those who had not yet relapsed and were still participating in the study at time t). Methadone dose was not missing for any participants. For missing BUP-NX dose, we carried forward the previous dose, which we believe it is more accurate than imputing, because the last prescribed dose is what the participant would have access to through the trial. Baseline covariate missingness was minimal (≤ 4%), however to preserve use of the full sample, we imputed the few missing observations using chained equations, resulting in five imputed datasets.50 This approach assumes that data are missing at random conditional on the variables in the imputation model. We combined the resulting estimates across imputed datasets using Rubin’s combining rules.51
We estimated the average treatment effect: P(Yd ≤ t) − P(Yd4 ≤ t) for all t ∈ {3, …, 12}, where Yd denotes the counterfactual risk of relapse in a hypothetical world where dose would be increased according to d ∈ {d1, d2, d3}. In words, P(Yd ≤ t) − P(Yd4 ≤ t), is the expected risk of relapse by time t contrasted under the longitudinal, counterfactual dosing strategy d (representing one of the three dosing strategies above) versus the reference of constant dose. We also estimated the average treatment effect: P(Yd3 ≤ t) − P(Yd* ≤ t) for all t ∈ {3, …, 12}, where Yd3 denotes the counterfactual risk of relapse in a hypothetical world where dose would be increased according to the hybrid strategy, and where Yd* denotes the counterfactual risk of relapse in a hypothetical world where dose would be increased according to strategy d* ∈ {d1, d2}. In other words, this compares the hybrid dosing strategy to each of its components.
We present estimates of: 1) the difference in predicted risk of relapse under each of the dosing strategies d1, d2, and d3 versus under constant dose (P(Yd ≤ t) − P(Yd4 ≤ t)), which is called the additive treatment effect (ATE), risk difference (RD), or the treatment effect on the additive scale; 2) the ratio of predicted risks of relapse under each of the dosing strategies d1, d2, and d3 relative to the predicted risk under constant dose (denoted ), which is called the relative risk (RR) or the treatment effect on the relative scale; 3) the difference in predicted risk of relapse under dosing strategy d3 versus strategy d1 or versus strategy d2 (P(Yd3 ≤ t) − P(Yd* ≤ t)); and 4) the ratio of predicted risks of relapse under dosing strategy d3 relative to the predicted risk under each of the strategies d1 and d
We used a longitudinal sequentially doubly robust estimator to estimate the above effects,33 and incorporated an ensemble of machine learning algorithms52 to flexibly model relationships (an intercept-only model, a main-effects generalized linear model, LASSO53, multivariate adaptive regression splines (MARS),54 and light gradient boosting machine (LightGBM)55). We chose these algorithms because they each represent a different general family of algorithms: generalized linear models, trees (LightGBM), and splines (MARS). Variances were estimated using the sample variance of the influence curve.33 Note that individuals were considered no longer at-risk for the outcome after their first relapse event. We assessed the extent to which there was evidence of practical violations of the positivity assumption by examining the maximum density ratio that was part of the weights in the sequentially doubly robust estimator for each medication, dosing strategy, and treatment week. We did not find evidence of such violations (Table A5 of the appendix).
We used R (version 4.2.1) for all analyses56 with the lmtp57,58 and SuperLearner packages.59 Code to replicate the analyses is available https://github.com/kin-epici/OUD-dynamic-dosing
Results
Table 1 displays descriptive information on the participants initiating treatment with BUP-NX or methadone across the three trials. This table is further subdivided into those who never used illicit opioids during weeks 2–11 of treatment (“never used”), those who ever used illicit opioids during this time period (used”), those who never had their dosage increased during weeks 2–11 of treatment (never increased”), and those who ever had their dosage increased during weeks 2–11 (“increased”).
Table 2 gives the number of participants who were observed to follow each treatment strategy by week (rows labeled Total). In addition, among those who followed a particular treatment strategy, Table 2 breaks down those who received an increase under the treatment strategy vs. not. We see ample variation across strategies and across weeks among those treated with methadone. Among those treated with BUP-NX, many individuals receive dose increases under d1 early in treatment, but fewer later in treatment. This is largely because as individuals continue in BUP-NX treatment, they are less likely to use opioids. For d2, we again see many individuals receiving dose increases under this strategy early in treatment, but fewer later in treatment, because as individuals continue in BUP-NX treatment, they are less likely to be on doses <16mg. We see a similar pattern for d3, though note that numbers receiving a BUP-NX dose increase in later weeks is slightly larger. Many participants fall under the constant dosing strategy, d4, at each week. However, for many of these individuals, ranging from 64% to 90%, depending on week, dose increases would have been indicated (but did not occur) applying either the minimum threshold criteria or the recent use criteria (row labeled “d3c”under d4). We note that there were also a substantial number of participants whose dose was increased in the absence of use, as shown in Table A3 in the appendix.
Table 2:
Number of patients randomized to receive BUP-NX and methadone that were observed as following a given strategy: (1) increased dose under the strategy and were observed as increasing dose, or (0) had a constant dose under the strategy and were observed as having a constant dose.
| Wk. 2 | 3 | 4 | 5 | 6 | 7 | 8 | 9 | 10 | 11 | |
|---|---|---|---|---|---|---|---|---|---|---|
| Constant dose strategy, d4 | ||||||||||
| BUP-NX | ||||||||||
| d1a | 375 | 269 | 227 | 125 | 115 | 107 | 112 | 89 | 75 | 78 |
| d2b | 316 | 258 | 235 | 200 | 192 | 191 | 174 | 162 | 161 | 155 |
| d3c | 557 | 444 | 396 | 295 | 281 | 269 | 255 | 230 | 220 | 214 |
| Total | 1028 | 1109 | 947 | 928 | 801 | 779 | 748 | 710 | 675 | 647 |
| Methadone | ||||||||||
| d1a | 88 | 93 | 115 | 46 | 50 | 45 | 41 | 37 | 40 | 31 |
| d2b | 158 | 186 | 221 | 168 | 168 | 164 | 145 | 139 | 125 | 118 |
| d3c | 160 | 187 | 229 | 176 | 176 | 173 | 154 | 150 | 139 | 129 |
| Total | 182 | 223 | 253 | 270 | 220 | 216 | 205 | 211 | 198 | 189 |
| Increase dose in response to use strategy, d1 | ||||||||||
| BUP-NX | ||||||||||
| Increase | 147 | 59 | 40 | 24 | 11 | 6 | 7 | 4 | 4 | 3 |
| Constant | 605 | 702 | 685 | 698 | 661 | 652 | 614 | 602 | 589 | 560 |
| Total | 752 | 761 | 725 | 722 | 672 | 658 | 621 | 606 | 593 | 563 |
| Methadone | ||||||||||
| Increase | 216 | 133 | 83 | 64 | 16 | 16 | 13 | 12 | 12 | 14 |
| Constant | 72 | 100 | 128 | 157 | 158 | 165 | 157 | 169 | 154 | 153 |
| Total | 288 | 233 | 211 | 221 | 174 | 181 | 170 | 181 | 166 | 167 |
| Increase dose if under threshold strategy, d2 | ||||||||||
| BUP-NX | ||||||||||
| Increase | 67 | 26 | 21 | 13 | 9 | 3 | 6 | 3 | 3 | 4 |
| Constant | 695 | 770 | 696 | 699 | 597 | 584 | 561 | 536 | 510 | 490 |
| Total | 762 | 796 | 717 | 712 | 606 | 587 | 567 | 539 | 513 | 494 |
| Methadone | ||||||||||
| Increase | 312 | 200 | 122 | 89 | 43 | 33 | 30 | 18 | 20 | 14 |
| Constant | 2 | 5 | 22 | 34 | 41 | 45 | 52 | 64 | 69 | 64 |
| Total | 314 | 205 | 144 | 123 | 84 | 78 | 82 | 82 | 89 | 78 |
| Hybrid dosing strategy, d3 | ||||||||||
| BUP-NX | ||||||||||
| Increase | 182 | 72 | 55 | 34 | 18 | 9 | 12 | 7 | 6 | 6 |
| Constant | 423 | 511 | 513 | 527 | 492 | 488 | 465 | 457 | 443 | 424 |
| Total | 605 | 583 | 568 | 561 | 510 | 497 | 477 | 464 | 449 | 430 |
| Methadone | ||||||||||
| Increase | 325 | 215 | 136 | 106 | 51 | 38 | 35 | 22 | 27 | 24 |
| Constant | 0 | 4 | 12 | 23 | 31 | 35 | 42 | 53 | 54 | 52 |
| Total | 325 | 219 | 148 | 129 | 82 | 73 | 77 | 75 | 81 | 76 |
No. of dose increases that would have been indicated applying d1
No. of dose increases that would have been indicated applying d2
No. of dose increases that would have been indicated applying d3
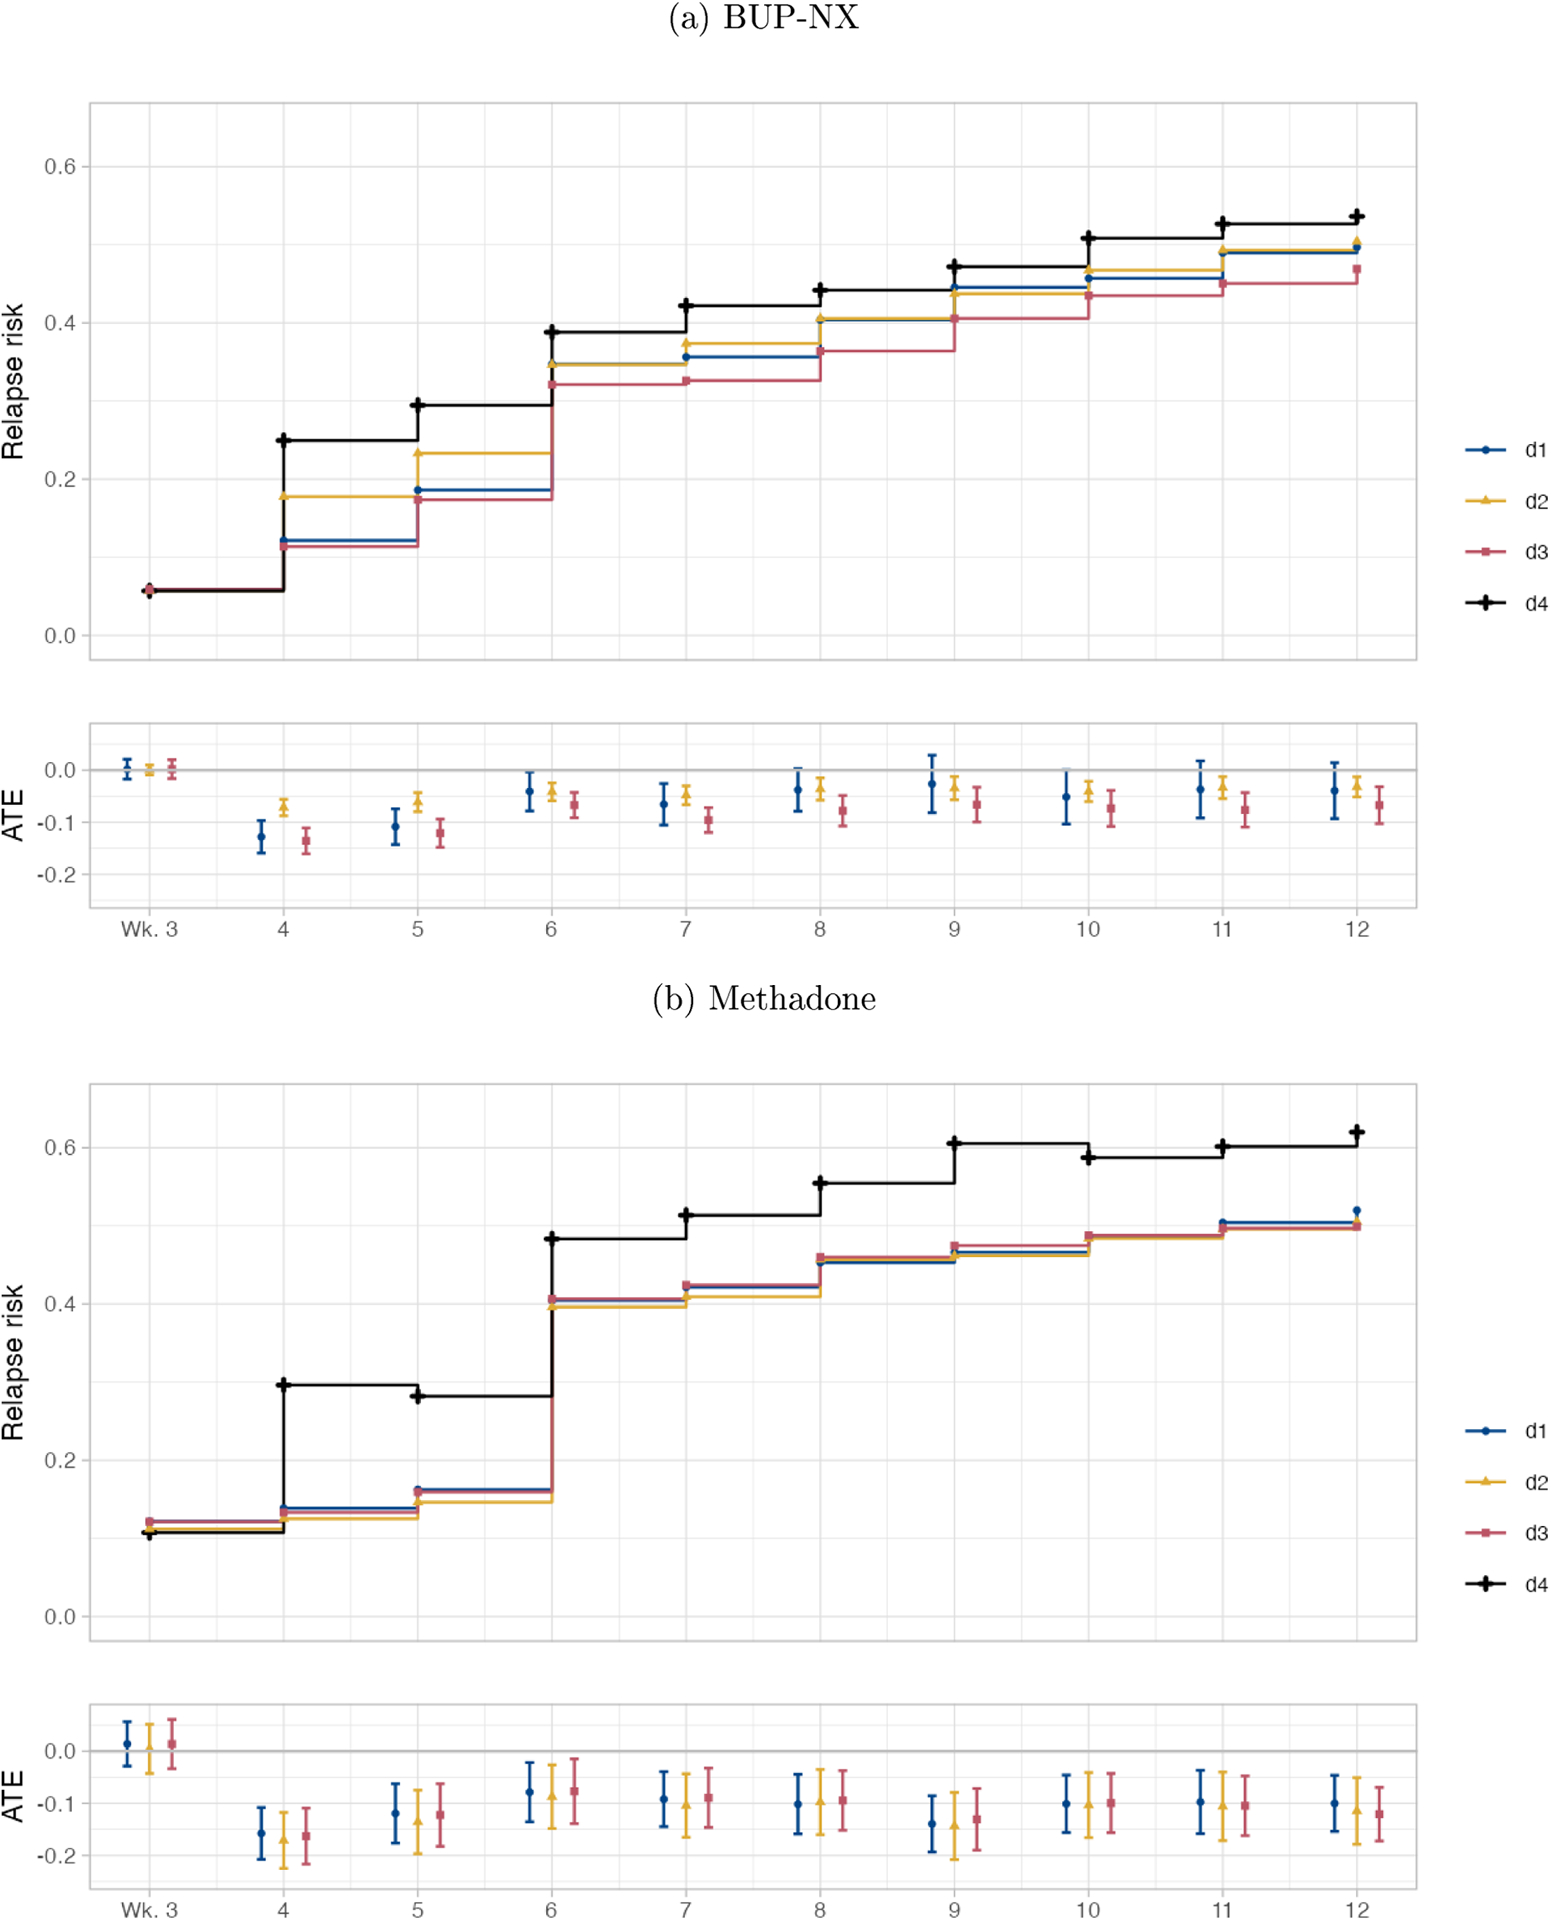
Figure 1a shows the estimated cumulative risk of relapse by week for each of the four dosing strategies among those treated with BUP-NX. Figure 1a also shows the differences in risks of relapse (risk differences, RD) comparing each of the dosing strategies d ∈ {d1, d2, d3} to the reference of constant dose (d4), along with their associated 95% confidence intervals (CIs) at each week, again among those treated with BUP-NX. We see that each of the BUP-NX dosing strategies involving dose increases reduces risk of relapse at each week after week 3, as compared to keeping dose constant, but more so earlier in treatment. This reduction is statistically significant at all weeks for strategies d2 and d3 and at weeks 4–7 for strategy d1. For example, the hybrid strategy for increasing BUP-NX dose would reduce risk of relapse by week 12 by 13% (RR: 0.87, 95% CI: 0.80, 0.95) as compared to holding dose constant, translating to a number needed to treat (NNT) of 14.
Figure 1:
Estimated marginal risks of relapse and average treatment effects (with 95% confidence intervals), comparing dosing strategies d ∈ {d1, d2, d3} to the reference of constant dose (d4), among (a) patients randomized to BUP-NX and (b) patients randomized to methadone.
Figure 1b shows the estimated cumulative risk of relapse by week for each of the four dosing strategies among those treated with methadone. The estimates generally have wider confidence intervals for methadone than for BUP-NX. We see evidence that strategies involving dose increases significantly reduce risk of relapse across weeks. For example, the hybrid strategy for increasing methadone dose would reduce risk of relapse by week 12 by 20% (RR: 0.80, 95% CI: 0.71, 0.90) as compared to holding dose constant after week 3, translating to an NNT of 8.
Table A1 in the appendix provides the point estimates and 95% CIs for each contrast for BUP-NX and for methadone.
We also compared the effect of d3 to each of its components (d1 and d2). Table A2 in the appendix provides the point estimates and 95% CIs for each of these contrasts for BUP-NX and methadone. For BUP-NX, d3 would reduce risk of relapse at each week, as compared to d1 or d2 (Table A2). For methadone, d3 performed similarly to d1 and d2.
Discussion
We found that a strategy in which dose would be increased weekly until a threshold (16mg for BUP-NX, 100mg for methadone) is reached or a strategy in which dose would be increased in response to opioid use were each estimated to reduce risk of relapse over 12 weeks of treatment. A hybrid dosing strategy that combined these components performed better than either component alone for BUP-NX treatment. The hybrid strategy performed similarly to either strategy alone for methadone treatment. The degree to which dynamic dosing strategies d1 – d3 reduced risk as compared to the constant dose strategy appeared to level off around week 6 (Figure 1 and Table A1). This could, in part, be because: 1) the number of participants meeting the threshold dose levels off around week 6, and 2) that the number of participants with prior with use also levels off around week 6 (see Table A4 in the appendix). It could also be because different strategies may either be working or not within the first few weeks of treatment, though this is speculative.
Our findings are aligned with current clinical consensus opinion on dosing strategies for BUP-NX and methadone treatment for OUD,14 as summarized in the Introduction. However, to our knowledge, the current study, along with a previous study,28 provides some of the first evidence quantifying the effects of these dosing strategies on OUD-related outcomes. The previous study found that increase BUP-NX dose in response to use would significantly reduce risk of relapse to OUD over 24 weeks of treatment.28 The present study corroborates this earlier work. It also builds on it by: 1) using secondary data from three trials instead of just one, thus greatly increasing sample size; 2) estimating effects of other dosing strategies, including increasing dose to a minimum threshold and the hybrid strategy; and 3) estimating the effects of dosing strategies for methadone.
Strengths and Limitations.
Our utilization of weekly data up to 12 weeks of treatment from three large, harmonized multi-site clinical trials for the treatment of OUD are strengths, providing a large sample size with enough naturalistic variation in dosing to contrast dosing strategies. However, the three trials were neither designed nor powered to test the effect of dynamic, individualized treatment strategies on risk of relapse. Although combining data across trials resulted in a relatively large sample size, there were nonetheless treatment strategies that were observed for a small number of participants (Table 2). In particular, we observed few participants with BUP-NX increases each week after week 6, which means that our conclusions regarding the benefits of dose increases after week 6 should be treated with caution.
The trials also enrolled disparate patient populations, though we controlled for study site, which was unique across trials.23,34–36 The effects we estimated were allowed to vary across trials and trial sites, and the resulting estimates were overall averages, which may differ from trial or site-specific effects. Although we lack the cell sizes to stratify the BUP-NX analysis by trial (Table A6 in the appendix), we include stratified analyses through week 6 in Figures A3–A5 in the appendix. Analogously, our effect estimates may not generalize to other OUD treatment-seeking populations.
Another limitation was that this was an observational analysis, so our results may have been biased due to residual confounding due to unmeasured variables (e.g., patient motivation). We addressed confounding due to measured variables in several ways. We incorporated numerous baseline covariates. We used a sequentially doubly robust estimator of longitudinal effects,33 which means that our estimates are expected to be unbiased even if either the treatment model or outcome model are consistently estimated at each timepoint. Additionally, the estimator appropriately adjusted for time-varying confounders of non-study opioid use and dose and the time-varying exposure of dose increase.33 Lastly, we used an ensemble of machine learning algorithms to flexibly fit each model and 10-fold cross validation to mitigate risk of over tting.52
In addition, it is possible that there is not a single best dosing strategy for all patients. It is plausible that the best strategy could be subgroup-specific, depending on a patient’s clinical and/or demographic characteristics, and may even vary over time as those characteristics change. We are currently working on learning such a time-varying, individualized dynamic optimal treatment rule for when doses should be increased, and as such, it is the topic of a future paper.
Conclusions.
Future research should test the effect of dynamic dosing strategies experimentally with prospective randomized trials, comparing fixed or usual treatment strategies to strategies that increase dose to a threshold and further increase dose in response to ongoing opioid use. Our findings support the clinical recommendation, also partially reflected in current guidelines,14 that, doses be targeted toward minimum thresholds and, in the case of BUP-NX, that doses be raised when patients continue to use opioids.
Highlights
We sought to answer the question: Among those initiating buprenorphine-naloxone or methadone treatment for opioid use disorder, what dosing strategy would result in the lowest risk of relapse in the first 12 weeks of treatment?
We found that doses should be targeted toward minimum thresholds and, in the case of buprenorphine, raised when patients continue to use opioids.
For buprenorphine, 1) increasing dose in response to opioid use or 2) increasing dose to a minimum of 16 mg and subsequently increasing in response to use, both resulted in the lowest risk of relapse.
For methadone, holding dose constant resulted in greatest risk of relapse; the other three strategies of 1) increasing dose until a minimum threshold of 100mg was reached, 2) increasing dose in response to use, or 3) increasing until the minimum threshold and subsequently increasing in response to use performed similarly.
Supplementary Material
Acknowledgements:
This work was supported by the National Institute on Drug Abuse (R00DA042127; PI Rudolph) and the Data Science Institute (PI Rudolph, Co-I Luo).
Sources of financial support:
This work was supported by the National Institute on Drug Abuse (R00DA042127; PI Rudolph) and the Columbia University Data Science Institute (Rudolph, Luo).
Conflicts of interest:
JR has received medication and/or other support for research studies from Alkermes, Reckitt-Benckiser, Indivior, and Braeburn. EVN has received medication for research studies from Alkermes/ Cephalon, Duramed Pharmaceuticals, and Reckitt-Benckiser. MF has been a consultant for Alkermes, Drug Delivery LLC, and has received research support from Alkermes. The remaining authors have no conflicts of interest to report.
Footnotes
Publisher's Disclaimer: This is a PDF file of an unedited manuscript that has been accepted for publication. As a service to our customers we are providing this early version of the manuscript. The manuscript will undergo copyediting, typesetting, and review of the resulting proof before it is published in its final form. Please note that during the production process errors may be discovered which could affect the content, and all legal disclaimers that apply to the journal pertain.
Clinical trial registration details: This is a secondary analysis of three harmonized clinical trials.
References
- [1].Centers for Medicare & Medicaid Services. Ongoing emergencies & disasters, 2020. https://www.cms.gov/About-CMS/Agency-Information/Emergency/EPRO/Current-Emergencies/Ongoing-emergencies (accessed July 11, 2020).
- [2].Centers for Disease Control and Prevention. Opioid Data Analysis and Resources, 2020. https://www.cdc.gov/drugoverdose/data/analysis.html (accessed July 11, 2020).
- [3].Degenhardt Louisa, Bucello Chiara, Mathers Bradley, Briegleb Christina, Ali Hammad, Hickman Matt, and McLaren Jennifer. Mortality among regular or dependent users of heroin and other opioids: a systematic review and meta-analysis of cohort studies. Addiction, 106(1):32–51, 2011. [DOI] [PubMed] [Google Scholar]
- [4].Hser Yih-Ing, Mooney Larissa J, Saxon Andrew J, Miotto Karen, Bell Douglas S, Zhu Yuhui, Liang Di, and Huang David. High mortality among patients with opioid use disorder in a large healthcare system. Journal of addiction medicine, 11(4):315, 2017. [DOI] [PMC free article] [PubMed] [Google Scholar]
- [5].Centers for Disease Control and Prevention. Overdose Deaths Accelerating During COVID-19, 2020. https://www.cdc.gov/media/releases/2020/p1218-overdose-deaths-covid-19.html, (accessed Feb 2, 2021). Accessed: 2021-02-03. [Google Scholar]
- [6].Soares William E III, Melnick Edward R, Nath Bidisha, D’Onofrio Gail, Paek Hyung, Skains Rachel M, Walter Lauren A, Casey Martin F, Napoli Anthony, Hoppe Jason A, et al. Emergency department visits for nonfatal opioid overdose during the covid-19 pandemic across 6 us healthcare systems. Annals of Emergency Medicine, 79(2):158–67, 2021. [DOI] [PMC free article] [PubMed] [Google Scholar]
- [7].Volkow Nora D, Jones Emily B, Einstein Emily B, and Wargo Eric M. Prevention and treatment of opioid misuse and addiction: a review. JAMA psychiatry, 76(2):208–216, 2019. [DOI] [PubMed] [Google Scholar]
- [8].National Academies of Sciences Engineering, Medicine, et al. Medications for opioid use disorder save lives. National Academies Press, 2019. [PubMed] [Google Scholar]
- [9].Greenwald Mark K, Johanson Chris-Ellyn, Moody David E, Woods James H, Kil-bourn Michael R, Koeppe Robert A, Schuster Charles R, and Zubieta Jon-Kar. Effects of buprenorphine maintenance dose on μ-opioid receptor availability, plasma concentrations, and antagonist blockade in heroin-dependent volunteers. Neuropsychopharmacology, 28(11):2000–2009, 2003. [DOI] [PubMed] [Google Scholar]
- [10].Comer Sandra D, Walker Ellen A, and Collins Eric D. Buprenorphine/naloxone reduces the reinforcing and subjective effects of heroin in heroin-dependent volunteers. Psychopharmacology, 181(4):664–675, 2005. [DOI] [PMC free article] [PubMed] [Google Scholar]
- [11].Greenwald Mark K, Comer Sandra D, and Fiellin David A. Buprenorphine maintenance and mu-opioid receptor availability in the treatment of opioid use disorder: implications for clinical use and policy. Drug and alcohol dependence, 144:1–11, 2014. [DOI] [PMC free article] [PubMed] [Google Scholar]
- [12].Bell James and Strang John. Medication treatment of opioid use disorder. Biological psychiatry, 87(1):82–88, 2020. [DOI] [PubMed] [Google Scholar]
- [13].Heikman Pertti Kalevi, Muhonen Leea Hellevi, and Ojanperä Ilkka Antero. Polydrug abuse among opioid maintenance treatment patients is related to inadequate dose of maintenance treatment medicine. BMC psychiatry, 17(1):1–11, 2017. [DOI] [PMC free article] [PubMed] [Google Scholar]
- [14].Substance Abuse et al. Medications for opioid use disorder for healthcare and addiction professionals, policymakers, patients, and families: treatment improvement protocol tip 63. 2021. [Google Scholar]
- [15].Mattick Richard P, Breen Courtney, Kimber Jo, and Davoli Marina. Buprenorphine maintenance versus placebo or methadone maintenance for opioid dependence. Cochrane database of systematic reviews, (2), 2014. [Google Scholar]
- [16].Fareed Ayman, Casarella Jennifer, Roberts Mary, Sleboda Mary, Amar Richard, Vayalapalli Shreedevi, and Drexler Karen. High dose versus moderate dose methadone maintenance: is there a better outcome? Journal of addictive diseases, 28(4):399–405, 2009. [DOI] [PubMed] [Google Scholar]
- [17].Donny Eric C, Brasser Susan M, Bigelow George E, Stitzer Maxine L, and Walsh Sharon L. Methadone doses of 100 mg or greater are more effective than lower doses at suppressing heroin self-administration in opioid-dependent volunteers. Addiction, 100(10):1496–1509, 2005. [DOI] [PubMed] [Google Scholar]
- [18].Mitchell Timothy B, White Jason M, Somogyi Andrew A, and Bochner Felix. Comparative pharmacodynamics and pharmacokinetics of methadone and slow-release oral morphine for maintenance treatment of opioid dependence. Drug and alcohol dependence, 72(1):85–94, 2003. [DOI] [PubMed] [Google Scholar]
- [19].Hiltunen AJ, Beck O, Hjemdahl P, Liljeberg P, Almström U, Brodin K, Von Wachenfeldt J, and Borg S. Rated well-being in relation to plasma concentrations of l-and d-methadone in satis ed and dissatis ed patients on methadone maintenance treatment. Psychopharmacology, 143(4):385–393, 1999. [DOI] [PubMed] [Google Scholar]
- [20].Gordon Adam J, Lo-Ciganic Wei-Hsuan, Cochran Gerald, Gellad Walid F, Cathers Terri, Kelley David, and Donohue Julie M. Patterns and quality of buprenorphine opioid agonist treatment in a large medicaid program. Journal of addiction medicine, 9(6):470–477, 2015. [DOI] [PubMed] [Google Scholar]
- [21].D’Aunno Thomas, Park Sunggeun Ethan, and Pollack Harold A. Evidence-based treatment for opioid use disorders: A national study of methadone dose levels, 2011 2017. Journal of substance abuse treatment, 96:18–22, 2019. [DOI] [PMC free article] [PubMed] [Google Scholar]
- [22].Madden Erin Fanning, Prevedel Suzanne, Light Timothy, and Sulzer Sandra H. Intervention stigma toward medications for opioid use disorder: A systematic review. Substance Use & Misuse, 56(14):2181–2201, 2021. [DOI] [PubMed] [Google Scholar]
- [23].Saxon Andrew J, Ling Walter, Hillhouse Maureen, Thomas Christie, Hasson Albert, Ang Alfonso, Doraimani Geetha, Tasissa Gudaye, Lokhnygina Yuliya, Leimberger Je, et al. Buprenorphine/naloxone and methadone effects on laboratory indices of liver health: a randomized trial. Drug and alcohol dependence, 128(1–2):71–76, 2013. [DOI] [PMC free article] [PubMed] [Google Scholar]
- [24].Weiss Roger D, Potter Jennifer Sharpe, Fiellin David A, Byrne Marilyn, Connery Hilary S, Dickinson William, Gardin John, Griffin Margaret L, Gourevitch Marc N, Haller Deborah L, et al. Adjunctive counseling during brief and extended buprenorphine-naloxone treatment for prescription opioid dependence: a 2-phase randomized controlled trial. Archives of general psychiatry, 68(12):1238–1246, 2011. [DOI] [PMC free article] [PubMed] [Google Scholar]
- [25].Morral Andrew R, Belding Mark A, and Iguchi Martin Y. Identifying methadone maintenance clients at risk for poor treatment response: Pretreatment and early progress indicators. Drug and Alcohol Dependence, 55(1–2):25–33, 1999. [DOI] [PubMed] [Google Scholar]
- [26].McDermott Katherine A, Griffin Margaret L, Connery Hilary S, Hilario E Yvette, Fiellin David A, Fitzmaurice Garrett M, and Weiss Roger D. Initial response as a predictor of 12-week buprenorphine-naloxone treatment response in a prescription opioid dependent population. The Journal of clinical psychiatry, 76(2):189, 2015. [DOI] [PMC free article] [PubMed] [Google Scholar]
- [27].White William L, Campbell Michael D, Spencer Robert D, Ho man Howard A, Crissman Brian, and DuPont Robert L. Patterns of abstinence or continued drug use among methadone maintenance patients and their relation to treatment retention. Journal of psychoactive drugs, 46(2):114–122, 2014. [DOI] [PubMed] [Google Scholar]
- [28].Rudolph Kara E, Shulman Matisyahu, Fishman Marc, Díaz Iván, Rotrosen John, and Nunes Edward V. Association between dynamic dose increases of buprenorphine for treatment of opioid use disorder and risk of relapse. Addiction, 2021. [DOI] [PMC free article] [PubMed] [Google Scholar]
- [29].Termorshuizen Fabian, Krol Anneke, Prins Maria, Geskus Ronald, van den Brink Wim, and van Ameijden Erik JC. Prediction of relapse to frequent heroin use and the role of methadone prescription: an analysis of the amsterdam cohort study among drug users. Drug and alcohol dependence, 79(2):231–240, 2005. [DOI] [PubMed] [Google Scholar]
- [30].Leavitt Stewart B, Shinderman Marc, Maxwell Sarz, Eap Chin B, and Paris Philip. When” enough” is not enough: new perspectives on optimal methadone maintenance dose. The Mount Sinai Journal of Medicine, New York, 67(5–6):404–411, 2000. [PubMed] [Google Scholar]
- [31].Laber Eric B, Wu Fan, Munera Catherine, Lipkovich Ilya, Colucci Salvatore, and Ripa Steve. Identifying optimal dosage regimes under safety constraints: An application to long term opioid treatment of chronic pain. Statistics in medicine, 37(9):1407–1418, 2018. [DOI] [PMC free article] [PubMed] [Google Scholar]
- [32].Murphy Susan A, Lynch Kevin G, Oslin David, McKay James R, and TenHave Tom. Developing adaptive treatment strategies in substance abuse research. Drug and alcohol dependence, 88:S24–S30, 2007. [DOI] [PMC free article] [PubMed] [Google Scholar]
- [33].Luedtke Alexander R., Sofrygin Oleg, van der Laan Mark J., and Carone Marco. Sequential double robustness in right-censored longitudinal models. 2018.
- [34].Potter Jennifer S, Marino Elise N, Hillhouse Maureen P, Nielsen Suzanne, Wiest Katharina, Canamar Catherine P, Martin Judith A, Ang Alfonso, Baker Rachael, Saxon Andrew J, et al. Buprenorphine/naloxone and methadone maintenance treatment outcomes for opioid analgesic, heroin, and combined users: findings from starting treatment with agonist replacement therapies (start). Journal of Studies on Alcohol and Drugs, 74(4):605–613, 2013. [DOI] [PMC free article] [PubMed] [Google Scholar]
- [35].Weiss Roger D, Potter Jennifer Sharpe, Provost Scott E, Huang Zhen, Jacobs Petra, Hasson Albert, Lindblad Robert, Connery Hilary Smith, Prather Kristi, and Ling Walter. A multisite, two-phase, prescription opioid addiction treatment study (poats): rationale, design, and methodology. Contemporary clinical trials, 31(2):189–199, 2010. [DOI] [PMC free article] [PubMed] [Google Scholar]
- [36].Lee Joshua D, Nunes Edward V Jr, Novo Patricia, Bachrach Ken, Bailey Genie L, Bhatt Snehal, Farkas Sarah, Fishman Marc, Gauthier Phoebe, Hodgkins Candace C, et al. Comparative effectiveness of extended-release naltrexone versus buprenorphine-naloxone for opioid relapse prevention (x: Bot): a multicentre, open-label, randomised controlled trial. The Lancet, 391(10118):309–318, 2018. [DOI] [PMC free article] [PubMed] [Google Scholar]
- [37].Sobell LC and Sobell MB. Alcohol timeline followback users’ manual. Toronto, Canada: Addiction Research Foundation, 1995. [Google Scholar]
- [38].Hser Yih-Ing, Evans Elizabeth, Huang David, Weiss Robert, Saxon Andrew, Carroll Kathleen M, Woody George, Liu David, Wakim Paul, Matthews Abigail G, et al. Long-term outcomes after randomization to buprenorphine/naloxone versus methadone in a multi-site trial. Addiction, 111(4):695–705, 2016. [DOI] [PMC free article] [PubMed] [Google Scholar]
- [39].Hser Yih-Ing, Huang David, Saxon Andrew J, Woody George, Moskowitz Andrew L, Matthews Abigail G, and Ling Walter. Distinctive trajectories of opioid use over an extended follow-up of patients in a multi-site trial on buprenorphine+ naloxone and methadone. Journal of Addiction Medicine, 11(1):63, 2017. [DOI] [PMC free article] [PubMed] [Google Scholar]
- [40].Weiss Roger D, Potter Jennifer Sharpe, Griffin Margaret L, Provost Scott E, Fitzmaurice Garrett M, McDermott Katherine A, Srisarajivakul Emily N, Dodd Dorian R, Dreifuss Jessica A, McHugh R Kathryn, et al. Long-term outcomes from the national drug abuse treatment clinical trials network prescription opioid addiction treatment study. Drug and alcohol dependence, 150:112–119, 2015. [DOI] [PMC free article] [PubMed] [Google Scholar]
- [41].Nunes EV, Scodes JM, Pavlicova M, Lee JD, Novo P, Campbell ANC, and Rotrosen J. Moderators of sublingual buprenorphine versus injection naltrexone for treatment of opioid use disorder: Can patient characteristics guide choice of treatment? Under Review, 2020. [DOI] [PMC free article] [PubMed] [Google Scholar]
- [42].Robins James. A new approach to causal inference in mortality studies with a sustained exposure period—application to control of the healthy worker survivor effect. Mathematical modelling, 7(9–12):1393–1512, 1986. [Google Scholar]
- [43].Robins James M. Addendum to “a new approach to causal inference in mortality studies with a sustained exposure period—application to control of the healthy worker survivor effect”. Computers & Mathematics with Applications, 14(9–12):923–945, 1987. [Google Scholar]
- [44].Robins JM. Errata for “a new approach” to causal inference in mortality studies with a sustained exposure period-application to control of the healthy worker survivor effect. Computers and Mathematics with Applications, 14:917–921, 1987. [Google Scholar]
- [45].Hernán Miguel A and Robins James M. Causal inference: what if, 2020.
- [46].van der Laan Mark J and Gruber Susan. Targeted minimum loss based estimation of causal effects of multiple time point interventions. The international journal of biostatistics, 8(1), 2012. [DOI] [PubMed] [Google Scholar]
- [47].Strain Eric C, Bigelow George E, Liebson Ira A, and Stitzer Maxine L. Moderate-vs high-dose methadone in the treatment of opioid dependence: a randomized trial. Jama, 281(11):1000–1005, 1999. [DOI] [PubMed] [Google Scholar]
- [48].Fareed Ayman, Vayalapalli Sreedevi, Casarella Jennifer, and Drexler Karen. E ect of buprenorphine dose on treatment outcome. Journal of addictive diseases, 31(1):8–18, 2012. [DOI] [PubMed] [Google Scholar]
- [49].Hser Yih-Ing, Saxon Andrew J, Huang David, Hasson Al, Thomas Christie, Hillhouse Maureen, Jacobs Petra, Teruya Cheryl, McLaughlin Paul, Wiest Katharina, et al. Treatment retention among patients randomized to buprenorphine/naloxone compared to methadone in a multi-site trial. Addiction, 109(1):79–87, 2014. [DOI] [PMC free article] [PubMed] [Google Scholar]
- [50].Buuren Stef and Groothuis-Oudshoorn Karin. mice: Multivariate imputation by chained equations in r. Journal of statistical software, 45(3), 2011. [Google Scholar]
- [51].Rubin Donald B. Multiple imputation for nonresponse in surveys, volume 81. John Wiley & Sons, 2004. [Google Scholar]
- [52].Van der Laan Mark J, Polley Eric C, and Hubbard Alan E. Super learner. Statistical applications in genetics and molecular biology, 6(1), 2007. [DOI] [PubMed] [Google Scholar]
- [53].Tibshirani Robert. Regression shrinkage and selection via the lasso. Journal of the Royal Statistical Society: Series B (Methodological), 58(1):267–288, 1996. [Google Scholar]
- [54].Friedman Jerome H. Multivariate adaptive regression splines. The annals of statistics , pages 1–67, 1991. [Google Scholar]
- [55].Ke Guolin, Meng Qi, Finley Thomas, Wang Taifeng, Chen Wei, Ma Weidong, Ye Qiwei, and Liu Tie-Yan. LightGBM: A highly efficient gradient boosting decision tree. In Guyon I, Von Luxburg U, Bengio S, Wallach H, Fergus R, Vishwanathan S, and Garnett R, editors, Advances in Neural Information Processing Systems, volume 30, 2017. [Google Scholar]
- [56].R Core Team. R: A Language and Environment for Statistical Computing. R Foundation for Statistical Computing, Vienna, Austria, 2020. [Google Scholar]
- [57].Williams Nicholas T and Díaz Iván. lmtp: Non-parametric Causal Effects of Feasible Interventions Based on Modified Treatment Policies, 2022. R package version 1.3.1. [Google Scholar]
- [58].Díaz Iván, Williams Nicholas, Ho man Katherine L., and Schenck Edward J.. Nonparametric causal effects based on longitudinal modified treatment policies. Journal of the American Statistical Association, 2021. [Google Scholar]
- [59].Polley Eric, LeDell Erin, Kennedy Chris, and van der Laan Mark. SuperLearner: Super Learner Prediction, 2021. R package version 2.0–28. [Google Scholar]
Associated Data
This section collects any data citations, data availability statements, or supplementary materials included in this article.