

Abstract
Background:
Determinants of long-term mortality after stroke by mechanistic type and subtype are unknown in sub-Saharan Africa (SSA). Such data are crucial for targeting specific pathophysiologic pathways to improve stroke outcomes in the region.
Purpose:
To evaluate rates and predictors of mortality up to 8 years after stroke, by type and subtype, in Ghana.
Methods:
We prospectively collected data on stroke patients presenting at a tertiary medical facility in Ghana between 2013 and 2018 who were followed up until October 31, 2021. Stroke diagnosis was confirmed using a Computerized Tomography scan; ischemic strokes were mechanistically typed using the TOAST classification while intracerebral hemorrhages were subtyped using the SMASH-U scheme. Demographic and clinical predictors of stroke mortality were evaluated using Cox proportional hazards regression modelling.
Results:
Of 564 patients encountered during the study period, data on vital status were available for 556 (98.6%) subjects at discharge and 442 (78.4%) on follow-up. Mean age was 61.1 ±15.1 years, and 223 (53.1%) were male. Mortality rates at 1, 3, 12, 36, 60 and 96 months were 37.5%, 43.2%, 49.7%, 57.4%, 62.9%, and 73.7% respectively. Three (3) factors remained significantly associated with risk of death namely age, adjusted hazard ratios (aHR) of 1.12 (95%CI: 1.04–1.20), no formal education 1.36 (95% CI: 1.02–1.81) and modified Rankin score 1.67 (95%CI: 1.42 – 1.98) for each unit rise. For ischemic stroke the four (4) factors associated with long-term mortality were low formal education, low monthly income, having diabetes mellitus and higher functional score on admission. For intracerebral hemorrhage, the two factors were increasing age and high functional score.
Conclusion:
Stroke severity is the key predictor of long-term mortality after an index stroke in Ghana, regardless of the underlying pathophysiologic mechanism. Instituting acute stroke systems of care to facilitate timely reperfusion efforts may greatly improve long term survival outcomes after stroke in SSA.
Introduction
Data on longer-term survival (>5 years) after stroke in sub-Saharan Africa (SSA) are limited in the literature. The prospects of survival after a stroke in SSA is of considerable interest given the steep rise in stroke burden1,2, the relatively younger age of stroke onset and the under-resourced health care delivery on the continent. Poor short-term survival outcomes are well documented3,4 but there is a need for more longitudinal data to inform policy directives on resource allocation for stroke care. One prospective community-based study published nearly a decade ago involved 130 stroke cases in Tanzania and found case fatality rates at 28-days of 23.8%, 3-years at 60.0% and 7–10 years of 82.3%.5–7 Participants in that study5–7 did not have stroke type and etiologic subtype information, hence data on stroke survival at a pathophysiologic level were lacking. We now provide data on the probability of survival after stroke for up to 8 years by primary stroke types and identify predictors of mortality in a Ghanaian health system.
Methods
Study Design & settings:
This is a prospective study involving stroke patients who were admitted into a tertiary medical center and who consented into a stroke registry. The study was conducted at the Komfo Anokye Teaching Hospital in Kumasi, Ghana and ethical approval for the study was obtained from the Committee on Human Publications and Ethics. Participants were enrolled between February 2013 and December 2017 and provided consent to be enrolled into a stroke registry to be contacted in the future to assess their vital status and other health outcomes. Vital status was assessed at hospitalization after stroke occurrence and for those who survived the stroke via phone calls. Presently, we contacted study participants and/or their relatives using telephone calls between 1st October 2021 to October 31, 2021. For the non-respondents, we instituted another round of phone calls between December 1 to December 20, 2021. We chose this telephonic approach due to its convenience, low cost, ability to capture the study outcome of interest principally the vital status of a participant as dead or alive, high penetration of mobile phone usage and the wide geographic distribution of stroke survivors in Ghana. Call duration was approximately 5 to 10 minutes. Verbal informed consent was sought at telephone interviews.
Data collection:
Variables collected included age at stroke onset, gender, location of residence, household monthly income, educational status as socio-demographic variables. In addition, information of stroke type, stroke severity was assessed using the National Institute of Health Stroke Scale, and functional status using the Modified Rankin scale. Stroke types were determined based on cranial computerized tomography (CT) scans performed within 10 days after stroke. Stroke phenotyping into etiologic subtypes were based on clinical evaluation and brain neuroimaging (CT or MRI), ECG, transthoracic echocardiography, and carotid Doppler ultrasound. The etiological subtypes of ischemic stroke were defined etiologically using the TOAST classification into large artery atherosclerotic disease, small vessel occlusive disease, cardio-embolism and unclassified.8 Intracerebral hemorrhage was classified etiologically into Structural, Medication-related, Amyloid angiopathy, Systemic/other disease, Hypertension and Undetermined causes (SMASH-U).9
Hypertension was defined using a blood pressure cutoff of higher than or equal to 140/90 mmHg for up to 72 hours after stroke, a history of hypertension, or use of antihypertensive before or after stroke onset.10
Diabetes mellitus was defined based on history of diabetes mellitus, use of medications for diabetes mellitus, an HBA1c >6.5% or a fasting blood glucose level greater than 7.0 mmol/L measured after the post-acute phase of stroke.11
Hypercholesterolemia was defined as fasting total cholesterol ≥5.2 mmol/L. 12
Cardiac disease was defined after evaluation by study cardiologists based on history or current diagnosis of atrial fibrillation, cardiomyopathy, heart failure, ischemic heart disease, rheumatic heart disease or valvular heart diseases.
Alcohol use was categorized into current users (users of any form of alcoholic drinks) or never/former drinker while alcohol intake was categorized as low drinkers (1–2 drinks per day for female and 1–3 drinks per day for male) and high drinker (>2 drinks per day for female and >3 drinks per day for male. 1 drink or 1 unit of alcohol = 8g of alcohol).10
Smoking status was defined as current smoker (individuals who smoked any tobacco in the past 12 months) or never/former smoker.10
For obesity, we assessed waist circumference using the WHO guidelines.13
Previous stroke was defined as clinical evidence of neurological deficit of sudden onset of vascular cause in a patient with previous history of stroke with radiological confirmation of new infarction or intracerebral hemorrhage.
Primary outcome measure: time to mortality after stroke whether first-ever stroke or recurrent stroke at time of enrollment into the stroke registry.
Statistical Analysis:
Demographic and clinical characteristics were compared between those who died or survived their stroke during follow-up. Means were compared using the Student’s t-test and proportions using the Chi-squared or the Fisher’s exact test. Kaplan-Meier survival plots were constructed to assess proportions of subjects under follow-up with observations censored at either date of death, date last seen alive upon discharge or time of phone contact to confirm being alive. Collinearity of variables was assessed by visual inspection of survival curves. Cox Proportional Hazards regression model was employed to assess the determinants of deaths during follow-up. In this model, variables such as age, gender, formal educational attainment, monthly income, stroke type (ischemic, hemorrhagic, ischemic with hemorrhage), etiologic subtypes, vascular risk factors, functional status and stroke severity were selected as independent variables to be tested in the model based on their known associations with poor stroke outcomes. In bivariate analysis, factors associated with the dependent variable at a p-value level of 0.10 were included in the multivariable model. We estimated the probability of survival in sensitivity analysis by age (<50 years vs 50 years), by sex (male vs female) and history of number of strokes (first-ever vs previous stroke). In all analysis, two-tailed p-values <0.05 were considered statistically significant with no adjustments for multiple comparisons. The final adjusted models were assessed for collinearity using goodness of fit via residual analysis and variance inflation factor (VIF) approaches. Statistical analysis was performed using SPSS version 19.
Results
Demographic and clinical features of stroke cases by survival status:
Out of 564 stroke admissions between February 2013 and December 2017, data on vital status was available for 556 (98.6%). There were 114 (20.5%) participants who were discharged home alive but could not be contacted by phone to assess their vital status. Their observations were therefore censored as alive in our analysis. Crude mortality rate was 296 (53.2%) after a mean (SD) follow-up duration of 21.3 (± 28.2) months. Participants who died were significantly older, less likely to have formal education, more likely to have diabetes, and to have had previous stroke (Table 1). Those who died had a significantly higher indicator of stroke severity on admission with mean NIHSS of 17.3 ± 8.4 compared with 10.9 ± 6.7 among those who survived.
Table 1:
Comparison of demographic and clinical characteristics according to survival status
| Alive N= 260 | Dead N=296 | P-value | |
|---|---|---|---|
| Age, mean ± SD | 57.7 ± 15.2 | 63.7 ± 15.0 | <0.0001 |
| Female sex, n (%) | 116 (44.6) | 152 (51.4) | 0.11 |
| Formal educational status | <0.0001 | ||
| No formal education | 35 (13.5) | 88 (30.6) | |
| Primary level | 70 (27.0) | 69 (24.0) | |
| Secondary level | 121 (46.7) | 96 (33.3) | |
| Tertiary level | 33 (12.7) | 35 (12.2) | |
| Monthly Income | 0.14 | ||
| Unknown | 24 (9.2) | 23 (7.8) | |
| 0 | 88 (33.8) | 128 (43.2) | |
| 1 | 102 (39.2) | 95 (32.1) | |
| 2 | 46 (17.7) | 50 (16.9) | |
| Previous stroke | 35 (13.5) | 63 (21.3) | 0.02 |
| Hypertension | 229 (88.1) | 267 (90.2) | 0.42 |
| Diabetes | 90 (34.6) | 127 (42.9) | 0.05 |
| Hypercholesterolemia | 145 (55.8) | 148 (50.0) | 0.17 |
| Smoking | 0.83 | ||
| Current | 10 (4.0) | 14 (4.9) | |
| Former | 14 (5.5) | 14 (4.9) | |
| Never | 229 (90.5) | 256 (90.1) | |
| Alcohol use | 0.27 | ||
| Current | 52 (20.6) | 55 (19.3) | |
| Former | 57 (22.5) | 50 (17.5) | |
| Never | 144 (56.9) | 180 (63.2) | |
| Stroke type | 0.54 | ||
| Ischemic stroke | 142 (54.6) | 175 (59.1) | |
| Intracerebral hemorrhage | 100 (38.5) | 101 (34.1) | |
| Ischemic with hemorrhage | 18 (6.9) | 20 (6.8) | |
| Ischemic stroke subtypes | 0.16 | ||
| SVO | 54 (38.0) | 47 (26.9) | |
| LAA | 36 (25.4) | 58 (33.1) | |
| CE | 26 (18.3) | 38 (21.7) | |
| Unknown | 26 (18.3) | 32 (18.3) | |
| Intracerebral hemorrhage | 0.70 | ||
| Structural | 12 (12.0) | 17 (16.8) | |
| Amyloid angiopathy | 2 (2.0) | 1 (1.0) | |
| Hypertension | 83 (83.0) | 81 (80.2) | |
| Unknown | 3 (3.0) | 2 (2.0) | |
| Baseline severity, NIHSS | 10.9 ± 6.7 | 17.3 ± 8.4 | <0.0001 |
| Baseline Functional status, MRS | 3.8 ± 1.1 | 4.4 ± 0.9 | <0.0001 |
Probability of mortality after stroke:
The cumulative probability of death after stroke overall at 1 month was 37.5%, at 3 months was 43.2%, at 12 months was 49.7%, at 24 months was 53.9%, at 48 months was 61.7%, at 72 months was 64.9%, and 96 months was 73.7%. The probability of mortality after ischemic strokes were higher than for intracerebral hemorrhagic strokes, unadjusted hazard ratio of 1.30 (95% CI: 1.01–1.69), p=0.04, (Figure 1).
Figure 1:

Survival probability after ischemic stroke (IS) compared with spontaneous Intracerebral hemorrhage (ICH) in Ghana
Predictors of mortality after stroke:
Increasing age, female sex, no formal education, low monthly income, diabetes mellitus, previous stroke, higher Modified Rankin score and ischemic stroke were eight factors associated with mortality on bivariate analysis. However, upon adjustment for confounders, three factors remained significantly associated with risk of death namely age, with adjusted odds ratio of 1.12 (95%CI: 1.04–1.20), no formal education 1.36 (1.02–1.81) and modified Rankin score 1.67 (1.42 – 1.98) for each unit rise. (Table 3).
Table 3:
Determinants of longer-term survival after stroke in Ghana
| Variable | Unadjusted Hazard ratio (95% CI) | P-value | Adjusted Hazard ratio (95% CI) | P-value |
|---|---|---|---|---|
| Each 10-year rise | 1.25 (1.15 – 1.35) | <0.0001 | 1.12 (1.04–1.20) | 0.04 |
| Female sex | 1.30 (1.03 – 1.63) | 0.03 | 1.09 (0.84–1.40) | 0.52 |
| No formal education | 1.83 (1.43–2.36) | <0.0001 | 1.36 (1.02–1.81) | 0.03 |
| Monthly income <$100 | 1.35 (1.06–1.71) | 0.01 | 1.21 (0.94–1.57) | 0.14 |
| Diabetes | 1.33 (1.06–1.67) | 0.02 | 1.06 (0.82–1.36) | 0.65 |
| Hypertension | 0.78 (0.51–1.17) | 0.23 | -- | -- |
| Hypercholesterolemia | 0.89 (0.70–1.12) | 0.31 | -- | -- |
| Alcohol | 0.93 (0.69–1.25) | 0.64 | -- | -- |
| Smoking | 1.04 (0.70–1.53) | 0.86 | -- | -- |
| Previous stroke | 1.47 (1.11–1.94) | 0.007 | 1.16 (0.86–1.57) | 0.33 |
| Modified Rankin Score | 1.73 (1.47–2.04) | <0.0001 | 1.67 (1.42–1.98) | <0.0001 |
| ICH | 1.00 | 1.00 | ||
| Ischemic+hemorrhage | 1.21 (0.75–1.96) | 0.43 | 1.04 (0.60–2.00) | 0.89 |
| Ischemic | 1.26 (0.99–1.62) | 0.06 | 1.08 (0.83– 1.42) | 0.56 |
Predictors of mortality by stroke type:
For ischemic stroke, four factors independently associated with mortality were formal education, low monthly income <$100, diabetes mellitus, and higher Modified Rankin Score (Table 4). By etiologic subtypes, those with cardio-embolic and large artery atherosclerotic disease were at a higher probability of death unadjusted odds ratio of 1.63 (1.05 – 2.52) and 1.69 (1.14 – 2.49) relative to small vessel occlusive disease (Figure 2) but significant associations were lost in adjusted analysis. There were two independent predictors associated with intracerebral hemorrhage namely increasing age and higher functional status but not its etiologic subtypes (Table 5). The probability of death after an intracerebral hemorrhage by its etiologic subtypes is shown in Figure 3.
TABLE 4.
Determinants of longer-term mortality after Ischemic Stroke
| Variable | Unadjusted Hazard ratio (95% CI) | P-value | Adjusted Hazard ratio (95% CI) | P-value |
|---|---|---|---|---|
| Each 10-year rise | 1.11 (1.02–1.21) | 0.01 | 1.06 (0.98–1.15) | 0.15 |
| Female sex | 1.21 (0.89–1.64) | 0.22 | -- | -- |
| No formal education | 1.93 (1.41–2.64) | <0.0001 | 1.52 (1.09–2.11) | 0.01 |
| Monthly income <$100 | 1.45 (1.06–1.98) | 0.02 | 1.43 (1.04–1.97) | 0.03 |
| Diabetes | 1.55 (1.14–2.09) | 0.005 | 1.41 (1.04–1.91) | 0.03 |
| Hypertension | 0.69 (0.43–1.11) | 0.13 | -- | -- |
| Hypercholesterolemia | 0.72 (0.53–0.98) | 0.03 | 1.20 (0.94–1.52) | 0.14 |
| Alcohol | 0.95 (0.66–1.38) | 0.79 | -- | -- |
| Smoking | 1.06 (0.64–1.75) | 0.82 | -- | -- |
| Previous stroke | 1.37 (0.98–1.92) | 0.06 | 1.05 (0.74–1.49) | 0.7 |
| MRS, each unit higher | 1.79 (1.43–2.22) | <0.0001 | 1.68 (1.35–2.10) | <0.0001 |
| Ischemic stroke subtype | ||||
| SVO | 1.00 | 1.00 | ||
| CE | 1.63 (1.05–2.52) | 0.03 | 1.32 (0.83–2.10) | 0.24 |
| LAA | 1.69 (1.14–2.49) | 0.009 | 1.26 (0.83–1.92) | 0.27 |
| Unclassified | 1.36 (0.86–2.16) | 0.19 | 1.04 (0.64–1.68) | 0.87 |
Figure 2:
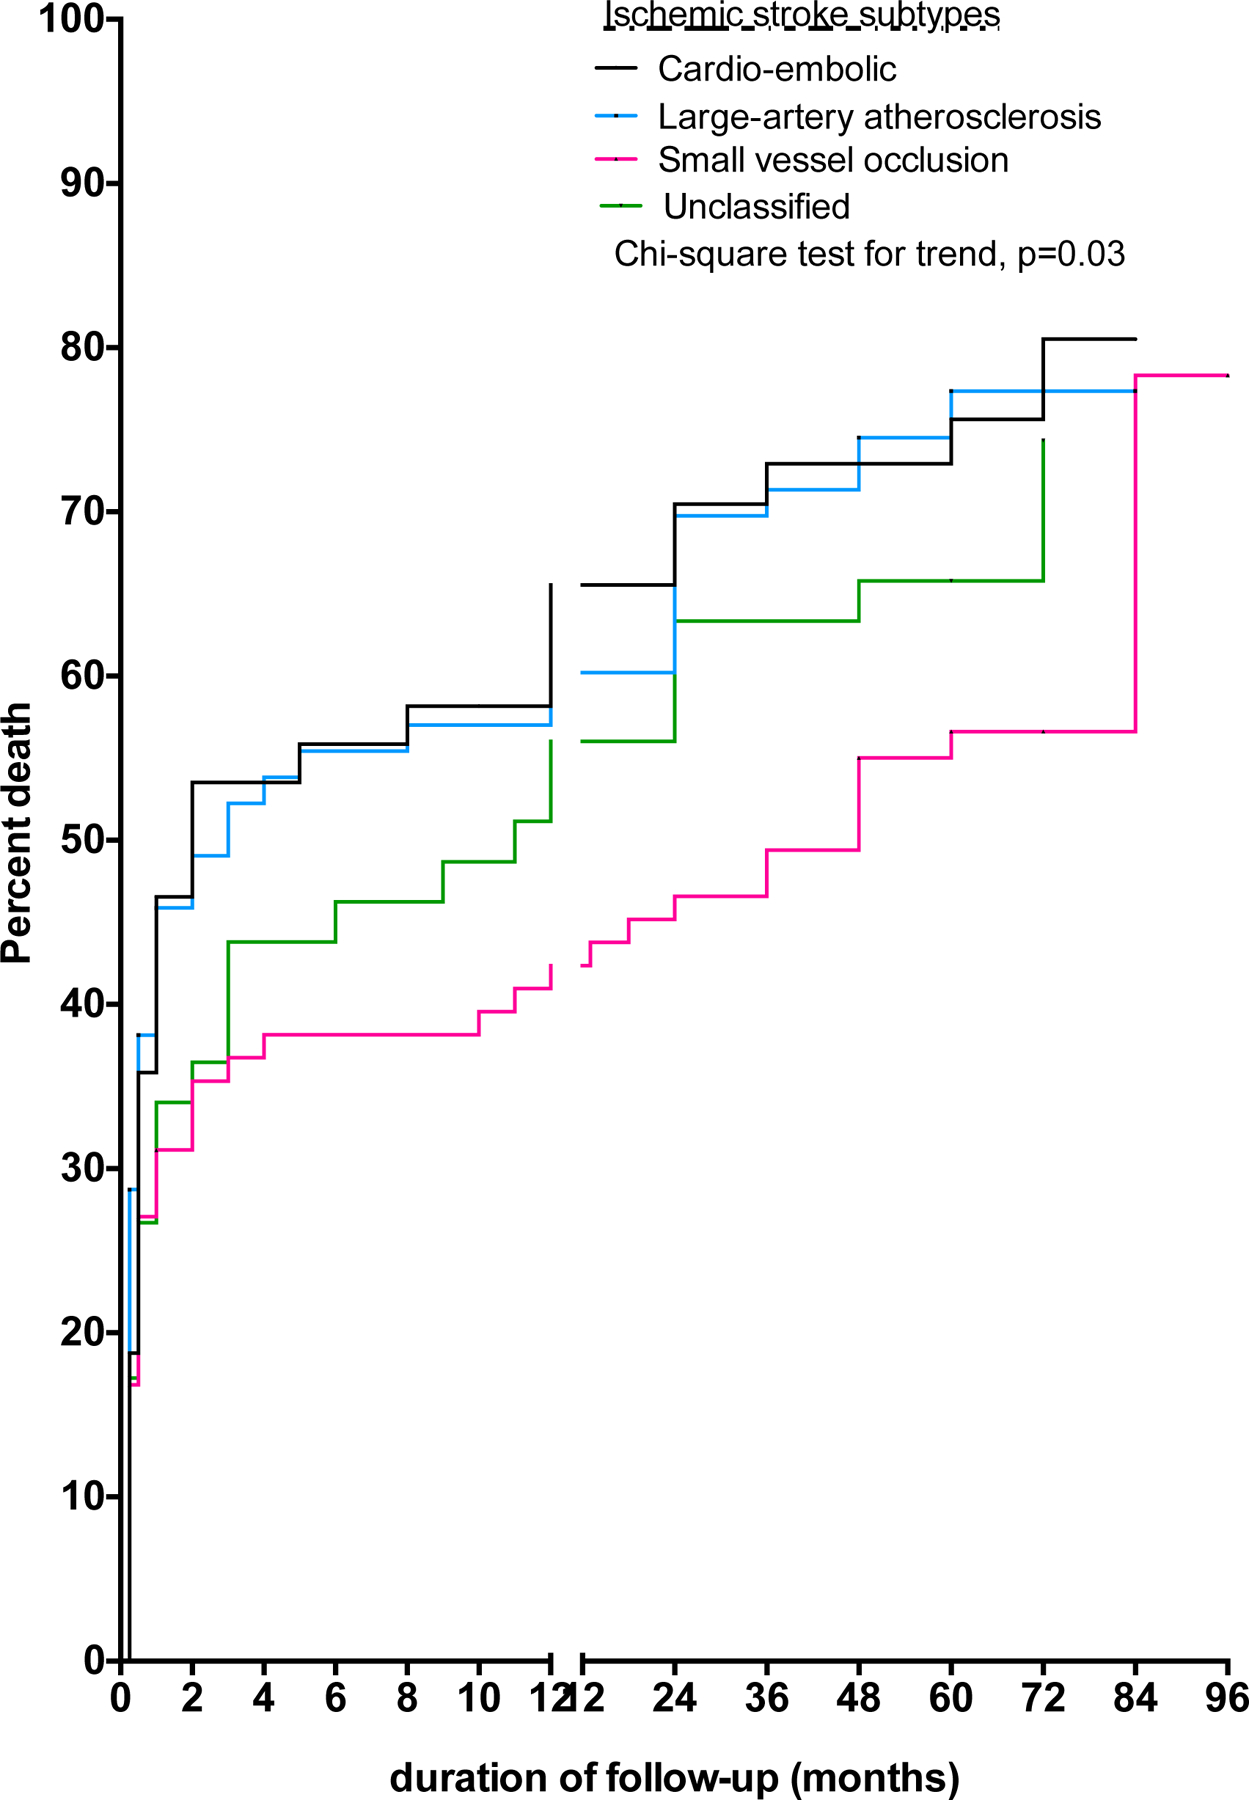
Survival probability after ischemic stroke (IS) by etiologic subtypes in Ghana
TABLE 5.
Determinants of longer-term mortality after Intracerebral hemorrhage
| Variable | Unadjusted Hazard ratio (95% CI) |
P-value | Adjusted Hazard ratio (95% CI) | P-value |
|---|---|---|---|---|
| Each 10-year rise | 1.28 (1.11–1.47) | 0.0006 | 1.21 (1.05–1.40) | 0.009 |
| Female sex | 1.46 (0.98–2.19) | 0.06 | 1.16 (0.75–1.79) | 0.50 |
| No formal education | 1.96 (1.20–3.18) | 0.007 | 1.22 (0.68–2.19) | 0.50 |
| Monthly income <$100 | 1.10 (0.72–1.69) | 0.65 | -- | -- |
| Diabetes | 0.99 (0.61–1.59) | 0.96 | -- | -- |
| Hypercholesterolemia | 1.15 (0.76–1.72) | 0.51 | -- | -- |
| Alcohol | 0.93 (0.55–1.57) | 0.79 | -- | -- |
| Smoking | 0.90 (0.43–1.85) | 0.76 | -- | -- |
| Previous stroke | 1.17 (0.54–2.54) | 0.69 | -- | -- |
| MRS, each unit higher | 1.68 (1.28–2.19) | 0.0001 | 1.62 (1.24–2.12) | 0.0004 |
| Hypertension | 0.75 (0.10–5.41) | 0.77 | -- | -- |
| Unclassified | 1.20 (0.11–13.21) | 0.88 | ||
| Structural | 0.93 (0.12–7.30) | 0.94 | ||
| Amyloid angiopathy | 1.00 |
Figure 3:

Survival probability after ischemic stroke (IS) by etiologic subtypes in Ghana.
Sensitivity Analyses by sex, age category, and index stroke:
Survival analysis comparing males versus female showed a higher probability of death for females more than males being 54.7% vs 45.3% at 12 months, and 70.9% vs 59.6% at 60 months, p=0.02 (Supplementary data, Table S1). Furthermore, longer-term mortality for those <50 years was significantly lower than those ≥50 years or older as was those with first-ever stroke versus those with previous stroke (Table 6).
Table 6.
Probability of Death by Age, Sex and Index Stroke
| Sex | Age category | Number of strokes | ||||
|---|---|---|---|---|---|---|
| Month | Male | Female | Age <50 | Age >50 | First-ever stroke | Recurrent stroke |
| 1 month | 34.7 | 40.7 | 27.7 | 41.4 | 37.3 | 42.7 |
| 3 months | 39.8 | 47.5 | 33.8 | 47.2 | 41.9 | 54.1 |
| 12 months | 45.3 | 54.7 | 35.8 | 55.5 | 46.0 | 69.9 |
| 24 months | 48.6 | 60.1 | 38.9 | 59.2 | 50.0 | 72.9 |
| 36 months | 50.9 | 65.0 | 39.9 | 64.0 | 53.8 | 74.4 |
| 48 months | 55.5 | 68.9 | 45.0 | 67.7 | 58.8 | 75.9 |
| 60 months | 56.1 | 70.9 | 46.3 | 68.6 | 59.9 | 78.1 |
| 72 months | 59.6 | 70.9 | 46.3 | 71.2 | 62.7 | 78.1 |
| p = 0.02 | p <0.0001 | p = 0.004 | ||||
Causes of early mortality:
Among 197 study participants who died within 30 days of stroke onset, causes of death included aspiration pneumonia 94 (50.5%), raised intracranial pressure 12 (6.5%), urosepsis 4 (2.1%), ventricular arrhythmia 1 (0.5%) and cause of death not recorded in 75 (40.3%).
Discussion
This is the largest study from sub-Saharan Africa to report on longer term survival after admission with stroke. We followed the trajectory of mortality among 556 stroke cases admitted into a tertiary medical center in Ghana and found that approximately 40% of stroke deaths occurred within the first month, after which a more gradual rise in mortality ensued over the longer term. The cumulative mortality rate was 49.7% at 1 year, increasing to 62.9% in 5 years and up to 73.7% in 8 years. The risk of long-term mortality from stroke in Ghana is comparable with data from Tanzania reported almost a decade ago.5–7 However, in the Tanzanian study mortality rate between 7 to 10 years after stroke was estimated at 84% compared with 74% in the present study. A caveat worth noting is that follow-up for the Tanzanian study was a bit longer than our study. Of interest, our data concurs even with that from the South London Stroke Register which reported 1-year, 5-years and 10-year mortality rates of 36.3%, 57.2% and 76% respectively in the United Kingdom.14 Similarly, the 10-year probability of mortality after stroke in Perth, Australia was 79% almost two decades ago.15 Thus long-term post-stroke mortality rates across diverse regions of globe are generally poor. It remains to be determined whether long term survival has been significantly enhanced with the advent of reperfusion therapies especially for large vessel occlusive strokes in high-income countries (HICs). In the African context, these high-end therapies are not routinely available and stroke afflict a predominantly young-to-middle age group16,17 relative to the scenario in HICs. The geographical and temporal contexts should be borne in mind when comparing long-term survival after stroke in different settings.
We observed a higher relative hazard of mortality after ischemic strokes than intracerebral hemorrhage on crude analysis. The survival curve of ICH ran parallel to that of ischemic stroke within the first 30 days but diverged lower over the longer-term follow-up (Figure 1). It is intriguing that rates of early mortality did not differ by primary stroke type but this could be reflective of the quality of hyperacute and acute stroke services in our settings. Over the long term, the adequacy of implementation of secondary prevention therapies is a key determinant of stroke survival. In this regard, ischemic strokes demonstrate more diversity in its etiology and affects an older age group18 who tend to aggregate multiple risk factors compared with ICH. A more nuanced approach is therefore needed in tailoring secondary prevention therapies consequent upon knowledge of specific etiologic mechanisms of ischemic stroke. Challenges such as limited investigative capabilities to ascertain the causes of stroke and cost of secondary prevention may contribute to the higher long-term case fatality for ischemic strokes within context of the study. On the other hand, we have shown that nearly 95% of all intracerebral bleeds in Ghana are homogeneously associated with hypertension-related rupture of small penetrating cerebral vessels to the basal ganglia and thalami.19 Perhaps after surviving an ICH, secondary prevention for a younger age group may be more achievable than it is for ischemic stroke.
Increasing age, having no formal education and severe functional status at stroke onset were factors independently associated with stroke mortality in Ghana. Each 10-year rise in age was accompanied by 12% higher hazards of death. Age adversely accentuates post-stroke mortality risk due to diminishing resilience imposed by increasing fragility, greater aggregation of vascular risk factors and higher complication rates after stroke in the elderly. Having no formal education increased the hazard of mortality by 36% compared with those with some education. As a socio-economic indicator, differences in educational attainment predicts excess stroke mortality even in high-income income countries. Longitudinal data from 10 European countries clearly showed that differences in educational status increased stroke mortality by a relative risk of 1.27 (95% CI: 1.24–1.30) in men and 1.29 (95%CI: 1.27–1.32) in women.20 Low educational status may negatively affect healthcare utilization after stroke and awareness and control of vascular risk factors. A lower monthly income of <$100 was independently associated with stroke mortality among those with ischemic stroke but not ICH in sensitivity analysis. Among the vascular risk factors, diabetes increased the hazards of mortality by 41% in the ischemic stroke cases in line with several other studies.21,22 Quite predictably, more severe functional status after stroke was potently associated with stroke mortality for both ischemic and ICH.
The high rate of deaths in the immediate post-acute phase of stroke requires urgent policy attention. Investing in stroke units at tertiary, secondary and district level hospitals coupled with training of hospital staff on guidelines and protocols applicable to their specific context is an imperative.23 Patient-, provider- and policy-level interventions for improved uptake of primary and secondary prevention through vascular risk factor control of cardio-metabolic risk factors should be pursued aggressively to curtail the escalating burden of stroke in SSA. The effectiveness of the use of mobile health interventions and simplified pharmacological approaches such as deployment of cardiovascular polypill through implementation studies in these regions should be tested via implementation science study designs.
This study has limitations. Nearly 20% of the sample size were lost-to-follow up after being discharged home alive. We censored these observations in our survival analysis methodology. In Ghana, stroke survivors are routinely discharged home after receiving acute care. Ascertaining the exact causes of death among those who died outside of hospital is challenging in resource-limited settings where deaths are not routinely certified. Among those who died within 30 days, the exact cause of death was available in only 60% of this sub-sample with aspiration pneumonia being the most frequent cause of death documented. In our analysis, we did not adjust for temporal trends in stroke treatments that may have evolved over the study period.
An important strength of the present study is that stroke cases were followed up for their survival status from the time of admission with acute stroke. Two previous studies reported long term outcomes of stroke in Ghana but had notable limitations. One registry analysis included only stroke cases who had survived the post-acute stroke phase and thus failed to capture early mortality from stroke.24 The other involved longitudinal follow-up of a small sample of stroke survivors (n=60) who were participants of a clinical trial of a mobile health intervention to control blood pressure after stroke.25 Pertinently, a recent meta-analysis of post-stroke survival in Africa did not report data on stroke survival beyond 5 years.26 Future studies should include assessment of rates of stroke recurrence and the impact of secondary prevention strategies in mitigating adverse outcomes of stroke in the African context. This will help inform the design of clinical trials aiming to mitigate adverse cardiovascular outcomes27–31, post-stroke comorbidities32–37 and functional recovery38,39 after stroke in Africa.
Conclusion
Approximately 3 out of 4 Ghanaians diagnosed with stroke die within 8 years after admission with stroke. Health systems in LMICs such as Ghana urgently need to embark on massive public education on stroke prevention, and build capacity of the health workforce and infrastructural development to help optimize stroke care in these regions.
Table 2:
Probability of Death After Stroke using survival analysis by stroke type
| Month | All Strokes % (95% CI) |
Ischemic stroke % (95% CI) |
Intracerebral hemorrhage % (95% CI) |
|---|---|---|---|
| 1 month | 37.5 (32.1 – 42.9) | 47.8 (40.9 – 54.3) | 40.4 (31.4 – 49.2) |
| 3 months | 43.2 (38.1 – 48.2) | 54.4 (48.2 – 60.2) | 44.7 (36.1 – 52.9) |
| 12 months | 49.7 (45.0 – 54.3) | 62.3 (57.0 – 67.1) | 47.2 (38.9 – 55.0) |
| 24 months | 53.9 (49.5 – 58.1) | 66.2 (61.4 – 70.5) | 48.5 (40.4 – 56.1) |
| 36 months | 57.4 (53.2 – 61.4) | 68.0 (63.4 – 72.1) | 53.5 (46.0 – 60.4) |
| 48 months | 61.7 (57.8 – 65.3) | 70.6 (66.1 – 74.4) | 59.1 (52.3 – 65.2) |
| 60 months | 62.9 (59.1 – 66.4) | 71.7 (67.6 – 75.4) | 59.9 (53.2 – 65.9) |
| 72 months | 64.9 (61.0 – 68.5) | 74.3 (70.2 – 78.1) | 59.9 (53.2 – 65.9) |
| 84 months | 73.7 (65.8– 80.1) | 87.2 (76.2 – 93.3) | 59.9 (53.2 – 65.9) |
| 96 months | 73.7 (65.8– 80.1) | 87.2 (76.2 – 93.3) | 59.9 (53.2 – 65.9) |
Highlights.
To evaluate the trajectory of mortality up to 8 years after stroke by its primary types in Ghana
Mortality rates at 1, 5 and 8 years were 49.7%, 62.9%, and 73.7% respectively
Crude mortality rates from intracerebral hemorrhage were lower than that for ischemic stroke
Increasing age, educational status and stroke severity were predictors of long-term mortality
Acknowledgements:
Funded by the National Heart, Lung, and Blood Institute (R01 HL152188)
Footnotes
Publisher's Disclaimer: This is a PDF file of an unedited manuscript that has been accepted for publication. As a service to our customers we are providing this early version of the manuscript. The manuscript will undergo copyediting, typesetting, and review of the resulting proof before it is published in its final form. Please note that during the production process errors may be discovered which could affect the content, and all legal disclaimers that apply to the journal pertain.
Disclosures: None
References
- 1.Feigin VL, Krishnamurthi RV, Parmar P, et al. Update on the Global Burden of Ischemic and Hemorrhagic Stroke in 1990–2013: The GBD 2013 Study. Neuroepidemiology 2015;45(3):161–76. [DOI] [PMC free article] [PubMed] [Google Scholar]
- 2.Feigin VL, Forouzanfar MH, Krishnamurthi R, et al. Global and regional burden of stroke during 1990–2010: findings from the Global Burden of Disease Study 2010. Lancet 2014. January 18;383(9913):245–54. [DOI] [PMC free article] [PubMed] [Google Scholar]
- 3.Sarfo FS, Akassi J, Awuah D, et al. Trends in stroke admission and mortality rates from 1983 to 2013 in Central Ghana. J Neurol Sci 2015; 357 (1–2):240–5. [DOI] [PubMed] [Google Scholar]
- 4.Owolabi MO, karolo-Anthony S, Akinyemi R, et al. The burden of stroke in Africa: a glance at the present and a glimpse into the future. Cardiovasc J Afr 2015. March;26(2 Suppl 1):S27–S38. [DOI] [PMC free article] [PubMed] [Google Scholar]
- 5.Walker RW, Jusabani A, Aris E, et al. Correlates of short- and long-term case fatality within an incident stroke population in Tanzania. S. Afr Med J 2013;103: 107–12. [DOI] [PubMed] [Google Scholar]
- 6.Walker R, Whiting D, Unwin N, et al. Stroke incidence in rural and urban Tanzania: a prospective, community-based study. Lancet Neurol 2010;9:786–92. [DOI] [PubMed] [Google Scholar]
- 7.Walker RW, Wakefield K, Gray WK, Jusabani A, Swai M, Mugusi F. Case-fatality and disability in the Tanzania Stroke Incidence Project cohort. Acta Neurol Scand 2016;133: 49–54. [DOI] [PMC free article] [PubMed] [Google Scholar]
- 8.Kolominsky-Rabas PL, Weber M, Gefeller O, Neundoerfer B, Heuschmann PU. Epidemiology of ischaemic stroke subtypes according to TOAST Criteria: incidence, recurrence, and long-term survival in ischaemic stroke subtypes: a population-based study. Stroke 2001;32:2735–2740. [DOI] [PubMed] [Google Scholar]
- 9.Meretoja A, Strbian D, Putaala J, Curtze S, Haapaniemi E, Mustanoja S, et al. SMASH-U: a proposal for etiologic classification of intracerebral hemorrhage. Stroke 2012;43:2592–7. [DOI] [PubMed] [Google Scholar]
- 10.O’Donnel MJ, Chin SL, Rangarajan S, Xavier D, Liu L, Zhang H, Rao-Melacini P, Zhang X, Pais P, Agapay S, et al. Global and regional effects of potentially modifiable risk factors associated with acute stroke in 32 countries (INTERSTROKE): a case-control study. Lancet 2016; 388 (10046): 761–75. [DOI] [PubMed] [Google Scholar]
- 11.Alberti KG, Zimmet PZ. Definition, diagnosis and classification of diabetes mellitus and its complications. Part 1: diagnosis and classification of diabetes mellitus provisional report of a WHO consultation. Diabet Med 1998;15:539–53. [DOI] [PubMed] [Google Scholar]
- 12.National Cholesterol Education Program (NCEP) Expert Panel on Detection, Evaluation, and Treatment of high blood cholesterol in adults (Adult treatment panel). Third report of the National Cholesterol Education Program (NCEP) expert panel on detection, evaluation, and treatment of high cholesterol in adults (Adult Treatment Panel III). Circulation 2002;106:3143–21. [PubMed] [Google Scholar]
- 13.World Health Organization. Waist circumference and waist-hip ratio. Report of a WHO expert consultation 2008. http://www.who.int/nutrition/publications/obesity/WHO_report_waistcircumference_and_waisthip_ratio/en/. Assessed May 27, 2019.
- 14.Wolfe CD, Critchton SL, Heuschmann PU, et al. Estimates of outcomes up to 10 years after stroke: analysis from the prospective South London Stroke Register. PLoS Med 2011;8:e1001033. [DOI] [PMC free article] [PubMed] [Google Scholar]
- 15.Hardie K, Hankey GJ, Jamrozik K, Broadhurst RJ, Anderson C. Ten-year survival after first-ever stroke in the Perth community stroke study. Stroke 2003;34(8):1842–6. [DOI] [PubMed] [Google Scholar]
- 16.Sarfo FS, Ovbiagele B, Gebregziabher M, Wahab K, Akinyemi R, Akpalu A, et al. Stroke among young West Africans: Evidence from the SIREN (Stroke Investigative Research and Educational Network) large multisite case-control study. Stroke 2018;49(5):1116–1122. [DOI] [PMC free article] [PubMed] [Google Scholar]
- 17.Sarfo FS, Akpa O, Ovbiagele B, Akpalu A, Wahab K, Komolafe M, et al. Influence of age on links between major modifiable risk factors and stroke occurrence in West Africa. J Neurol Sci 2021;428:117573. [DOI] [PMC free article] [PubMed] [Google Scholar]
- 18.Sarfo FS, Ovbiagele B, Gebregziabher M, Akpa O, Akpalu A, Wahab K, Ogbole G, Akinyemi R, Obiako R, Komolafe M, et al. Unraveling the risk factors for spontaneous intracerebral hemorrhage among West Africans. Neurology 2020. Mar 10;94: e998–e1012. [DOI] [PMC free article] [PubMed] [Google Scholar]
- 19.Sarfo FS, Ovbiagele B, Akpa O, Akpalu A, Wahab K, Obiako R, et al. Risk factor characterization of ischemic stroke subtypes among West Africans. Stroke 2021. Sep 30; [DOI] [PMC free article] [PubMed]
- 20.Avendano M, Kunst AE, Huisman M, van Lenthe F, Bopp M, Borrell C, et al. Educational level and stroke mortality. A comparison of 10 European populations during the 1990s. Stroke 2004;35:432–437. [DOI] [PubMed] [Google Scholar]
- 21.Kamalesh M, Shen J, Eckert GJ. Long term postischemic stroke mortality in diabetes. A Veteran Cohort Analysis. Stroke 2008;39:2727–31. [DOI] [PubMed] [Google Scholar]
- 22.Ray BK, Hazra A, Ghosal M, et al. Early and delayed fatality of stroke in Kolkata, India: results from a 7-year longitudinal population-based study. J Stroke Cerebrovasc Dis 2013;22(4):281–9. [DOI] [PubMed] [Google Scholar]
- 23.Prust ML, Saylor D, Zimba S, Sarfo FS, Shrestha GS, Berkowitz A, Vora N. Inpatient management of acute stroke of unknown type in resource-limited settings. Stroke 2022;53(3):e108–e117. [DOI] [PMC free article] [PubMed] [Google Scholar]
- 24.Sarfo FS, Akassi J, Kyem G, Adamu S, Awuah D, Kantanks OS, et al. Long-term outcomes of Stroke in a Ghanaian Outpatient Clinic. J Stroke Cerebrovasc Dis 2018;27(3):1090–1099. [DOI] [PMC free article] [PubMed] [Google Scholar]
- 25.Sarfo FS, Ovbiagele B. Key determinants of long-term post-stroke mortality in Ghana. J Neurol Sci 2022; :120123. [DOI] [PMC free article] [PubMed]
- 26.Adoukonou T, Kossi O, Mefo KF, Agbetou M, Magne J, Gbaguidi G, et al. Stroke case fatality in sub-Saharan Africa: Systematic review and meta-analysis. Int J Stroke 2021;16(8):902–916. [DOI] [PubMed] [Google Scholar]
- 27.Sarfo FS, Treiber F, Gebregziabher M, Adamu S, Nichols M, Singh A, et al. Phone-based intervention for blood pressure control among Ghanaian stroke survivors: a pilot randomized controlled trial. Int J Stroke 2019;14(6):630–638. [DOI] [PubMed] [Google Scholar]
- 28.Sarfo FS, Akpalu A, Bockarie A, Appiah L, Nguah SB, Ayisi-Boateng NK, et al. Phone-based Intervention under Nurse Guidance after Stroke (PINGS II) Study: Protocol for a Phase III Randomized Clinical Trial. J Stroke Cerebrovasc Dis 2021; 30(8):105888. [DOI] [PMC free article] [PubMed] [Google Scholar]
- 29.Amuasi J, Agbogbatey MK, Sarfo FS, Beyuo A, Duah K, Agasiya P, et al. Feasibility, acceptability, and appropriateness of a mobile health stroke intervention among Ghanaian health workers. J Neurol Sci 2022;439:120304. [DOI] [PubMed] [Google Scholar]
- 30.Sarfo FS, Sarfo-Kantanka O, Adamu S, Obese V, Voeks J, Tagge R, et al. Stroke Minimization through Additive Anti-atherosclerotic Agents in Routine Treatment (SMAART): study protocol for a randomized controlled trial. Trials 2018;19(1):181. [DOI] [PMC free article] [PubMed] [Google Scholar]
- 31.Sarfo FS, Ovbiagele B. Stroke minimization through additive anti-atherosclerotic agents in routine treatment (SMAART): A pilot trial concept for improving stroke outcomes in sub-Saharan Africa. J Neurol Sci 2017;377:167–173. [DOI] [PubMed] [Google Scholar]
- 32.Sarfo FS, Berchie P, Singh A, Nichols M, Agyei-Frimpong M, Jenkins C, et al. Prevalence, trajectory, and predictors of post-stroke fatigue among Ghanaians. J Stroke Cerebrovasc Dis 2019; 28(5):1353–1361. [DOI] [PMC free article] [PubMed] [Google Scholar]
- 33.Sarfo FS, Agbenorku M, Adamu S, Obese V, Berchie P, Ovbiagele B; PINGS Study investigators . The dynamics of poststroke depression among Ghanaians. J Neurol Sci 2019; 405:116410. [DOI] [PMC free article] [PubMed] [Google Scholar]
- 34.Sarfo FS, Akassi J, Adamu S, Obese V, Ovbiagele B. Burden and Predictors of poststroke cognitive impairment in a sample of Ghanaian stroke survivors. J Stroke Cerebrovasc Dis 2017; 26(11):2553–2562. [DOI] [PMC free article] [PubMed] [Google Scholar]
- 35.Sarfo FS, Jenkins C, Mensah NA, Saulson R, Sarfo-Kantanka O, Singh A, et al. Prevalence and predictors of sleep apnea risk among Ghanaian stroke survivors. J Stroke Cerebrovasc Dis 2017;26(7):1602–1608. [DOI] [PMC free article] [PubMed] [Google Scholar]
- 36.Sarfo FS, Akassi J, Obese V, Adamu S, Agbenorku M, Ovbiagele B. Prevalence and predictors of post-stroke epilepsy among Ghanaian stroke survivors. J Neurol Sci 2020; 418:117138. [DOI] [PubMed] [Google Scholar]
- 37.Sarfo FS, Akassi J, Badu E, Okorozo A, Ovbiagele B, Akpalu A. Profile of neurological disorders in an adult neurology clinic in Kumasi, Ghana. eNeurologicalSci 2016;3:69–74. [DOI] [PMC free article] [PubMed] [Google Scholar]
- 38.Sarfo FS, Adamu S, Awuah D, Ovbiagele B. Tele-neurology in sub-Saharan Africa: A systematic review of the literature. J Neurol Sci 2017; 380:196–199. [DOI] [PMC free article] [PubMed] [Google Scholar]
- 39.Sarfo FS, Adusei N, Ampofo M, Kpeme FK, Ovbiagele B. Pilot trial of telerehab intervention to improve outcomes after stroke in Ghana: A feasibility and user satisfaction study. J Neurol Sci 2018;387:94–97. [DOI] [PMC free article] [PubMed] [Google Scholar]