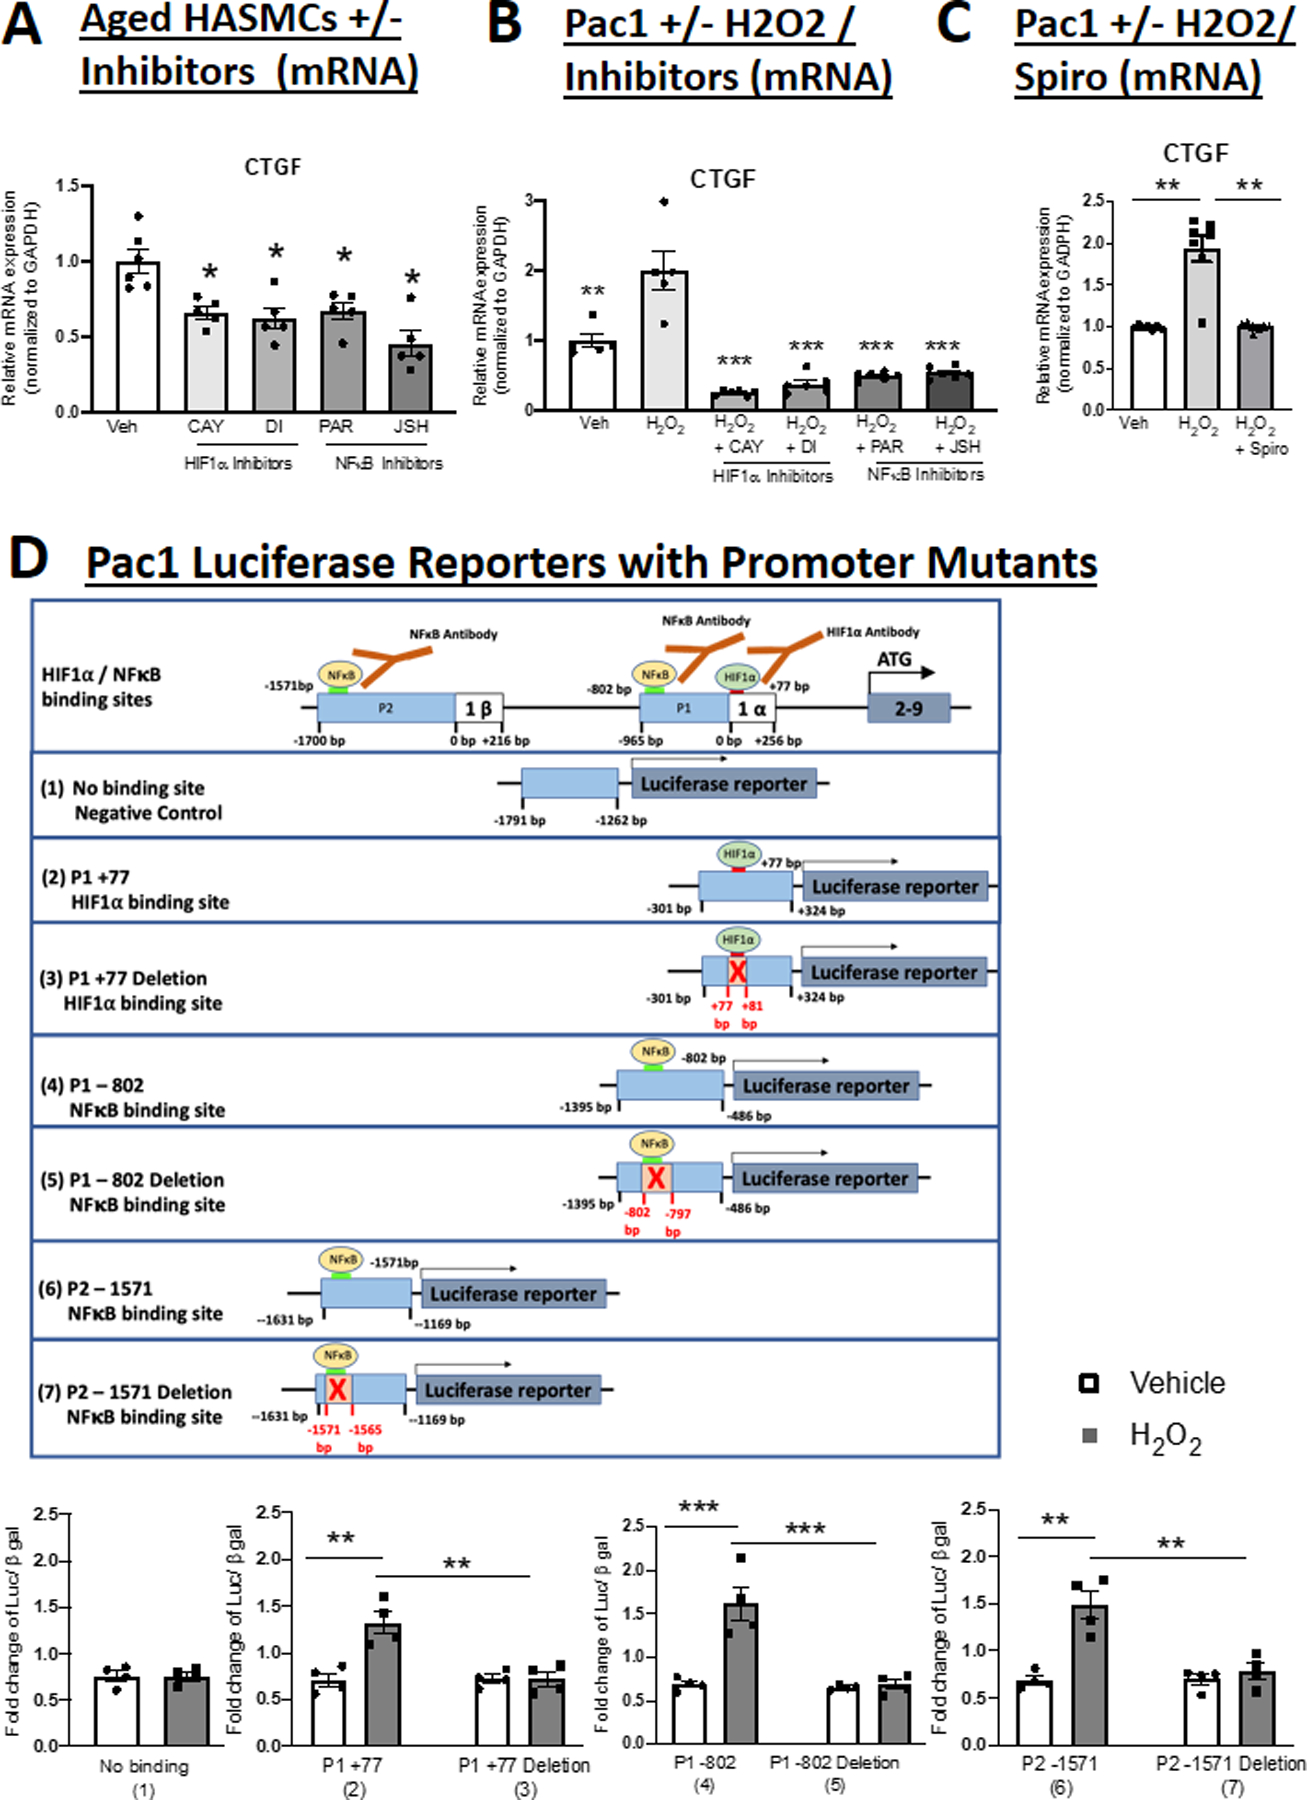
Figure 5. HIF1α- and NFκB Contribute to Pro-fibrotic MR Target Gene Expression in SMCs and their Binding Sites are Necessary for MR Gene Promoter Regulation by Oxidative Stress.

Quantification of Connective Tissue Growth Factor (CTGF) mRNA expression in; (A) Aged HASMCs treated with HIF1α or NFκB inhibitors; and (B) Pac1 SMCs treated with H2O2 and HIF1α inhibitors or NFκB inhibitors. N=5. (C) Pac1 SMCs treated with H2O2 and spironolactone (Spiro). N=7. (D) Schematic representation of luciferase constructed reporters containing regions of the MR P1 or P2 promoter containing a predicted HIF1α binding site that did not support transcription factor binding (1) or sites that bound HIF1α (2) or NFκB (4, 6) or the same constructs with the HIF1α (3) or NFκB (5, 7) sites deleted. Quantification of reporter activity in transfected Pac1 SMCs treated with vehicle versus hydrogen peroxide (H2O2) for 24 hours. N=4 experiments. Dot plots show the individual data points and bars indicate the mean with error bars indicating the SEM. One-way ANOVA with Tukey post hoc teste. (A) *p<0.05 versus Vehicle, (B) **p<0.01, ***p< 0.001 versus H2O2, (C) **p<0.01 versus H2O2, (D) **p<0.01, ***p<0.001.
