Abstract
Purpose: Radiotherapy is a promising treatment option for lung cancer, but patients’ responses vary. The purpose of the study was to investigate the potential of radiomics and clinical signature for predicting the radiotherapy sensitivity and overall survival of inoperable stage III and IV non-small-cell lung cancer (NSCLC) patients. Materials: This retrospective study collected 104 inoperable stage III and IV NSCLC patients at the Yunnan Cancer Hospital from October 2016 to September 2020. They were divided into radiation-sensitive and non-sensitive groups. We used analysis of variance (ANOVA) to select features and support vector machine (SVM) to build the radiomic model. Furthermore, the logistic regression method was used to screen out clinically relevant predictive factors and construct the combined model of radiomics–clinical features. Finally, survival was estimated using the Kaplan–Meier method. Results: There were 40 patients in the radiation-sensitive group and 64 in the non-sensitive group. These patients were divided into training set (73 cases) and testing set (31 cases) according to the ratio of 7:3. Nine radiomics features and one clinical feature were significantly associated with radiotherapy sensitivity. Both the radiomics model and combined model have good predictive performance (the areas under the curve (AUC) values of the testing set were 0.864 (95% confidence interval [CI]: 0.683-0.996) and 0.868 (95% CI: 0.689-1.000), respectively). Only platelet level status was associated with overall survival. Conclusion: The combined model constructed based on radiomics and clinical features can effectively identify the radiation-sensitive population and provide valuable clinical information. Patients with higher platelet levels may have a poor prognosis.
Keywords: radiomics signature, computed tomography, lung neoplasms, radiosensitivity, prognosis factors
Introduction
Lung cancer is the second most frequently diagnosed cancer type and has the highest mortality in the world,1 with non-small-cell lung cancer (NSCLC) accounting for 85% of all lung cancer cases.2 In 2020, according to statistics from 185 countries, it was estimated that the number of diagnosed cases was approximately 2 206 771 (accounting for 11.4% of all cancers), and the number of deaths was 1 796 144 (18.0%),3 with a 5-year relative survival rate of only 22%.4 The high mortality rate of lung cancer is related to the high malignancy and late diagnosis of the tumor. More than 60% of lung cancer patients are in the locally advanced stage (stage III) or have metastases (stage IV) at the time of treatment initiation.5 The 5-year relative survival rate in stage I patients is 57%, while that in stage IV patients drops to 4%.6 Advanced patients urgently need precise and effective treatments to improve their prognosis.
Although concurrent or sequential chemotherapy with radiotherapy has been a conventional treatment plan for inoperable NSCLC,7 radiotherapy and chemotherapy have not yet entered the era of precision medicine. In different patients, the sensitivity of tumor cells to treatment and the efficacy of radiotherapy are different.8 Some patients experience no obvious benefit after receiving radiotherapy. The tumor may still progress locally or even metastasize to distant organs. Some patients may also suffer additional radiotherapy-related adverse reactions (radiation pneumonitis, radiation esophagitis, bone marrow suppression, etc) due to exposure of normal tissues to radiation, resulting in unnecessary burden of medical expenses. At present, response evaluation criteria in solid tumors (RECIST) standards are mostly used in clinics for efficacy evaluation9; this method compares and classifies the changes in tumor and lymph node diameters on computed tomography (CT) images before and after treatment. However, the response of NSCLC tumors to radiotherapy and chemotherapy may be slow,10 resulting in a delay in the evaluation of efficacy. Furthermore, clinically, there is still a lack of early effective treatment sensitivity predictors to help clinicians evaluate the treatment response of the tumor before radiotherapy and adjust the treatment plan accordingly (such as enhanced chemotherapy or combined targeted or immunotherapy, etc) to improve patient prognosis.
Radiomics is an image analysis technique that enables quantitatively extracted image features from traditional medical images. Radiomics methods show strong predictive performance in the diagnosis and treatment of lung cancer. At present, radiomics methods have been employed to address various questions in the field of lung cancer, especially in NSCLC, including diagnosis and identification,11,12 staging, pathological typing,13 degree of differentiation, genotyping,14,15 selection of treatment options, toxic side effects,16 and prognostic evaluation.17,18 The process mainly includes data collection, image segmentation, feature extraction, feature selection, and model construction.19 In the diagnosis and treatment of lung cancer patients, CT is the preferred imaging examination method, and it is also the most widely used method in radiomics research. As lung tumors present a strong contrast in CT images, including differences in gray value intensity, texture differences, and shape differences of tumors in the image, it can provide guidance for clinical diagnosis and treatment. However, there have only been a few studies on radiosensitivity of NSCLC using CT-based radiomics until now.20,21 In previous studies using radiomics models to predict radiotherapy sensitivity, one study has explored the predictive performance of radiomics models and confirmed that they can accurately predict radiotherapy sensitivity.21 However, that study lacked the discussion of clinical factors involved. A number of studies have confirmed that the combination of radiomic features (such as intensity, shape, texture, or wavelet) extracted from medical images with clinical parameters can make clinical decision-making more accurate.22 Therefore, we aimed to develop and validate a prognostic model based on CT radiomics combined with clinical features to predict the radiotherapy sensitivity in patients with inoperable stage III and IV NSCLC.
Materials and Methods
This study was conducted in accordance with the Declaration of Helsinki and approved by the Ethics Committee of Kunming Medical University in Yunnan Province (approval number: KYLX202175). Informed consent was waived by the committee because of the retrospective nature of this study. The reporting of this study conforms to the Strengthening the Reporting of Observational Studies in Epidemiology (STROBE) guidelines.23 We have de-identified all patient details to ensure the confidentiality of patient information.
Patients: In this retrospective study, we selected patients with inoperable stage III and IV NSCLC at the Yunnan Cancer Hospital between October 2016 and September 2020. All patients received a complete standard radiotherapy regimen (60-66Gy/30-33f, intensity-modulated radiation therapy [IMRT] or 45-54Gy/5-10f, stereotactic body radiotherapy [SBRT]). Chemotherapy consists of two-drug cis/carboplatin-based regimens. Patients were treated with common chemotherapy regimens of cis/carboplatin plus etoposide or paclitaxel or pemetrexed every 21 days during radiotherapy. The platinum-partnered number of cycles depended on the histology and response of the tumor. Clinical data including medical records, laboratory examinations, and CT chest scan findings were collected. The inclusion criteria were as follows: (1) pathological examination confirmed NSCLC; (2) clinical stage III and IV according to the Eighth Edition of the American Joint Committee on Cancer guidelines; (3) no indication for surgery; and (4) Karnofsky performance scale score ≥70 points. The exclusion criteria were: (1) incomplete medical records (such as unclear TNM stage, unknown specific time and dose records of radiotherapy, and incomplete laboratory examination data); (2) interruption of the radiotherapy process; (3) non-primary lung radiotherapy; (4) receiving other treatments besides chemotherapy before radiotherapy, such as targeted therapy or immunotherapy; and (5) incomplete or poor quality CT images (CT images were missing within 1 month before or within 3 months after radiotherapy; CT images with interference factors such as respiratory movement or metal artifacts that make the image unclear, etc).
Our main study endpoint was the patient's response to radiotherapy. According to the RECIST v1.1 evaluation standard,9 the local response of the lesion was evaluated as complete response (CR), partial response (PR), stable disease (SD), and progressive disease (PD) by comparing CT images before and after radiotherapy. The radiation-sensitive group was defined as CR + PR, and the non-sensitive group was defined as SD + PD. Model predictive power was evaluated using the AUC.
Overall survival (OS) was defined as the time from the patient receiving radiotherapy to death due to any reason (for subjects who have been lost to follow-up before death, the time of the last medical record was calculated as the time of death).
CT examination acquisition: All images were obtained with a Siemens Somatom definition or Philips Brilliance, 64-slice, CT scanner. The imaging parameters were as follows: tube voltage, 90-120 kVp; automatic tube current modulation; collimation, 0.6 mm × 64; matrix, 512 × 512; rotation time, 0.6 s, reconstruction slice thickness, 1 or 2 mm. Detailed CT scanning parameters are provided in Supplementary Table 1.
The region of interest (ROI): Two radiologists used ITK-SNAP software (version 3.8.0; http://www.itksnap.org) to manually delineate lung lesions at all levels in the soft tissue window and lung window CT images layer by layer.24
Feature extraction: We used the Analysis-kit software (AK, version 3.2.0, GE Healthcare) to extract the texture features of the lesion image from the above ROI, which is one of the commonly used software in radiomics feature extraction and can extract a series of common radiomic features.25 To ensure a standardized voxel spacing in the entire queue, it was resampled to 0.8 × 0.8 × 1.5 mm³ before feature extraction. The box width was set to 25 housefield units (HU). In total, 2460 radiomics features were extracted from the soft tissue window and lung window images. To eliminate the large differences in the original feature data of different radiomics, all features underwent maximum and minimum normalization processing26 (the specific formula was: x′ = (x − min)/(max − min); where x′ represents the value of a single data, min is the minimum value of the column where the data was located, and max is the maximum value of the column where the data was located).
Feature screening and model establishment: We imported the radiomics features extracted above into FeAture Explorer (FAE, version 0.3.7; https://github.com/salan668/ FAE) software based on Python (3.7.6).27 To avoid group bias from differences in clinical characteristics, we randomly divided patients into training and testing sets at 7:3 according to the basic clinical characteristics of sex, age, smoking history, family history, pathology type, etc. Among them, the training set included 73 patients (28/45 = sensitive/non-sensitive) and 31 in the testing set (12/19 = sensitive/non-sensitive). To eliminate the imbalance between the training set data, we used UpSampling to randomly increase the number of samples to achieve a balance between the positive and negative samples. At the same time, two normalization methods (None normalization and MinMax normalization), one dimensionality reduction method (Pearson correlation coefficients), and four feature selectors (ANOVA, KW, Relief, and RFE) were used. The first 25 features and 10 categorizers (Adaboost, AE, Decision Tree, Gaussian Process, LDA, Logistic Regression, LR-Lasso, Naive Bayes, Random Forest, and SVM) were used for permutations to construct 2000 (2 × 1 × 4 × 25 × 10) models. Five-fold cross-validation was used on the training data set. For all constructed models, the receiver operating characteristic (ROC) curve analysis was used to evaluate the prediction performance, and the AUC was calculated for quantitative analysis. The critical value of the largest Yorden's index was selected to calculate the accuracy, sensitivity, specificity, positive predictive value (PPV), and negative predictive value (NPV). After comparing the above parameters, the 16 features contained in the optimized model were selected. Due to the small number of samples and the large number of features, we further adopted the ANOVA and SVM for feature selection and model building based on these 16 features to prevent the model from over-fitting. Nine features were finally selected for modeling. The radiomics score (Rad-Score) was calculated based on the selected radiomics features and corresponding functional relationships.
Selection of clinical features: The clinical data of the patients (eg, age, sex, smoking history, family history, pathological type, clinical stage, and blood test results within 1 week before radiotherapy [platelet count, neutrophil ratio, monocyte ratio, lymphocyte ratio, and carcinoembryonic antigen (CEA) level], etc) were collected. Univariate regression analysis was performed on the clinical variables one by one. To avoid the interference of confounding factors leading to the omission of related features, the variables with P values less than 0.15 in univariate analyses were further analyzed by multivariate logistic regression to assess clinical factors significantly associated with radiosensitivity.28
Combined model construction: A combined model incorporating Rad-Score and clinical factors was built with the least absolute shrinkage and selection operator (LASSO) logistic regression. Then, the ROC curve analysis and calculation of the AUC value were conducted to evaluate the predictive performance of the combined model.
Statistical analyses: Continuous variables are represented using mean ± standard deviation or median and quartile, and categorical variables are represented as frequency and percentage. The independent sample Student's t-test was used for continuous variables, categorical variables were analyzed using chi-square or Fisher's exact tests, and Wilcoxon rank-sum tests were performed for ranked data. P < 0.05 was considered statistically significant. Survival curves were generated using the Kaplan–Meier Method. All statistical analyses were performed using SPSS (version 26.0) and R software (version 4.1.2; https://www.R-project.org).
Results
Baseline Characteristics
A total of 104 patients with NSCLC were included in this study. The clinical information of the patients is shown in Table 1. The overall average age was 57.35 ± 9.554 (range: 31-80) years old, including 89 males (85.6%) and 15 females (14.4%). There were 67 cases (64.4%) of squamous cell carcinoma and 37 cases (35.6%) of adenocarcinoma. More than 70% of patients had a history of smoking. Among them, those in the training set and the test set had no significant differences in clinical baseline characteristics (sex, age, pathological type, smoking history, family history, clinical stage, etc) (Table 1).
Table 1.
Baseline Patient Characteristics.
| Total, n (%) | Training, n (%) | Testing, n (%) | P-value | |
|---|---|---|---|---|
| Group | 0.973 | |||
| Non-sensitive | 64 (61.5%) | 45 (61.6%) | 19 (61.3%) | |
| Radio-sensitive | 40 (38.5%) | 28 (38.4%) | 12 (38.7%) | |
| Sex | 0.063 | |||
| Male | 89 (85.6%) | 66 (90.4%) | 23 (74.2%) | |
| Female | 15 (14.4%) | 7 (9.6%) | 8 (25.8%) | |
| Age (years) | 57.35 ± 9.554 | 57.14 ± 9.375 | 57.84 ± 10.103 | 0.734 |
| Pathology | 0.377 | |||
| Adenocarcinoma | 37 (35.6%) | 24 (32.9%) | 13 (41.9%) | |
| Squamous cell carcinoma | 67 (64.4%) | 49 (67.1%) | 18 (58.1%) | |
| Smoke | 0.410 | |||
| Yes | 73 (70.2%) | 53 (72.6%) | 20 (64.5%) | |
| No | 31 (29.8%) | 20 (27.4%) | 11 (35.5%) | |
| Family history | 1.000 | |||
| Yes | 11 (10.6%) | 8 (11.0%) | 3 (9.7%) | |
| No | 93 (89.4%) | 65 (89.0%) | 28 (90.3%) | |
| T stage | 0.158 | |||
| 1 | 5 (4.8%) | 4 (5.5%) | 1 (3.2%) | |
| 2 | 29 (27.9%) | 18 (24.7%) | 11 (35.5%) | |
| 3 | 19 (18.3%) | 11 (15.1%) | 8 (25.8%) | |
| 4 | 51 (49.0%) | 40 (54.8%) | 11 (35.5%) | |
| N stage | 0.208 | |||
| 0 | 17 (16.3%) | 13 (17.8%) | 4 (12.9%) | |
| 1 | 6 (5.8%) | 3 (4.1%) | 3 (9.7%) | |
| 2 | 47 (45.2%) | 37 (50.7%) | 10 (32.3%) | |
| 3 | 34 (32.7%) | 20 (27.4%) | 14 (45.2%) | |
| M stage | 0.278 | |||
| 0 | 62 (59.6%) | 46 (63.0%) | 16 (51.6%) | |
| 1 | 42 (40.4%) | 27 (37.0%) | 15 (48.4%) | |
| Stage | 0.595 | |||
| IIIA | 24 (23.1%) | 16 (21.9%) | 8 (25.8%) | |
| IIIB | 28 (26.9%) | 22 (30.1%) | 6 (19.4%) | |
| IIIC | 10 (9.6%) | 8 (11.0%) | 2 (6.5%) | |
| IV | 42 (40.4%) | 27 (37.0%) | 15 (48.4%) | |
| CCRT | 0.477 | |||
| Yes | 35 (33.7%) | 23 (31.5%) | 12 (38.7%) | |
| No | 69 (66.3%) | 50 (68.5%) | 19 (61.3%) | |
| NLR | 1.885 (1.275, 2.698) | 1.780 (1.260, 2.675) | 2.060 (1.390, 3.010) | 0.384 |
| PLT_rank | 0.665 | |||
| Normal | 91 (87.5%) | 63 (86.3%) | 28 (90.3%) | |
| Reduced | 7 (6.7%) | 7 (9.6%) | 0 | |
| Elevated | 6 (5.8%) | 3 (4.1%) | 3 (9.7%) | |
| N_rank | 0.559 | |||
| Normal | 96 (92.3%) | 68 (93.2%) | 28 (90.3%) | |
| Reduced | 4 (3.8%) | 4 (5.5%) | 0 | |
| Elevated | 4 (3.8%) | 1 (1.4%) | 3 (9.7%) | |
| M_rank | 0.129 | |||
| Normal | 81 (77.9%) | 54 (74.0%) | 27 (87.1%) | |
| Reduced | 3 (2.9%) | 2 (2.7%) | 1 (3.2%) | |
| Elevated | 20 (19.2%) | 17 (23.3%) | 3 (9.7%) | |
| L_rank | 0.937 | |||
| Normal | 88 (84.6%) | 62 (84.9%) | 26 (83.9%) | |
| Reduced | 14 (13.5%) | 9 (12.3%) | 5 (16.1%) | |
| Elevated | 2 (1.9%) | 2 (2.7%) | 0 | |
| CEA_rank | 0.121 | |||
| Normal | 35 (33.7%) | 28 (38.4%) | 7 (22.6%) | |
| Elevated | 69 (66.3%) | 45 (61.6%) | 24 (77.4%) |
Abbreviations: CCRT, concurrent chemoradiotherapy; CEA, carcinoembryonic antigen; L, lymphocyte; M, monocyte; N, neutrophil; NLR, neutrophil-to-lymphocyte ratio; PLT, platelet.
Radiomics Features
A total of 2460 radiomic features (1228 and 1232 from lung and mediastinal windows, respectively) were extracted from the ROI of each lesion, including first-order features, shape features, and textural features (such as gray-level co-occurrence matrix [GLCM], gray-level size zone matrix [GLSZM], gray-level run length matrix [GLRLM], neighboring gray tone difference matrix [NGTDM], and gray-level dependence matrix [GLDM]).
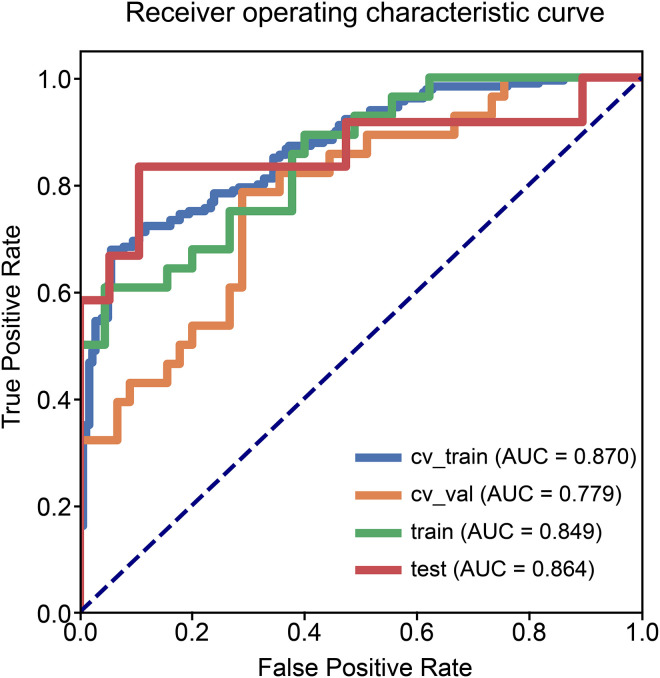
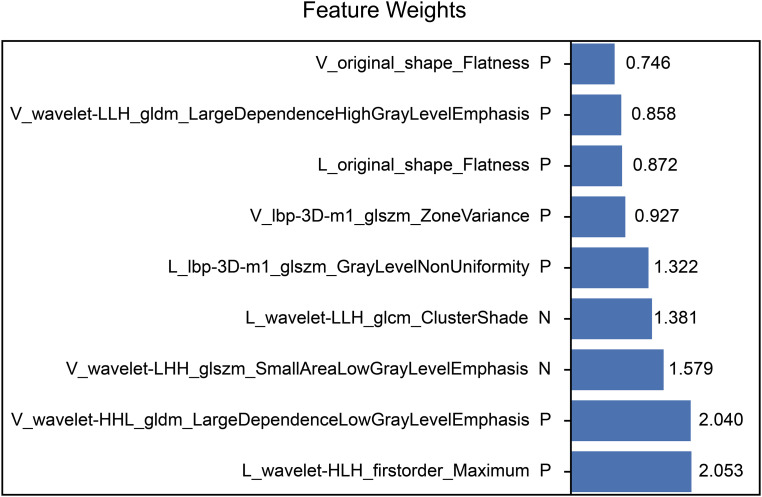
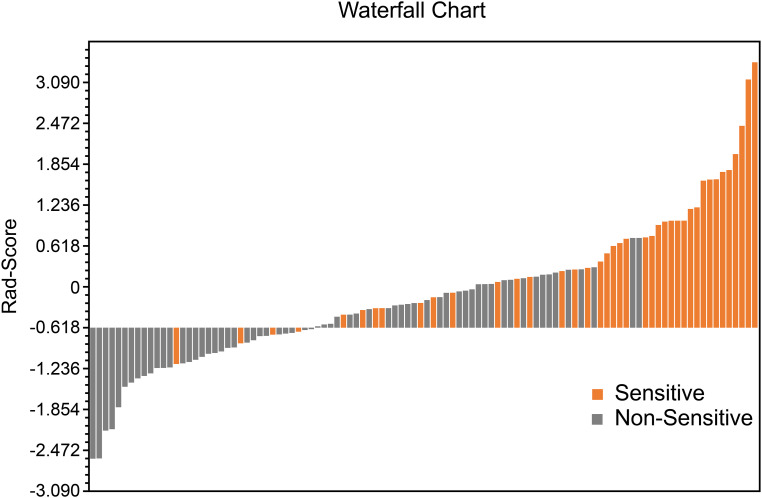
The performance of the radiomics model based on the 9 radiomics features for predicting radiosensitivity is shown in Table 2. The accuracy of the model in the training, testing, and cross-validation sets was 0.822, 0.871, and 0.740, respectively, and the AUC values were 0.849 (95% confidence interval [CI]: 0.755-0.931), 0.864 (95% CI: 0.683-0.996), and 0.779 (95% CI: 0.655-0.878), respectively. The corresponding ROC curves are shown in Figure 1. The Rad-Score was calculated based on the selected features and their coefficients (Supplemental Appendix A: Rad-Score, Figure 3), and the waterfall chart reflects the performance of the Rad-Score in the prediction (Figure 4).
Table 2.
Statistics in the Prediction.
| Statistics | Radiomics model | Combined model | ||||
|---|---|---|---|---|---|---|
| Training set | Testing set | Cross-validation set | Training set | Testing set | Cross-validation set | |
| ACC | 0.822 | 0.871 | 0.740 | 0.822 | 0.903 | 0.822 |
| AUC (95% CIs) | 0.849 (0.755-0.931) | 0.864 (0.683-0.996) | 0.779 (0.655-0.878) | 0.857 (0.761-0.935) | 0.868 (0.689-1.000) | 0.848 (0.735-0.930) |
| NPV | 0.796 | 0.895 | 0.842 | 0.796 | 0.900 | 0.796 |
| PPV | 0.895 | 0.833 | 0.629 | 0.895 | 0.909 | 0.895 |
| SEN | 0.607 | 0.833 | 0.786 | 0.607 | 0.833 | 0.607 |
| SPE | 0.956 | 0.895 | 0.711 | 0.956 | 0.947 | 0.956 |
Data in parentheses are 95% CIs.
Abbreviations: ACC, accuracy; AUC, area under the curve; CI, confidence interval; NPV, negative predictive value; PPV, positive predictive value; SEN, sensitivity; SPE, specificity.
Figure 1.
Receiver operating characteristic curves of the radiomics model.
Figure 3.
Nine features selected are presented. The coefficient indicates the feature's contribution to the model.
Figure 4.
Waterfall chart reflects the performance of the Rad-Score in the prediction of radiotherapy sensitivity.
Clinical Features
In the univariate analysis of clinical baseline characteristics, we identified several clinical characteristics related to radiotherapy sensitivity: smoking history, clinical stage, concurrent chemoradiotherapy (CCRT), and lymphocyte level status. Among the clinical characteristics, the P-value of the pathological type was greater than 0.15. However, in the actual theory, different types of cells had different responses to treatment; therefore, the pathological types were included in the multivariate logistic regression for analysis. In the multivariate analysis, only the clinical factor of CCRT showed significant differences between the radiation-sensitive and non-sensitive groups (Table 3).
Table 3.
Univariate and Multivariate Analyses of Factors Associated with Radiotherapy Sensitivity.
| Clinical factors | Univariate logistic regression | Multivariate logistic regression | ||
|---|---|---|---|---|
| OR (95% CIs) | P-value | OR (95% CIs) | P-value | |
| Sex Male Female |
Reference 4.154 (0.473, 36.494) |
0.199 | ||
| Age | 1.005 (0.955, 1.057) | 0.853 | ||
| Pathology Adenocarcinoma Squamous cell carcinoma |
Reference 1.379 (0.496, 3.833) |
0.537 |
Reference 1.277 (0.329, 4.951) |
0.723 |
| Smoke No Yes |
Reference 3.310 (0.975, 11.234) |
0.055 |
Reference 3.281 (0.833, 12.916) |
0.089 |
| Family history No Yes |
Reference 1.708 (0.391, 7.464) |
0.477 |
||
| Stage IIIA IIIB IIIC IV |
Reference 0.444 (0.119, 1.656) 0.778 (0.142, 4.265) 0.272 (0.073, 1.009) |
0.234 0.227 0.772 0.052 |
Reference 0.501 (0.119, 2.111) 1.077 (0.173, 6.699) 0.364 (0.074, 1.797) |
0.491 0.346 0.937 0.215 |
| CCRT No Yes |
Reference 2.318 (0.843, 6.372) |
0.103 |
Reference 3.282 (1.010, 10.663) |
0.048 |
| NLR | 1.281 (0.854, 1.922) | 0.231 | ||
| PLT_rank Normal Reduced Elevated |
Reference 0.650 (0.117, 3.619) 3.250 (0.279, 37.803) |
0.552 0.623 0.346 |
||
| N_rank Normal Reduced Elevated |
Reference 1.615 (0.214, 12.178) 0.000 |
0.897 0.642 1.000 |
||
| M_rank Normal Reduced Elevated |
Reference 1.455 (0.086, 24.512) 0.606 (0.187, 1.965) |
0.667 0.795 0.404 |
||
| L_rank Normal Reduced Elevated |
Reference 3.905 (0.887, 17.194) 1.952 (0.116, 32.796) |
0.186 0.072 0.642 |
Reference 4.116 (0.814, 20.824) 3.080 (0.120, 79.145) |
0.201 0.087 0.497 |
| CEA_rank Normal Elevated |
Reference 2.000 (0.729, 5.485) |
0.178 |
||
Data in parentheses are 95% CIs.
Abbreviations: CCRT, concurrent chemoradiotherapy; CEA, carcinoembryonic antigen; CI, confidence interval; L, lymphocyte; M, monocyte; N, neutrophil; NLR, neutrophil-to-lymphocyte ratio; OR, odds ratio; PLT, platelet.
Combined Model
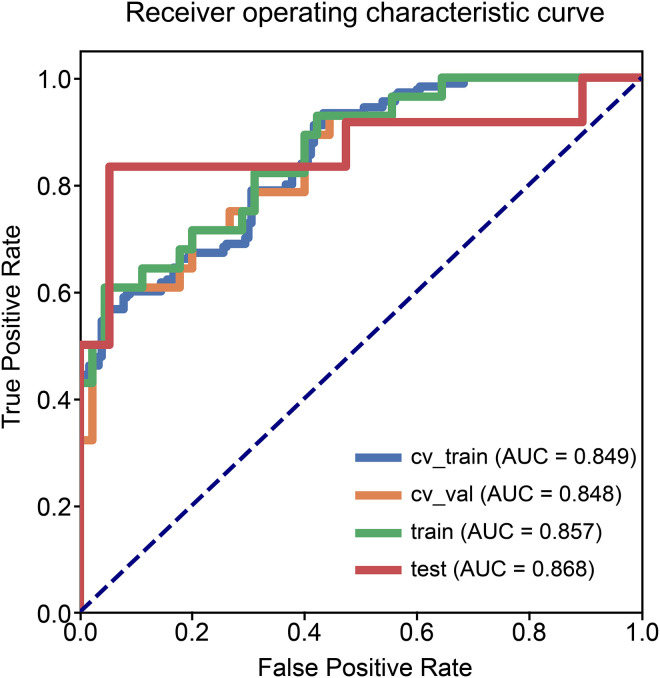
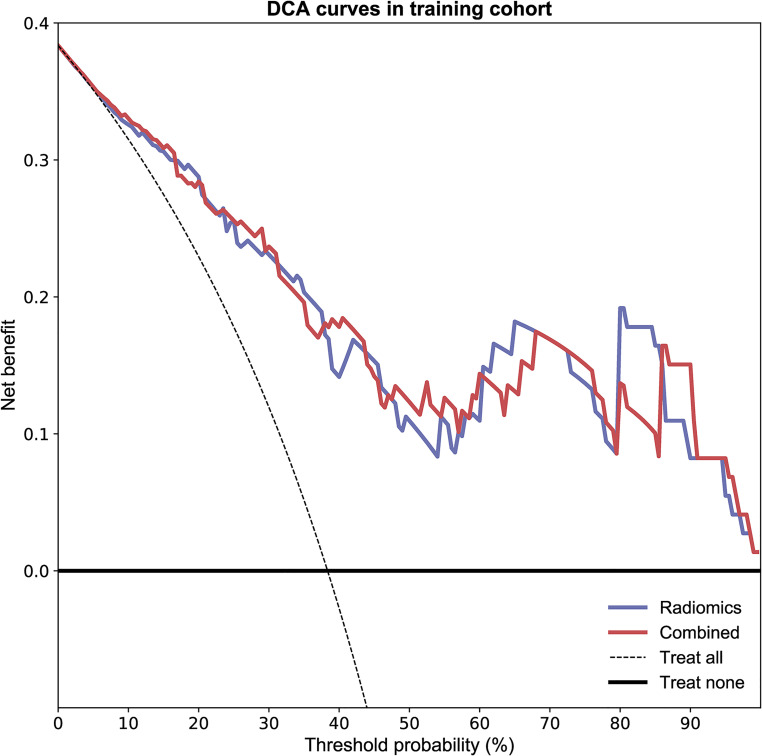
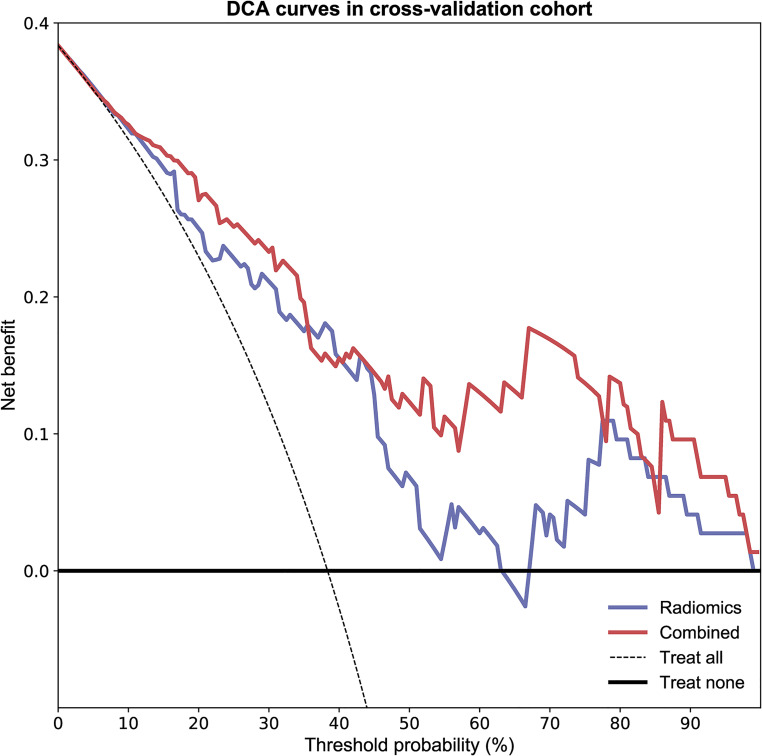
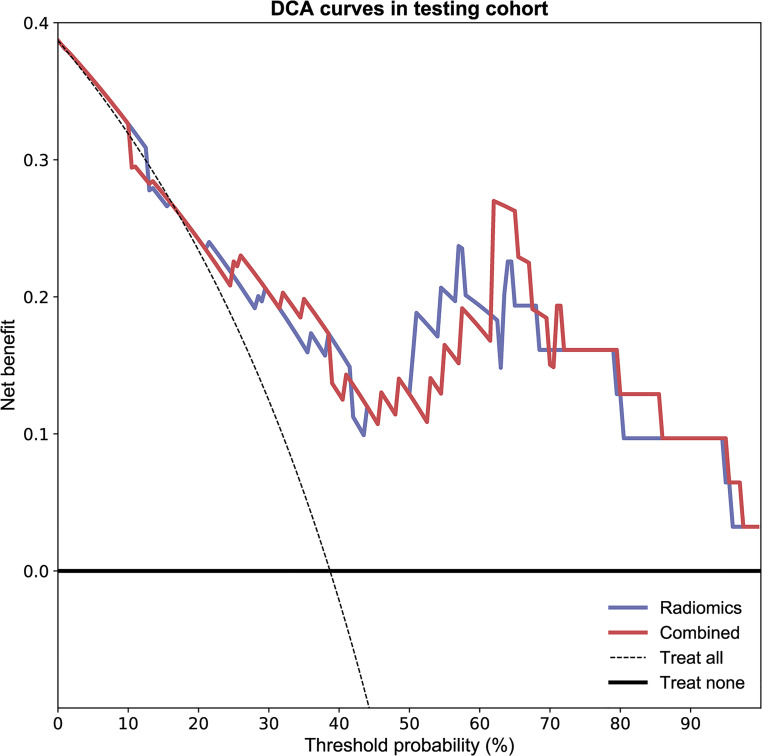
As shown in Figure 2 and Table 2, the combined model based on Rad-Score and CCRT had higher AUC values in the training (AUC = 0.857; 95% CI, 0.761-0.935), testing (AUC = 0.868; 95% CI, 0.689-1.000), and cross-validation sets (AUC = 0.848, 95% CI, 0.735-0.930). The accuracy of the testing set and cross-validation set increased to 0.903 and 0.822, respectively (Table 2). In addition, the sensitivity of the cross-validation set of the combined model was reduced compared with the radiomics model, but the specificity of the testing set and the cross-validation set was improved. The calibration plot revealed good predictive accuracy between the actual probability and prediction probability (Supplementary Figure 1). Decision curve analysis (DCA) further demonstrated higher overall net benefit for the combined model compared with the radiomic model (Figures 5 to 7).
Figure 2.
Receiver operating characteristic curves of the combined model.
Figure 5.
The decision curve analyses of the radiomic model and combined model in the training cohort.
Figure 7.
The decision curve analyses of the radiomic model and combined model in the cross-validation cohort.
Figure 6.
The decision curve analyses of the radiomic model and combined model in the testing cohort.
Survival Analysis Related with Each Factor
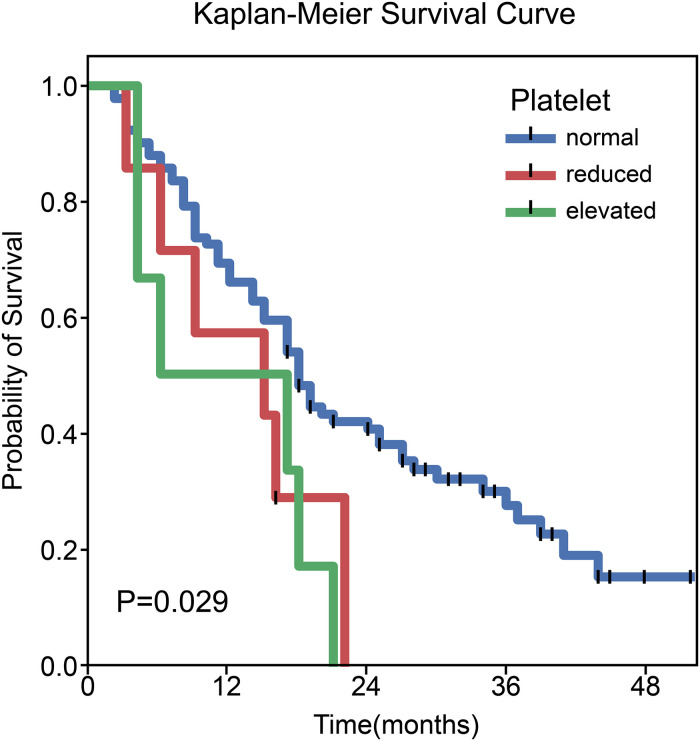
In the entire cohort, the median follow-up was 17.0 months (range: 2.0-52.0 months). Univariate and multivariate Cox regression analyses showed that neither concurrent chemotherapy nor Rad-Score had a significant correlation with OS. Univariate analysis revealed that platelet level status was significantly associated with OS (X² = 7.095, P = 0.029). The median survival times in the patients with reduced, normal, and elevated platelet levels were 15.0 months (95% CI: 0.000-30.397), 18.0 months (95% CI: 15.251-20.749), and 6.0 months (95% CI: 0.000-21.603), respectively (Figure 8).
Figure 8.
Kaplan–Meier curves of overall survival stratified by platelet levels (P = 0.029).
Discussion
In this study, the radiomics model we established performed well in predicting radiosensitivity in patients with inoperable stage III and IV NSCLC. This result proves that radiomics features have a certain role in predicting the short-term response to radiotherapy in NSCLC. We screened nine features in the radiomics model, and their meanings are explained in the appendix, respectively. Among the selected radiomics features, L_wavelet-HLH_firstorder_Maximum, V_wavelet-HHL_gldm_LargeDependenceLowGrayLevelEmphasis, and V_wavelet-LHH_glszm_SmallAreaLowGrayLevelEmphasis have a higher weight in the radiomics score, indicating that the greater the maximum gray level intensity, the rougher the texture of the tumor, and the better the radiotherapy sensitivity. At the same time, we found that concurrent chemoradiotherapy is also associated with radiosensitivity, and the combined model based on radiomics scores and clinical factors not only improved AUC values, but also demonstrated a higher overall net benefit.
In view of the analysis of clinical factors in this study, CCRT can improve the treatment response to radiotherapy in patients with NSCLC. However, not all patients can tolerate the toxic side effects caused by concurrent radiotherapy and chemotherapy in the clinical treatment process. As a result, patients with poor radiotherapy sensitivity may accept combination therapy, such as combined immunotherapy or targeted therapy, to improve radiation therapy efficiency if they cannot tolerate chemotherapy-related side effects.29 Among these, the optimized combination of radiotherapy and immunotherapy is an emerging field. Studies have shown that radiotherapy may stimulate or enhance the response to immune checkpoint inhibitors.30 The combination of immune checkpoint inhibitors and local radiotherapy will improve the control of local and distant metastases and ultimately improve the clinical outcome of patients with oligometastatic cancer.31 Therefore, the combination of radiotherapy and immunotherapy has certain prospects. Of course, this requires more experimental research to further explore this aspect and validate the effectiveness of this approach. In addition, the advancement of targeted therapy research, especially the development of tyrosine kinase inhibitors (TKIs), has also had a positive impact on therapeutic approaches. Studies have shown that the response to radiotherapy varies depending on the molecular status of tumors, and EGFR-mutated tumors respond well to radiotherapy.32 Another study on early lung adenocarcinoma found that KRAS mutations were associated with poor local control of SBRT treatment.33 Studies have also shown that the first-line use of radiotherapy and TKI treatment patterns are associated with better prognosis,34 while the use of upfront epidermal growth factor receptor-TKI (EGFR-TKI), and deferral of radiotherapy, is associated with inferior OS in patients with EGFR-mutant NSCLC who develop brain metastases.35 Precise lung cancer treatment includes not only precise radiotherapy technology but also precise targeted and immunotherapy. All of the above will be used to direct further research in the future and to provide help for each patient in choosing a more personalized treatment plan.
In our study, synchronized chemotherapy apparently did not help with survival. This result is quite different from that of many previous studies and meta-analyses in which concurrent chemotherapy improves OS; we believe that a possible reason is that most of the patients in this study had advanced T stage (about 67% of patients with T3-4). For these patients with large tumor volumes and extensive invasion of adjacent tissues and organs (such as the heart, esophagus, large blood vessels, etc.), local treatment is more difficult, increasing the radiation dose cannot preserve important tissues and organs, and reducing the radiation dose cannot achieve radical tumor cure. It is also more difficult to set up a field in the target area of radiotherapy. Therefore, most patients received several cycles of induction chemotherapy before radiotherapy to reduce the tumor treatment volume and normal tissue damage caused by radiotherapy. This is different from the rigorous CCRT in previous studies. Moreover, the results obtained in this study that CCRT after induction chemotherapy did not increase the survival benefit were consistent with the results of previous studies. Ardizzoni found that the addition of single agent taxane given concurrently to radiotherapy failed to significantly improve survival after platinum-based induction in locally advanced NSCLC.36
In addition, a number of previous studies have discussed the role of the neutrophil-to-lymphocyte ratio (NLR) in the prognostic assessment of NSCLC and have demonstrated that an increase in NLR over the course of radiotherapy had a negative impact on survival.37 Some studies have shown that NLR is associated with inferior outcomes in localized NSCLC treated with SBRT.38 In the results of this study, neither the univariate nor multivariate analysis showed a statistically significant impact of NLR. A possible reason is that some patients have received chemotherapy before radiotherapy, and the hematological toxicity of chemotherapy leads to different results of hematological examinations, which causes interference.
In the exploration of factors related to survival prognosis, we did not find a significant correlation between radiotherapy sensitivity and OS. There are several possible reasons worth considering for this observation. One reason for the failure to achieve significant survival-related benefits in patients with radiation-sensitive tumors is the limitation of radiotherapy associated with its side effects. Regarding this limitation, we need to consider whether an individualized dose setting in radiotherapy-sensitive patients is required, which, of course, requires further intensive investigation. In addition, in stage IV patients, death can be caused by metastases.
We found that platelet level status was correlated with OS patients with NSCLC after radiotherapy. Patients with platelet levels higher than normal had a poor prognosis. A number of previous studies have confirmed the existence of thrombocytosis and platelet activation in cancer patients, which can promote the growth, invasion, metastasis, and other malignant behaviors of tumors through a variety of mechanisms39–41 and are closely related to low survival rates. Our research results are consistent with these previous conclusions.
This study also had some limitations: (1) This was a single-center study with a small sample size. (2) The data collection was retrospective, and there may have been deviations in the record of previous medical records. (3) The study excluded patients who have received targeted or immunotherapy before radiotherapy, and there was a lack of research on these two types of patients. (4) The study included patients with NSCLC with different tumor node metastasis stages and failed to conduct a stratified analysis of the different stages.
Conclusions
Radiomic features extracted from CT images combined with clinical features have potential value in predicting radiosensitivity, which may provide more accurate treatment strategy guidance for clinicians treating NSCLC. For radiation-insensitive patients, radiotherapists around the world are actively exploring further possibilities for locally advanced or metastatic cancer treatment to provide a greater advantage to bring more treatment benefits to patients.
Supplemental Material
Supplemental material, sj-docx-1-tct-10.1177_15330338221142400 for Combined Radiomics–Clinical Model to Predict Radiotherapy Response in Inoperable Stage III and IV Non-Small-Cell Lung Cancer by Wenrui Chen, Li Wang, Yu Hou, Lan Li, Li Chang, Yunfen Li, Kun Xie, Linbo Qiu, Dan Mao, Wenhui Li and Yaoxiong Xia in Technology in Cancer Research & Treatment
Supplemental material, sj-docx-3-tct-10.1177_15330338221142400 for Combined Radiomics–Clinical Model to Predict Radiotherapy Response in Inoperable Stage III and IV Non-Small-Cell Lung Cancer by Wenrui Chen, Li Wang, Yu Hou, Lan Li, Li Chang, Yunfen Li, Kun Xie, Linbo Qiu, Dan Mao, Wenhui Li and Yaoxiong Xia in Technology in Cancer Research & Treatment
Supplemental material, sj-docx-4-tct-10.1177_15330338221142400 for Combined Radiomics–Clinical Model to Predict Radiotherapy Response in Inoperable Stage III and IV Non-Small-Cell Lung Cancer by Wenrui Chen, Li Wang, Yu Hou, Lan Li, Li Chang, Yunfen Li, Kun Xie, Linbo Qiu, Dan Mao, Wenhui Li and Yaoxiong Xia in Technology in Cancer Research & Treatment
Acknowledgments
We would like to thank Editage (www.editage.com) for English language editing and thank all colleagues involved in the study for their contributions.
Abbreviations
- AE
auto-encoder
- ANOVA
analysis of variance
- AUC
areas under the curve
- CEA
carcinoembryonic antigen
- CECT
contrast-enhanced computed tomography
- CI
confidence interval
- CR
complete response
- CT
computed tomography
- DCA
decision curve analysis
- EGFR
epidermal growth factor receptor
- EGFR-TKI
epidermal growth factor receptor–tyrosine kinase inhibitor
- HU
housefield units
- IMRT
intensity-modulated radiation therapy
- KRAS
Kirsten rat sarcoma viral oncogene
- KW
Kruskal–Wallis
- LDA
linear discriminant analysis
- LR-Lasso
logistic regression-least absolute shrinkage and selection operator
- NLR
neutrophil-to-lymphocyte ratio
- NPV
negative predictive value
- NSCLC
non-small-cell lung cancer
- OS
overall survival
- PD
progressive disease
- PPV
positive predictive value
- PR
partial response
- Rad-Score
radiomics score
- RECIST
response evaluation criteria in solid tumors
- RFE
recursive feature elimination
- ROC
receiver operating characteristic
- ROI
region of interest
- SBRT
stereotactic body radiotherapy
- SD
stable disease
- SVM
support vector machine
- TKI
tyrosine kinase inhibitor.
Footnotes
The author(s) declared no potential conflicts of interest with respect to the research, authorship, and/or publication of this article.
Ethics Statement: This study was conducted in accordance with the Declaration of Helsinki and approved by the Ethics Committee of Kunming Medical University in Yunnan Province (approval number: KYLX202175). Informed consent was waived by the committee because of the retrospective nature of this study. We have de-identified all patient details to ensure the confidentiality of patient information.
Funding: The author(s) disclosed receipt of the following financial support for the research, authorship, and/or publication of this article: This study was funded by the National Natural Science Foundation of China (No. 82060558), Yunnan Fundamental Research Projects (No. 202001AS70011), Ten-thousand Talents Program of Yunnan Province (Yunling scholar), Yunnan Provincial Training Special Funds for High-level Health Technical Personnel (No. L-2018001), Yunnan Health Training Project of High Level Talents (No. H-2019074), Kunming Medical University 2021 postgraduate innovation fund project (2021S254).
ORCID iD: Wenhui Li https://orcid.org/0000-0002-0312-7993
Supplemental Material: Supplemental material for this article is available online.
References
- 1.GBD 2019 Diseases and Injuries Collaborators. Global burden of 369 diseases and injuries in 204 countries and territories, 1990-2019: a systematic analysis for the global burden of disease study 2019. Lancet. 2020;396(10258):1204-1222. doi: 10.1016/S0140-6736(20)30925-9 [DOI] [PMC free article] [PubMed] [Google Scholar]
- 2.Molina JR, Yang P, Cassivi SD, Schild SE, Adjei AA. Non-small cell lung cancer: epidemiology, risk factors, treatment, and survivorship. Mayo Clin Proc. 2008;83(5):584-594. doi: 10.4065/83.5.584 [DOI] [PMC free article] [PubMed] [Google Scholar]
- 3.Sung H, Ferlay J, Siegel RL, et al. Global cancer statistics 2020: GLOBOCAN estimates of incidence and mortality worldwide for 36 cancers in 185 countries. CA Cancer J Clin. 2021;71(3):209-249. doi: 10.3322/caac.21660 [DOI] [PubMed] [Google Scholar]
- 4.Siegel RL, Miller KD, Fuchs HE, Jemal A. Cancer statistics, 2022. CA Cancer J Clin. 2022;72(1):7-33. doi: 10.3322/caac.21708 [DOI] [PubMed] [Google Scholar]
- 5.Meza R, Meernik C, Jeon J, Cote ML. Lung cancer incidence trends by gender, race and histology in the United States, 1973-2010. PLoS One. 2015;10(3):e0121323. doi: 10.1371/journal.pone.0121323 [DOI] [PMC free article] [PubMed] [Google Scholar]
- 6.Miller KD, Nogueira L, Mariotto AB, et al. Cancer treatment and survivorship statistics, 2019. CA Cancer J Clin. 2019;69(5):363-385. doi: 10.3322/caac.21565 [DOI] [PubMed] [Google Scholar]
- 7.Maconachie R, Mercer T, Navani N, McVeigh G. Guideline committee. Lung cancer: diagnosis and management: summary of updated NICE guidance. Br Med J. 2019;364:l1049. doi: 10.1136/bmj.l1049 [DOI] [PubMed] [Google Scholar]
- 8.Zhivotovsky B, Joseph B, Orrenius S. Tumor radiosensitivity and apoptosis. Exp Cell Res. 1999;248(1):10-17. doi: 10.1006/excr.1999.4452 [DOI] [PubMed] [Google Scholar]
- 9.Eisenhauer EA, Therasse P, Bogaerts J, et al. New response evaluation criteria in solid tumours: revised RECIST guideline (version 1.1). Eur J Cancer. 2009;45(2):228-247. doi: 10.1016/j.ejca.2008.10.026 [DOI] [PubMed] [Google Scholar]
- 10.Werner-Wasik M, Xiao Y, Pequignot E, Curran WJ, Hauck W. Assessment of lung cancer response after nonoperative therapy: tumor diameter, bidimensional product, and volume. A serial CT scan-based study. Int J Radiat Oncol Biol Phys. 2001;51(1):56-61. doi: 10.1016/s0360-3016(01)01615-7 [DOI] [PubMed] [Google Scholar]
- 11.Wang Z, Li N, Zheng F, et al. Optimizing the timing of diagnostic testing after positive findings in lung cancer screening: a proof of concept radiomics study. J Transl Med. 2021;19(1):191. doi: 10.1186/s12967-021-02849-8 [DOI] [PMC free article] [PubMed] [Google Scholar]
- 12.Chen BT, Chen Z, Ye N, et al. Differentiating peripherally-located small cell lung cancer from non-small cell lung cancer using a CT radiomic approach. Front Oncol. 2020;10:593. doi: 10.3389/fonc.2020.00593 [DOI] [PMC free article] [PubMed] [Google Scholar]
- 13.Zhu X, Dong D, Chen Z, et al. Radiomic signature as a diagnostic factor for histologic subtype classification of non-small cell lung cancer. Eur Radiol. 2018;28(7):2772-2778. doi: 10.1007/s00330-017-5221-1 [DOI] [PubMed] [Google Scholar]
- 14.Rios Velazquez ER, Parmar C, Liu Y, et al. Somatic mutations drive distinct imaging phenotypes in lung cancer. Cancer Res. 2017;77(14):3922-3930. doi: 10.1158/0008-5472.CAN-17-0122 [DOI] [PMC free article] [PubMed] [Google Scholar]
- 15.Liu G, Xu Z, Ge Y, et al. 3D Radiomics predicts EGFR mutation, exon-19 deletion and exon-21 L858R mutation in lung adenocarcinoma. Transl Lung Cancer Res. 2020;9(4):1212-1224. doi: 10.21037/tlcr-20-122 [DOI] [PMC free article] [PubMed] [Google Scholar]
- 16.Yang P, Peng X, Jin H, et al. Radiological prediction model of lung radiation pneumonitis based on dose line segmentation. Int J Radiat Oncol Biol Phys. 2021;111(3):e459-e460. doi: 10.1016/j.ijrobp.2021.07.1289 [DOI] [Google Scholar]
- 17.Khorrami M, Prasanna P, Gupta A, et al. Changes in CT radiomic features associated with lymphocyte distribution predict overall survival and response to immunotherapy in non–small cell lung cancer. Cancer Immunol Res. 2020;8(1):108-119. doi: 10.1158/2326-6066.CIR-19-0476 [DOI] [PMC free article] [PubMed] [Google Scholar]
- 18.Fave X, Zhang L, Yang J, et al. Delta-radiomics features for the prediction of patient outcomes in non-small cell lung cancer. Sci Rep. 2017;7(1):588. doi: 10.1038/s41598-017-00665-z [DOI] [PMC free article] [PubMed] [Google Scholar]
- 19.Gillies RJ, Kinahan PE, Hricak HH. Radiomics: images are more than pictures, they are data. Radiology. 2016;278(2):563-577. doi: 10.1148/radiol.2015151169 [DOI] [PMC free article] [PubMed] [Google Scholar]
- 20.Chetan MR, Gleeson FV. Radiomics in predicting treatment response in non-small-cell lung cancer: current status, challenges and future perspectives. Eur Radiol. 2021;31(2):1049-1058. doi: 10.1007/s00330-020-07141-9 [DOI] [PMC free article] [PubMed] [Google Scholar]
- 21.Yan M, Wang W. Radiomic analysis of CT predicts tumor response in human lung cancer with radiotherapy. J Digit Imaging. 2020;33(6):1401-1403. doi: 10.1007/s10278-020-00385-3 [DOI] [PMC free article] [PubMed] [Google Scholar]
- 22.Krafft SP, Rao A, Stingo F, et al. The utility of quantitative CT radiomics features for improved prediction of radiation pneumonitis. Med Phys. 2018;45(11):5317-5324. doi: 10.1002/mp.13150 [DOI] [PubMed] [Google Scholar]
- 23.Von Elm E, Altman DG, Egger M, et al. The strengthening the reporting of observational studies in epidemiology (STROBE) statement: guidelines for reporting observational studies. Ann Intern Med. 2007;147(8):573-577. doi: 10.7326/0003-4819-147-8-200710160-00010 [DOI] [PubMed] [Google Scholar]
- 24.Yushkevich PA, Piven J, Hazlett HC, et al. User-guided 3D active contour segmentation of anatomical structures: significantly improved efficiency and reliability. Neuroimage. 2006;31(3):1116-1128. doi: 10.1016/j.neuroimage.2006.01.015 [DOI] [PubMed] [Google Scholar]
- 25.Li H, Zhu M, Jian L, et al. Radiomic score as a potential imaging biomarker for predicting survival in patients with cervical cancer. Front Oncol. 2021;11:706043. doi: 10.3389/fonc.2021.706043 [DOI] [PMC free article] [PubMed] [Google Scholar]
- 26.Haga A, Takahashi W, Aoki S, et al. Standardization of imaging features for radiomics analysis. J Med Invest. 2019;66(1):35-37. doi: 10.2152/jmi.66.35 [DOI] [PubMed] [Google Scholar]
- 27.Song Y, Zhang J, Zhang YD, et al. Feature explorer (FAE): a tool for developing and comparing radiomics models. PLoS One. 2020;15(8):e0237587. doi: 10.1371/journal.pone.0237587 [DOI] [PMC free article] [PubMed] [Google Scholar]
- 28.Zhou ZR, Wang WW, Li Y, et al. In-depth mining of clinical data: The construction of clinical prediction model with R. Ann Transl Med. 2019;7(23):796. doi: 10.21037/atm.2019.08.63 [DOI] [PMC free article] [PubMed] [Google Scholar]
- 29.Altorki NK, McGraw TE, Borczuk AC, et al. Neoadjuvant durvalumab with or without stereotactic body radiotherapy in patients with early-stage non-small-cell lung cancer: a single-centre, randomised phase 2 trial. Lancet Oncol. 2021;22(6):824-835. doi: 10.1016/S1470-2045(21)00149-2 [DOI] [PubMed] [Google Scholar]
- 30.Sindoni A, Minutoli F, Ascenti G, Pergolizzi S. Combination of immune checkpoint inhibitors and radiotherapy: review of the literature. Crit Rev Oncol Hematol. 2017;113:63-70. doi: 10.1016/j.critrevonc.2017.03.003 [DOI] [PubMed] [Google Scholar]
- 31.Pitroda SP, Chmura SJ, Weichselbaum RR. Integration of radiotherapy and immunotherapy for treatment of oligometastases. Lancet Oncol. 2019;20(8):e434-e442. doi: 10.1016/S1470-2045(19)30157-3 [DOI] [PubMed] [Google Scholar]
- 32.Arrieta O, Ramírez-Tirado LA, Caballé-Perez E, et al. Response rate of patients with baseline brain metastases from recently diagnosed non–small cell lung cancer receiving radiotherapy according to EGFR, ALK and KRAS mutation status. Thorac Cancer. 2020;11(4):1026-1037. doi: 10.1111/1759-7714.13359 [DOI] [PMC free article] [PubMed] [Google Scholar]
- 33.Cassidy RJ, Zhang X, Patel PR, et al. Next-generation sequencing and clinical outcomes of patients with lung adenocarcinoma treated with stereotactic body radiotherapy. Cancer. 2017;123(19):3681-3690. doi: 10.1002/cncr.30794 [DOI] [PubMed] [Google Scholar]
- 34.Wang X, Bai YF, Zeng M. First-line tyrosine kinase inhibitor with or without aggressive upfront local radiation therapy in patients with EGFRm oligometastatic non-small-cell lung cancer: interim results of a randomized phase III, open-label clinical trial (SINDAS) (NCT02893332). Int J Radiat Oncol Biol Phys. 2020;108(3):e81. doi: 10.1016/j.ijrobp.2020.07.1169 [DOI] [Google Scholar]
- 35.Magnuson WJ, Lester-Coll NH, Wu AJ, et al. Management of brain metastases in tyrosine kinase inhibitor-naïve epidermal growth factor receptor–mutant non–small-cell lung cancer: a retrospective multi-institutional analysis. J Clin Oncol. 2017;35(10):1070-1077. doi: 10.1200/JCO.2016.69.7144 [DOI] [PubMed] [Google Scholar]
- 36.Ardizzoni A, Tiseo M, Boni L, et al. Randomized phase III PITCAP trial and meta-analysis of induction chemotherapy followed by thoracic irradiation with or without concurrent taxane-based chemotherapy in locally advanced NSCLC. Lung Cancer. 2016;100:30-37. doi: 10.1016/j.lungcan.2016.07.026 [DOI] [PubMed] [Google Scholar]
- 37.Wang Z, Zhan P, Lv Y, et al. Prognostic role of pretreatment neutrophil-to-lymphocyte ratio in non-small cell lung cancer patients treated with systemic therapy: a meta-analysis. Transl Lung Cancer Res. 2019;8(3):214-226. doi: 10.21037/tlcr.2019.06.10 [DOI] [PMC free article] [PubMed] [Google Scholar]
- 38.Sebastian N, Wu T, Bazan J, et al. Pre-treatment neutrophil–lymphocyte ratio is associated with overall mortality in localized non-small cell lung cancer treated with stereotactic body radiotherapy. Radiother Oncol. 2019;134:151-157. doi: 10.1016/j.radonc.2019.01.032 [DOI] [PMC free article] [PubMed] [Google Scholar]
- 39.Falanga A, Russo L, Milesi V. The coagulopathy of cancer. Curr Opin Hematol. 2014;21(5):423-429. doi: 10.1097/MOH.0000000000000072 [DOI] [PubMed] [Google Scholar]
- 40.Gay LJ, Felding-Habermann B. Contribution of platelets to tumour metastasis. Nat Rev Cancer. 2011;11(2):123-134. doi: 10.1038/nrc3004 [DOI] [PMC free article] [PubMed] [Google Scholar]
- 41.Schlesinger M. Role of platelets and platelet receptors in cancer metastasis. J Hematol Oncol. 2018;11(1):125. doi: 10.1186/s13045-018-0669-2 [DOI] [PMC free article] [PubMed] [Google Scholar]
Associated Data
This section collects any data citations, data availability statements, or supplementary materials included in this article.
Supplementary Materials
Supplemental material, sj-docx-1-tct-10.1177_15330338221142400 for Combined Radiomics–Clinical Model to Predict Radiotherapy Response in Inoperable Stage III and IV Non-Small-Cell Lung Cancer by Wenrui Chen, Li Wang, Yu Hou, Lan Li, Li Chang, Yunfen Li, Kun Xie, Linbo Qiu, Dan Mao, Wenhui Li and Yaoxiong Xia in Technology in Cancer Research & Treatment
Supplemental material, sj-docx-3-tct-10.1177_15330338221142400 for Combined Radiomics–Clinical Model to Predict Radiotherapy Response in Inoperable Stage III and IV Non-Small-Cell Lung Cancer by Wenrui Chen, Li Wang, Yu Hou, Lan Li, Li Chang, Yunfen Li, Kun Xie, Linbo Qiu, Dan Mao, Wenhui Li and Yaoxiong Xia in Technology in Cancer Research & Treatment
Supplemental material, sj-docx-4-tct-10.1177_15330338221142400 for Combined Radiomics–Clinical Model to Predict Radiotherapy Response in Inoperable Stage III and IV Non-Small-Cell Lung Cancer by Wenrui Chen, Li Wang, Yu Hou, Lan Li, Li Chang, Yunfen Li, Kun Xie, Linbo Qiu, Dan Mao, Wenhui Li and Yaoxiong Xia in Technology in Cancer Research & Treatment


