Abstract
Objective:
Computer vision syndromes are becoming a major public health concern. Inconsistent findings existed on computer vision syndrome. This systematic review and meta-analysis aimed to estimate the pooled prevalence of computer vision syndrome and identify its determinants.
Methods:
In this study, the review was developed using the Preferred Reporting Items for Systematic Reviews and Meta-Analyses guidelines. Online electronic databases, including PubMed/Medline, CINAHL, and Google Scholar, were used to retrieve studies from 1 December to 9 April 2022. Quality assessment of the studies was performed using the JBI-MAStARI. RevMan and STATA 14 software were used for statistical analysis.
Result:
A total of 725 studies were retrieved, and 49 studies were included. The pooled prevalence of computer vision syndrome was 66% (95%, Confidence interval: 59, 74). Being female (Odd Ratio = 1.74, 95% Confidence interval [1.2, 2.53]), improper body posturing while using electronic devices (Odd Ratio = 2.65, 95% Confidence interval [1.7, 4.12]), use of electronic devices out of work (Odd Ratio = 1.66, 95% CI [1.15, 2.39]), no habit of taking breaks (Odd Ratio = 2.24, 95% Confidence interval [1.13, 4.44]), long duration of visual display terminal use (Odd Ratio = 2.02, 95% Confidence interval [1.08, 3.77]), short distance screen (Odd Ratio = 4.24, 95% Confidence interval [2.33, 7.71]), and general ergonomic practice (Odd Ratio = 3.87, 95% Confidence interval [2.18, 6.86]) were associated with increased odds of computer vision syndrome. However, good knowledge (Odd Ratio = 4.04, 95% Confidence interval [2.75, 5.94]) of computer vision syndrome was associated with decreased odds of computer vision syndrome.
Conclusion:
Nearly two in three participants had computer vision syndrome. Being female, improper body posturing, use of electronics devices out of work, no habit of taking a break, long-hour duration of visual display terminal use, short-distance screen, and general ergonomic practice were associated with increased odds of computer vision syndrome.
Keywords: Pooled prevalence, determinants, computer vision syndrome, systematic review, meta-analysis
Introduction
Computer vision syndrome (CVS) is defined as “a complex of eye and vision problems related to near work experienced during computer use.”1 Visual fatigue (VF) and digital eye strain (DES) terms are also used for CVS, reflecting the different digital devices related to potential problems.2 Symptoms related to CVS can be classified as visual, ocular, and extraocular.3 Visual symptoms include blurred vision, VF or discomfort, and diplopia.4–7 Ocular symptoms include dry eye disease, redness, eye strain, and irritation.1,8,9 Extraocular symptoms include headache and shoulder, neck, and back pain.3,4,10–14
Individuals spend more time on electronic devices such as computers, laptops, smartphones, tablets, and e-readers, which contribute to CVS.15 Children are also affected in CVS, as they spend many hours using electronic devices for schoolwork, playing video games, and sending and receiving text messages.15 However, the use of these devices even for 3 h/day can lead to the development of CVS, back pain, headaches, and stress.3
The massive growth of digital devices has become an integral part of daily life, and millions of individuals of all ages are at risk of CVS.16–18 In developed nations, engagement with digital devices has increased substantially in recent years across all age groups.19–21 Moreover, the burden of CVS is very high in developing countries due to low accessibility, and utilization of personal protective equipment, and limited break time while using electronic devices.22 CVS is a major public health problem leading to occupational hazard, an increased error rate, impaired visual abilities, reduced productivity, and job satisfaction.23,24
A review of the literature showed that factors associated with CVS can be classified as personal factors, which include poor sitting position, inappropriate eye-to-screen distance, insufficient working procedures, improper viewing angle and short distances, presences of medical diseases, and long duration of computer usage. The environment and computer factors such as improper workstation, poor lighting, contrast, and resolution, slow refresh rate, increase glare of the display, excessive screen brightness, imbalance of light between the computer screen and surrounding working room.5,10,25–28
Modern digital technology markedly influences the daily activities and lifestyles of people.4,7 CVS can reduce productivity and causes visual and musculoskeletal impairment and impact on circadian rhythms and sleep patterns disturbance.4,7,13,29,30 Although CVS is becoming a major public health problem, less emphasis is given, particularly in developing countries. There are studies on different continents on CVS, but inconsistent findings. Therefore, this systematic review aimed to estimate the pooled prevalence and identify the determinants of CVS.
Methods
Protocol and registration
This systematic review and meta-analysis of CVS was registered with the international prospective register and systematic reviews PROSPERO with registration number CRD42022325167. Available at: https://www.crd.york.ac.uk/prospero/#myprospero
Search strategies
The systematic review was developed using the Preferred Reporting Items for Systematic Reviews and Meta-Analyses (PRISMA) guidelines,31 and the review procedure was reported using the (PRISMA-2009-Checklist).32 Published and unpublished studies were searched in databases such as Medline/PubMed, CINAHL, and Google Scholar from 1 December to 9 April 2022. The MeSH terms and entry terms were used to search studies from databases, and modifications were made based on the type of databases (Additional file 1). In addition, cross-references of the included articles were performed.
Eligibility criteria
Inclusion criteria
❖ To include studies in the systematic review and meta-analysis, the following criteria were considered:
Study area
Worldwide studies
Study scope
Studies that report the prevalence of CVS and the associated factors
Studies that only report the overall prevalence of CVS
Both community- and facility-based studies
Quantitative results of qualitative studies
Study design
All observational study designs, including cross-sectional, case–control, and cohort study designs.
Language
Studies in English
Population
General population
Publication year
“No restriction on the date of publication.”
Exclusion criteria
❖ Studies were excluded if they had the following issues:
Studies other than English
Studies that did not report specific outcomes for CVS
Studies with no full-text article following email contact with corresponding authors
Qualitative results
Letters, reviews, case reports, and conference abstracts
CoCoPop/PEO
Condition: CVS
Context: global
Population: general population
Exposure: Exposure is a determinant that increases or decreases the likelihood of CVS. The determinants can be but are not limited to sex, age, sitting in a bent back position, increased screen hours, longer duration of study, preexisting medical cases, daily computer usage, excessive blinking, and light sensitivity.
Outcome/context: The primary outcome of the study was the pooled prevalence of CVS. The prevalence of CVS was considered when the studies reported the prevalence of CVS for either syndrome (blurred vision, eye strain/fatigue, discomfort, diplopia, dry eye disease, redness, irritation, headache, shoulder, neck, and back pain) in the primary studies. The secondary outcome of the study was to identify determinants of CVS for either of the syndromes in the primary studies. The criteria for selecting factors affecting CVS were considered how consistently and frequently they were reported in the primary studies. Accordingly, factors reported in more than one study and having consistent classification were included.
Study selection
Endnote reference manager software33 was used to organize, remove duplicate, irrelevant titles, and abstracts. Duplicate, irrelevant titles and abstracts studies were removed. A full-text review of studies was performed before the inclusion of studies in the final meta-analysis. Study selection was performed independently by the reviewers (EW and AK). The selection procedures of the studies were presented using a PRISMA diagram.
Quality assessment
“The Joanna Briggs Institute Meta-Analysis of Statistics Assessment and Review Instrument (JBI-MAStARI)”34 was used to critically assess the quality of the studies. The elements of quality appraisal include having clear inclusion criteria, study setting and participants’ description, outcome and explanatory variable measurements, measurement criteria used, and valid statistical analysis. Independent quality appraisal of the studies was reviewed by (EW and AK), and 50% and above of the quality score was included in the final systematic review and meta-analysis. Any disagreement during critical appraisal among reviewers was resolved with the discussion.
Data extraction
Independent data extraction was performed by the authors (EW and AK) using a pilot tested data extraction Microsoft Office Excel sheet and RevMan software. The data extraction sheet elements included publication year, authors’ names, country, study design, and sample size. Any discrepancy was resolved by discussion between the authors. In the case of unclear or incomplete data, contact with the corresponding authors of the studies was made, and the study was excluded if there was no response.
Statistical analysis
The data analysis was performed using RevMan and STATA 14 software. The event and control data of the primary studies were extracted to RevMan software. A narrative description and summary of the included studies are described in tables and graphs. As the assumption of a true effect varies from study to study, a random-effects model meta-analysis35 was used to estimate the pooled prevalence and identify the determinants of CVS. The results were presented using a forest plot with 95% confidence intervals.
The heterogeneity of studies was assessed by the I2 statistic.36 I2 statistics of 25, 50 and 75% indicated low, moderate, and substantial heterogeneity, respectively, with p < 0.05. The I2 statistic estimates the percentage of total variations among studies due to actual differences rather than chance. Publication bias was assessed using visual inspection of the funnel plot for more than 10 studies37 and Egger’s test at p < 0.05.38
Results
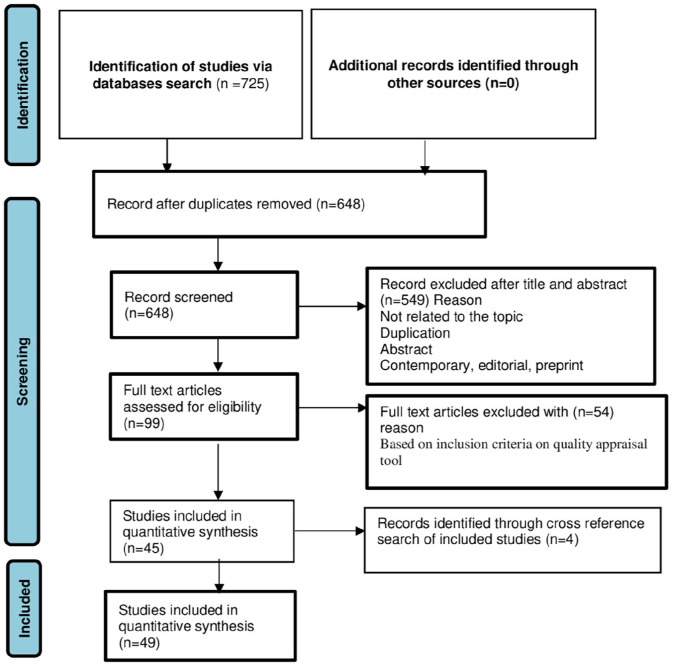
A total of 725 articles were retrieved using electronic database searches: PubMed, Google Scholar, and CINHAL. Seventy-seven articles were excluded due to duplication, and 549 articles were excluded because they were not related to the title, review, abstract or duplication. Ninety-nine full text articles were assessed for eligibility, and 54 articles were excluded based on the inclusion criteria of the quality appraisal tool. Four article records were identified through a cross-referencing search of the included studies. Finally, 49 articles were included in the systematic review and meta-analysis (Figure 1).
Figure 1.
Flow chart explaining the selection of primary studies.
Characteristics of included studies
A total of 45 cross-sectional and 4 case control studies were included in this systematic review and meta-analysis: four studies in Saudi Arabia,39–42 four studies in Pakistan,43–46 three studies in Spain,47–49 three studies in Ghana,50–52 seven studies in Ethiopia,53–58 five studies in Egypt,11,59–62 two studies in Nigeria,63,64 one study in Jordan,65 two studies in China,66,67 one study in Iran,68 one study in Nepal,69 eight studies in India,18,70–76 one study in South Korea,77 one study in Seri Lanka,78 one study in Italy,29 two studies in Brazil,79,80 one study in Beirut,81 one study in Japan,82 and one study in Thailand.83 A total of 23,399 sample sizes were included. The sample size ranged from 74 in China67 to 4030 in Egypt11 (Table 1).
Table 1.
Summary characteristics of studies included in the meta-analysis of CVS and its determinants, 2022.
| Author/s/reference | Country | Study design | Sample size | Response rate (%) | Prevalence (%) | Study subjects |
|---|---|---|---|---|---|---|
| Abudawood et al.39 | Saudi Arabia | Cross-sectional | 587 | 100 | 95.1 | Students |
| Agbonlahor et al.64 | Nigeria | Cross-sectional | 215 | 84 | 65.1 | Government employ |
| Akowuah et al.84 | Ghana | Cross-sectional | 362 | 92.5 | 64.4 | Students |
| Al Dandan et al.41 | Saudi Arabia | Cross-sectional | 198 | 75.3 | 50.5 | Radiologists |
| Al Subaie et al.42 | Saudi Arabia | Cross-sectional | 416 | 100 | 43.5 | Population ⩾15 years |
| Arshad et al.85 | Pakistan | Cross-sectional | 320 | 100 | 58.1 | Students |
| Artime-Ríos et al.47 | Spain | Cross-sectional | 622 | - | 56.7 | Health workers |
| Boadi-Kusi et al.51 | Ghana | Cross-sectional | 139 | 86.9 | 71.2 | Bank workers |
| Boadi-Kusi et al.50 | Ghana | Cross-sectional | 200 | 65 | 51.5 | University staff |
| Cantó-Sancho et al.48 | Spain | Cross-sectional | 244 | 100 | 76.6 | Students |
| Derbew et al.53 | Ethiopia | Cross-sectional | 351 | 98 | 74.6 | Bank workers |
| Dessie et al.54 | Ethiopia | Cross-sectional | 607 | 93.1 | 69.5 | Government employ |
| Gammoh et al.65 | Jordan | Cross-sectional | 382 | 92 | 94.5 | Students |
| Gondol et al.55 | Ethiopia | Cross-sectional | 272 | 100 | 81.3 | Government employ |
| Han et al.66 | China | Cross sectional | 1469 | 97.9 | 57.04 | Students |
| Hashemi et al.68 | Iran | Cross-sectional | 1040 | 97.2 | 49.4 | Students |
| Kamal et al.59 | Egypt | Cross-sectional | 218 | 96.3 | 84.8 | Bank workers |
| Lakachew Assefa et al.16 | Ethiopia | Cross-sectional | 304 | 98.2 | 73.03 | Bank workers |
| Lemma et al.56 | Ethiopia | Cross-sectional | 455 | 93 | 68.8 | Secretaries |
| Lemma et al.57 | Ethiopia | Cross-sectional | 217 | 96.8 | 75.6 | Secretaries |
| Logaraj et al.72 | India | Cross-sectional | 215 | 100 | 81.8 | Students |
| Mansoori et al.43 | Pakistan | Cross-sectional | 150 | 100 | 28 | Students |
| Mohan et al.86 | India | Cross-sectional | 217 | 83.14 | 50.2 | Children |
| Nagwa et al.60 | Egypt | Cross-sectional | 260 | 100 | 75 | Students |
| Noreen et al.46 | Pakistan | Cross-sectional | 326 | 95.04 | 98.7 | Students |
| Noreen et al.45 | Pakistan | Cross-sectional | 198 | 86.5 | 67.2 | Students |
| Nwankwo et al.63 | Nigeria | Cross-sectional | 153 | 100 | 54.2 | Students |
| Poudel et al.69 | Nepal | Cross-sectional | 263 | 94.9 | 82.5 | IT office workers |
| Rafeeq et al.74 | India | Cross-sectional | 120 | 100 | 69.2 | ⩾12 years old population |
| Ranasinghe et al.78 | Serilanka | Cross-sectional | 2210 | 88.4 | 67.4 | Computer office workers |
| Ranganatha et al.71 | India | Cross-sectional | 150 | 100 | 86.7 | Computer sciences students |
| Rathore et al.75 | India | Cross-sectional | 150 | 100 | 75.3 | Computer users |
| Sa et al.79 | Brazil | Cross-sectional | 476 | 89.6 | 54.6 | Call center |
| Sánchez-Brau et al.49 | Spain | Cross-sectional | 109 | 95.6 | 74.3 | Visual display workers |
| Sawaya et al.81 | Beirut | Cross-sectional | 457 | 73.5 | 67.8 | Students |
| Singh et al.18 | India | Cross-sectional | 192 | 96 | 51.6 | Students |
| Tiwari et al.70 | India | Cross-sectional | 432 | 100 | 32.2 | Children |
| Uchino et al.82 | Japan | Cross-sectional | 561 | 83.5 | 11.6 | Visual display terminal users |
| Verma et al.76 | India | Cross-sectional | 100 | 100 | 74 | Computer operators |
| Vilela et al.80 | Brazil | Cross-sectional | 964 | 100 | 24.7 | School children |
| Wang et al.67 | China | Cross-sectional | 74 | 80.12 | 74.3 | Students |
| Wangsan et al.83 | Thailand | Cross-sectional | 527 | 100 | 81.02 | Students |
| Zalat et al.40 | Saudi Arabia | Cross-sectional | 80 | 100 | 81.3 | Visual display workers |
| Zayed et al.61 | Egypt | Cross-sectional | 108 | 98.18 | 82.4 | IT professionals |
| Zenbaba et al.58 | Ethiopia | Cross-sectional | 416 | 98.6 | 70.43 | Students |
| Iqbal et al.62 | Egypt | Case control | 733 | 100 | – | Students |
| Iqbal et al.11 | Egypt | Case control | 4030 | 100 | – | Students |
| Moon et al.77 | South Korea | Case control | 916 | 100 | – | Children |
| Rossi et al.29 | Italy | Case control | 194 | 100 | – | Video-terminal (VDT) users |
Pooled prevalence of CVS
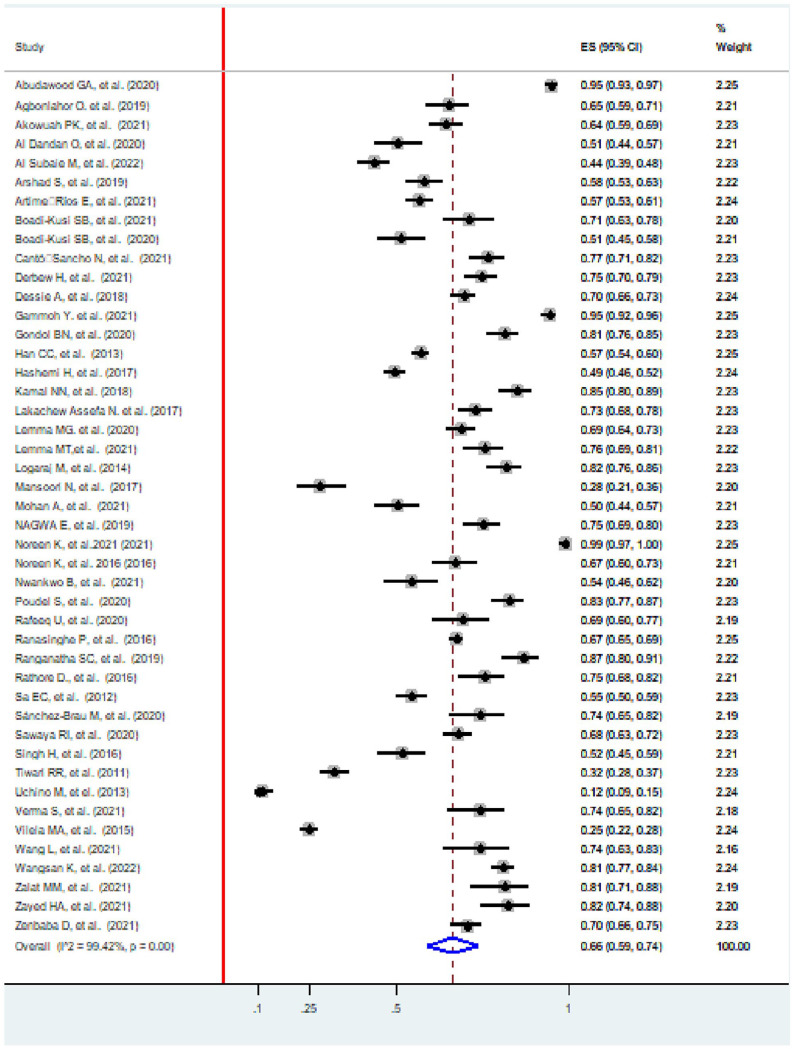
The pooled prevalence of CVS was 66% (95%, CI: 59, 74). The lowest proportion of included studies was 12% (95%, CI: 9, 15) in Japan,82 and the highest was 99% (95%, CI: 97, 100) in Pakistan.46 The I2 test showed that there was heterogeneity among the included studies (I2 = 99.42%, p value<0.001; Figure 2).
Figure 2.
Forest plot showing the pooled prevalence of CVS, 2022.
Subgroup analysis by country and level of development (developing/developed)
Subgroup analysis based on country showed that the prevalence of CVS was highest in Pakistan (97%, 95% CI: 96, 98) and lowest in Japan (12%, 95% CI: 9, 15). The studies that showed significant heterogeneity were studies in Saudi Arabia (I2 = 99.41%, p value <0.001), Ethiopia (I2 = 72.6%, p value <0.001), and India (I2 = 98.04%, p value <0.001). The subgroup analysis based on the level of development showed that the prevalence were 66% (58, 74), and 66% (59, 74) in developing and developed countries, respectively. High heterogeneity was observed in both developing (I2 = 99.45%, p value <0.001), and developed (I2 = 99.42%, p value <0.001) countries (Table 2).
Table 2.
Subgroup analysis by country on CVS, 2022.
| Sub group | Number of included studies | Prevalence (95% CI) | Heterogeneity statistics | |
|---|---|---|---|---|
| p value | I 2 | |||
| By country | ||||
| Saudi Arabia | 4 | 68 (37, 98) | p < 0.001 | 99.41% |
| Nigeria | 2 | 61 (56, 66) | p < 0.001 | 0.00% |
| Ghana | 3 | 62 (52, 73) | p < 0.001 | 0.00% |
| Pakistan | 2 | 62 (58, 66) | p < 0.001 | 0.00% |
| Spain | 3 | 69 (55, 83) | p < 0.001 | 0.00% |
| Ethiopia | 7 | 73 (70, 76) | p < 0.001 | 72.6% |
| Jordan | 1 | 95 (92, 96) | – | 0.00% |
| China | 2 | 58 (56, 61) | p < 0.001 | 0.00% |
| Iran | 1 | 49 (46, 52) | – | 0.00% |
| Egypt | 3 | 81 (74, 87) | p < 0.001 | 0.00% |
| India | 8 | 65 (49, 81) | p < 0.001 | 98.04% |
| Pakistan | 2 | 97 (96, 98) | p < 0.001 | 0.00% |
| Nepal | 1 | 83 (77, 87) | – | 0.00% |
| Seri Lanka | 1 | 67 (65, 69) | – | 0.00% |
| Brazil | 2 | 33 (30, 35) | p < 0.001 | 0.00% |
| Beirut | 1 | 68 (63, 72) | – | 0.00% |
| Thailand | 1 | 81 (77,84) | – | 0.00% |
| Japan | 1 | 12 (9, 15) | – | 0.00% |
| By level of development | ||||
| Developing | 43 | 66 (58, 74) | p < 0.001 | 99.45 |
| Developed | 2 | 66 (59, 74) | p < 0.001 | 99.42 |
Meta regression
Meta-regression was performed to identify the source of heterogeneity across the studies by country and sample size. Meta-regression indicated that heterogeneity was not associated with country or sample size (p value >0.05; Additional file 2, Supplemental Table S1).
Publication biases
Publication bias was checked using funnel plots, and visual inspection suggested asymmetry, as 11 studies were on the left side and 32 studies were on the right side (Additional file 3: Supplemental Figure S1). Moreover, publication bias was not shown on Egger’s test (p = 0.21; Additional file 4: Supplemental Table S2).
Determinants of CVS
In this study, sex, body posturing, use of electronics devices out of work, habit of taking breaks, visual display terminal (VDT) use in hours, distance from the screen, knowledge, and general ergonomic practice were factors associated with CVS.
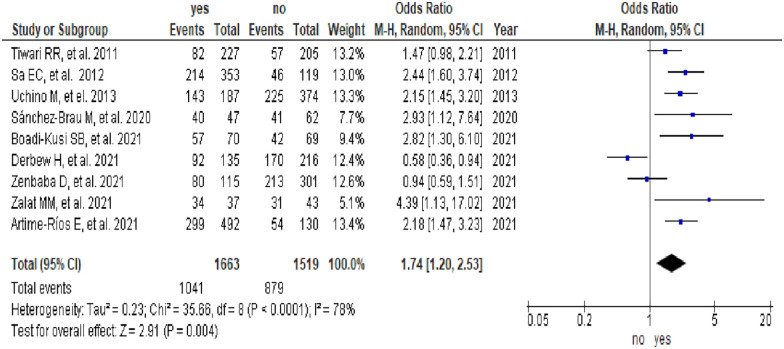
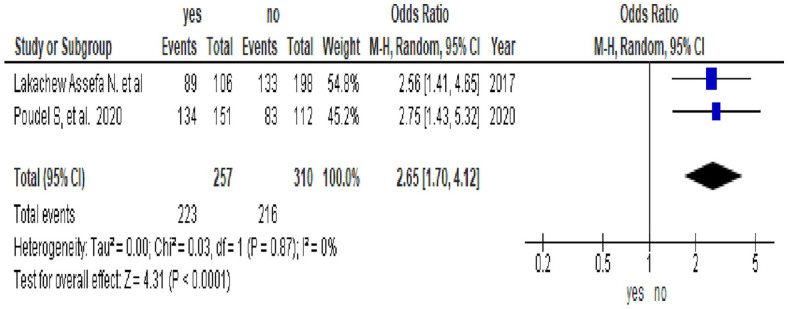
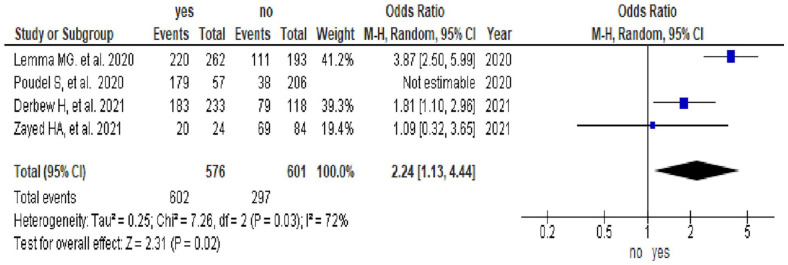
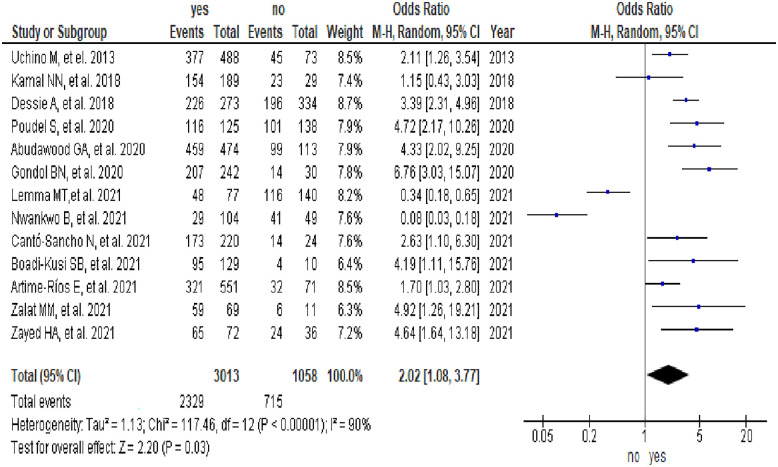
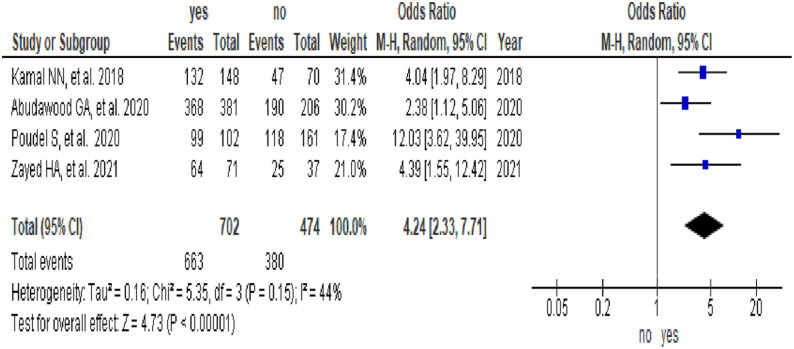
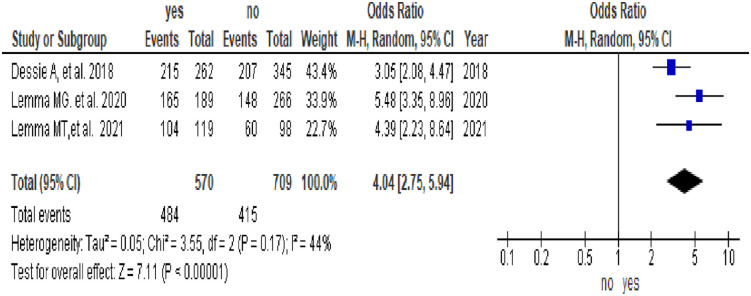
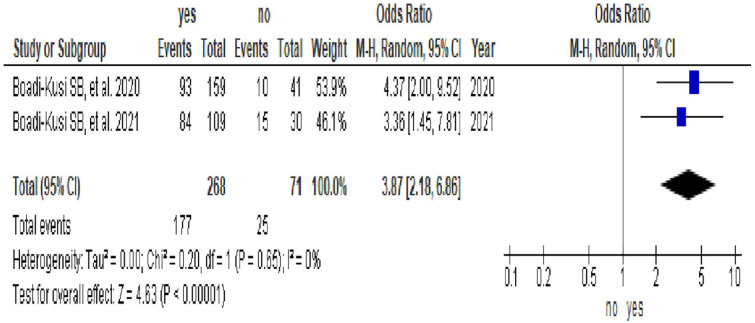
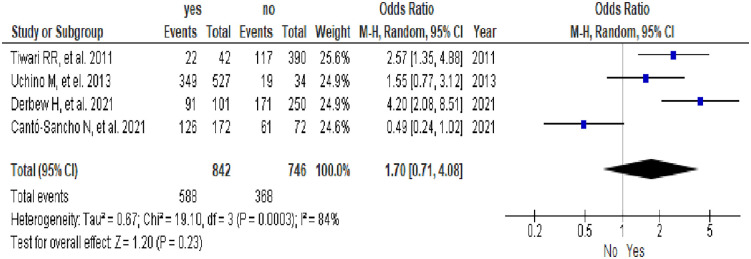
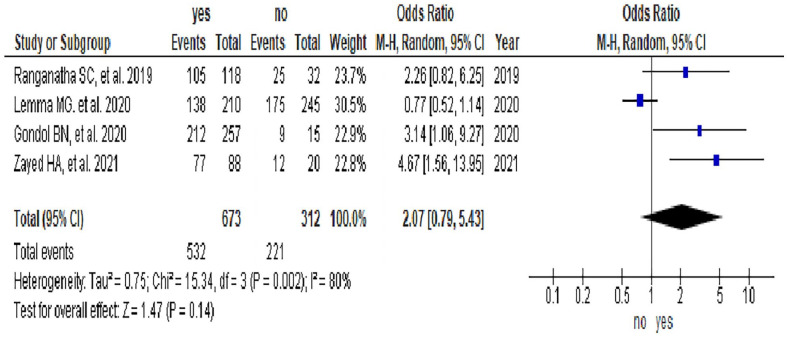
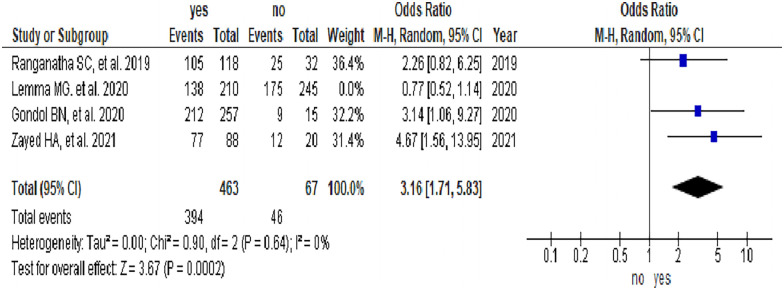
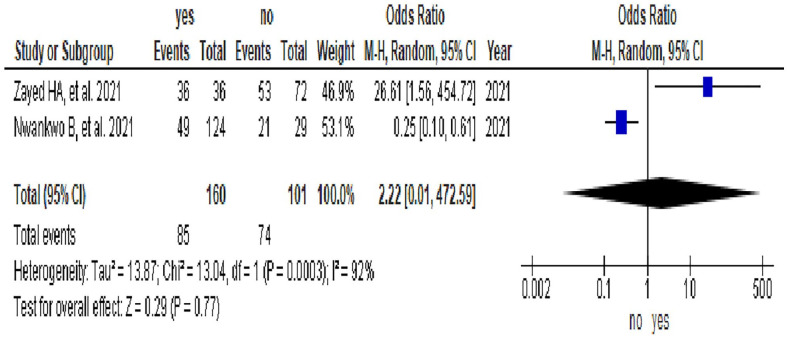
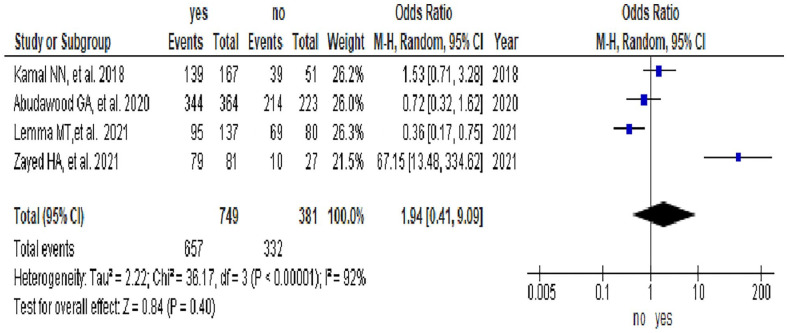
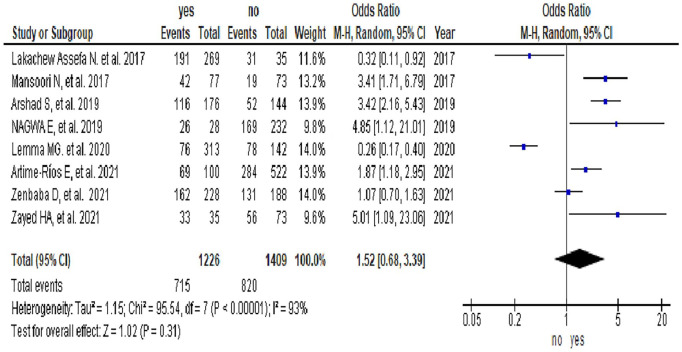
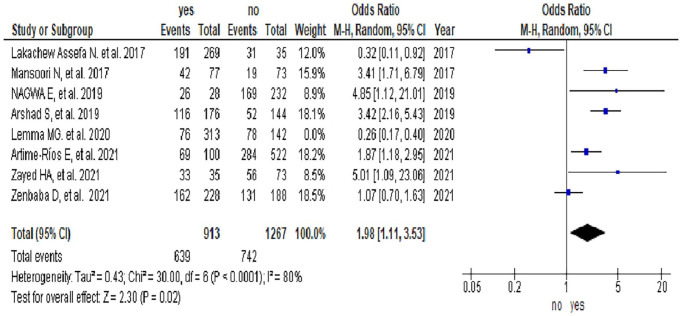
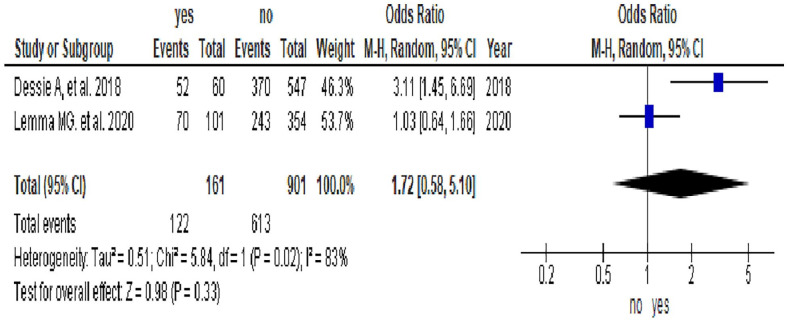
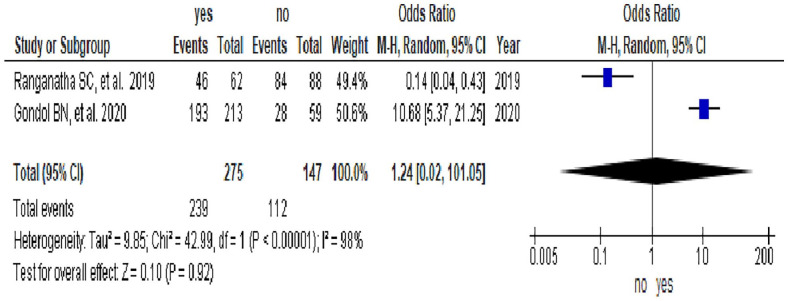
Nine studies1,40,47,49,51,53,58,70,79,82 indicated that sex was significantly associated with CVS. The odds of CVS among females were 74% higher than those among males (Odd Ratio (OR) = 1.74, 95% CI [1.2, 2.53]). There was considerable heterogeneity among the studies (I2 = 78%; Figure 3). Two studies16,69 indicated that body posturing was significantly associated with CVS. The odds of CVS among study subjects who had improper body posturing while using electronics devices were 2.65 times more likely than their counterparts (OR = 2.65, 95% CI [1.7, 4.12]). There was no heterogeneity among the studies (I2 = 0%; Figure 4). Two studies47,16 indicated that the use of electronics devices out of work was significantly associated with CVS. The odds of CVS among study subjects who used electronics devices out of work were 66% higher than those among study subjects who did not use electronics devices out of work (OR = 1.66, 95% CI [1.15, 2.39]). There was no considerable heterogeneity among the studies (I2 = 0%; Figure 5). Four studies53,56,61,69 indicated that a habit of taking breaks was significantly associated with CVS. The odds of CVS among study subjects who had no habit of taking breaks were 2.24 times higher than those of their counterparts (OR = 2.24, 95% CI [1.13, 4.44]). There was moderate heterogeneity among the studies (I2 = 72%; Figure 6). Thirteen studies39,40,47,48,51,54,55,57,59,61,63,69,82 indicated that a long duration of VDT use was significantly associated with CVS. The odds of CVS among study subjects who used a long duration of VDT were 2.02 times more likely than their counterparts (OR = 2.02, 95% CI [1.08, 3.77]). There was high heterogeneity among the studies (I2 = 90%; Figure 7). Four studies39,59,61,69 indicated that distance from the screen was significantly associated with CVS. The odds of CVS among study subjects who used short distance screen were 4.24 times more likely than study subjects who used long distance screen (OR = 4.24, 95% CI [2.33, 7.71]). There was low heterogeneity among the studies (I2 = 44%; Figure 8). Three studies54,56,57 indicated that knowledge was significantly associated with CVS. The odds of CVS among study subjects who had good knowledge of CVS were 4.04 times higher than those among study subjects who had poor knowledge (OR = 4.04, 95% CI [2.75, 5.94]). The heterogeneity test among the studies showed low heterogeneity (I2 = 44%; Figure 9). Two studies50,51 indicated that general ergonomic practice was significantly associated with CVS. The odds of CVS among study subjects who had general ergonomic practice were 3.87 times more likely than their counterparts (OR = 3.87, 95% CI [2.18, 6.86]). There was no heterogeneity among the studies (I2 = 0%; Figure 10). In this study, insignificant variables were age, income, adjustment of computer screen, VDT use in year, and brightness in Figures 11 to 14, Figure 15 and 16, respectively. In this study, although the use of the antiglare filter was statistically insignificant (Figure 14), removing Lemma et al.56 study using sensitivity analysis showed statistical significance (p values <0.05). There was no heterogeneity among the studies (I2 = 0%; Figure 17). Although the optical lens or eye glass wear was statistically insignificant (Figure 18), excluding Lemma et al.56 study using sensitivity analysis showed statistical significance (p values <0.05; Figure 19), and there was considerable heterogeneity among the studies (I2 = 80%).
Figure 3.
Forest plot showing the association between sex and CVS.
Figure 4.
Forest plot showing the association between body posturing and CVS.
Figure 5.
Forest plot showing the association between the use of electronics devices out of work and CVS.
Figure 6.
Forest plot showing the association between a habit of taking breaks and CVS.
Figure 7.
Forest plot showing the association between VDT use in hours and CVS.
Figure 8.
Forest plot showing the association between distance from the screen and CVS.
Figure 9.
Forest plot showing the association between knowledge and CVS.
Figure 10.
Forest plot showing the association between general ergonomic practice and CVS.
Figure 11.
Forest plot showing the association between age and CVS.
Figure 14.
Forest plot showing the association between the use of the antiglare fitter and CVS.
Figure 15.
Forest plot showing the association between VDT use in years and CVS.
Figure 16.
Forest plot showing the association between brightness and CVS.
Figure 17.
Forest plot showing the association between the use of an antiglare filter and CVS according to Lemma et al.56 study removed using sensitivity analysis.
Figure 18.
Forest plot showing the association between optical lens or eye glass wear and CVS by excluding Lemma et al.56 study using Sensitivity analysis.
Figure 19.
Forest plot showing the association between optical lens or eye glass wear and CVS when Lemma et al.56 study was excluded using sensitivity analysis.
Figure 12.
Forest plot showing the association between income and CVS.
Figure 13.
Forest plot showing the association between adjustment for computer screen and CVS.
Discussion
This systematic review and meta-analysis aimed to assess the pooled prevalence of CVS and its determinants. There are inconsistent findings on the prevalence of CVS and its determinants. Moreover, there are no systematic review and meta-analysis research findings on the pooled prevalence of CVS and its determinants. Therefore, the findings from this systematic review and meta-analysis will help policy-makers design appropriate strategies to reduce CVS public health concerns.
In this study, a wide range of differences was reported CVS prevalence among the world from 12% to 99%. This might be due to the accuracy of the diagnostic tools used to document the CVS prevalence. Most articles used only subjective questionnaires whether via direct or on line surveys but no one has pointed to the criteria of CVS diagnosis. This important issue had been revealed by.11,62 Surveys might overestimate the real CVS prevalence as most surveys depends only on the presence of one or more CVS complains to diagnose CVS without linking these complaints to the time of screen-use and the long-term frequency of these complaints for months.11,62 Moreover, the difference might be due to the way how people use screens mainly the smartphone or screen misuse including improper lightening, uncomfortable seating postures, close eye-screen distance, improper visualization gaze, uncorrected refractive errors, prolonged continues screen-hours, lack of breaks, watching screen in the dark, poor screen design with glare, old smartphone versions, small font sizes, texting with both thumbs, screen-habits, and other misuse factors.
The pooled prevalence of CVS was 66% (95%, CI: 59, 73). The pooled prevalence was in line with the study done in India COVID-19 pre-lockdown, 64.3%.84 However, the pooled prevalence was lower than that in studies performed in India during the COVID-19 lockdown, 87.3%,84 Europe, 90%,85 and Ethiopia, 73.21%.86 The difference might be due to differences in study period, study setting, socioeconomic differences, awareness and behavioral change on prevention of CVS.
In this study, the odds of CVS among females were 74% higher than those among males (OR = 1.74, 95% CI [1.2, 2.53]). These findings were in line with studies29,87. However, CVS was reported more often in males than in females.72
The odds of CVS among study subjects who had improper body posturing while using electronics devices were 2.65 times more likely than their counterparts (OR = 2.65, 95% CI [1.7, 4.12]). These findings were in line with studies.26,84–86,88–90 This might be because individuals who practice inappropriate positioning suffer from computer vision syndrome.91,92 Moreover, an upwards or downwards view to see the computer leads to a higher risk of developing CVS.93
The odds of CVS among study subjects who used electronics devices out of work were 66% higher than those among study subjects who did not use electronics devices out of work (OR = 1.66, 95% CI [1.15, 2.39]). These findings were in line with studies.26,94 This might be because technological advances and electronic devices have become common tools used for different purposes on a daily basis, and CVS is a growing public health concern.95
The odds of CVS among study subjects who had no habit of taking breaks were 2.24 times more likely than their counterparts (OR = 2.24, 95% CI [1.13, 4.44]). These findings were in line with studies.86,94 This might be because not taking frequent breaks and blinking during computer use were associated with a higher risk of developing CVS.93,96
The odds of CVS among study subjects who used a long duration of VDT were 2.02 times more likely than their counterparts (OR = 2.02, 95% CI [1.08, 3.77]). These findings were in line with studies.5,84,85,90,94,97 This might be the fact that computer-related health problems such as CVS and musculoskeletal disorders occur among prolonged computer users.98,99
The odds of CVS among study subjects who used short distance screen were 4.24 times more likely than study subjects who used long distance screen (OR = 4.24, 95% CI [2.33, 7.71]). These findings were in line with studies.26,85,88,89 This might be because viewing a computer at a short distance of less than 20 inches leads to a higher risk of developing CVS.93
The odds of CVS among study subjects who had poor knowledge of CVS were 4.04 times higher than those among study subjects who had good knowledge (OR = 4.04, 95% CI [2.75, 5.94]). These findings were in line with a previous study.90 This might be due to preexisting knowledge of CVS being at high risk for CVS.96
The odds of CVS among study subjects who had general ergonomic practice were 3.87 times more likely than their counterparts (OR = 3.87, 95% CI [2.18, 6.86]). These findings were in line with studies.84,85,88–90,97,100 This might be due to inappropriate positioning; exposure to the prolonged awkward posture of the trunk or torso, shoulder-upper arm, forearm-elbows, and wrist leads to extraocular CVS91,92. Moreover, not using an adjustable chair, height, and keyboards is associated with a higher risk of developing musculoskeletal disorders.93 The limitations include heterogeneity, articles published only in English, and cause–effect relationships, as the studies were cross-sectional and case–control studies. Moreover, this study was reported from 20 countries, which might lack representativeness. Despite this limitation, an extensive search and two reviewers were involved to reduce the possible risks of bias.
Conclusion
Nearly two in three participants had CVS. Being female, improper body posturing while using electronic devices, use of electronics devices out of work, no habit of taking breaks, long duration of VDT use, short distance screen, and general ergonomic practice were associated with increased odds of CVS. However, good knowledge of CVS was associated with decreased odds of CVS. Thus, preventive practice strategic activities on CVS are important interventions.
Supplemental Material
Supplemental material, sj-docx-1-smo-10.1177_20503121221142402 for Computer vision syndrome and its determinants: A systematic review and meta-analysis by Asamene Kelelom Lema and Etsay Woldu Anbesu in SAGE Open Medicine
Supplemental material, sj-docx-2-smo-10.1177_20503121221142402 for Computer vision syndrome and its determinants: A systematic review and meta-analysis by Asamene Kelelom Lema and Etsay Woldu Anbesu in SAGE Open Medicine
Supplemental material, sj-docx-4-smo-10.1177_20503121221142402 for Computer vision syndrome and its determinants: A systematic review and meta-analysis by Asamene Kelelom Lema and Etsay Woldu Anbesu in SAGE Open Medicine
Supplemental material, sj-tiff-3-smo-10.1177_20503121221142402 for Computer vision syndrome and its determinants: A systematic review and meta-analysis by Asamene Kelelom Lema and Etsay Woldu Anbesu in SAGE Open Medicine
Acknowledgments
We would like to thank Samara University for the HINARY database website and network access.
Footnotes
The author(s) declared no potential conflicts of interest with respect to the research, authorship, and/or publication of this article.
Funding: The author(s) received no financial support for the research, authorship, and/or publication of this article.
ORCID iD: Etsay Woldu Anbesu  https://orcid.org/0000-0002-4532-6720
Supplemental material: Supplemental material for this article is available online.
References
- 1. Association AO. The effects of computer use on eye health and vision. St. Louis, MO: American Optometric Association, 1997. [Google Scholar]
- 2. Rosenfield M. Computer vision syndrome (aka digital eye strain). Optom Pract 2016; 17(1): 1–10. [Google Scholar]
- 3. Association AO. Guide to the clinical aspects of computer vision syndrome. St. Louis, MO: American Optometric Association, 1995. [Google Scholar]
- 4. Ahmed SF, McDermott KC, Burge WK, et al. Visual function, digital behavior and the vision performance index. Clin Ophthalmol 2018; 12: 2553. [DOI] [PMC free article] [PubMed] [Google Scholar]
- 5. Klamm J, Tarnow KG. Computer vision syndrome: a review of literature. Medsurg Nurs 2015; 24(2): 89. [PubMed] [Google Scholar]
- 6. Munshi S, Varghese A, Dhar-Munshi S. Computer vision syndrome—A common cause of unexplained visual symptoms in the modern era. Int J Clin Pract 2017; 71(7): e12962. [DOI] [PubMed] [Google Scholar]
- 7. Vaz FT, Henriques SP, Silva DS, et al. Digital asthenopia: Portuguese group of ergophthalmology survey. Acta Méd Port 2019; 32(4): 260–265. [DOI] [PubMed] [Google Scholar]
- 8. Akkaya S, Atakan T, Acikalin B, et al. Effects of long-term computer use on eye dryness. North clin Istanb 2018; 5(4): 319. [DOI] [PMC free article] [PubMed] [Google Scholar]
- 9. Billones RKC, Bedruz RAR, Arcega ML, et al. Digital eye strain and fatigue recognition using electrooculogram signals and ultrasonic distance measurements. In 2018 IEEE 10th International Conference on Humanoid, Nanotechnology, Information Technology, Communication and Control, Environment and Management (HNICEM), Baguio City: Philippines, 2018. IEEE. [Google Scholar]
- 10. Chawla A, Lim TC, Shikhare SN, et al. Computer vision syndrome: darkness under the shadow of light. Can Assoc Radiol J 2019; 70(1): 5–9. [DOI] [PubMed] [Google Scholar]
- 11. Iqbal M, Elzembely H, Elmassry A, et al. Computer vision syndrome prevalence and ocular sequelae among medical students: a university-wide study on a marginalized visual security issue. Open Ophthalmol J 2021; 15(1): 156–170. [Google Scholar]
- 12. Leung TW, Li RW-h, Kee C-s. Blue-light filtering spectacle lenses: optical and clinical performances. PloS one 2017; 12(1): e0169114. [DOI] [PMC free article] [PubMed] [Google Scholar]
- 13. Stringham JM, Stringham NT, O’Brien KJ, et al. Macular carotenoid supplementation improves visual performance, sleep quality, and adverse physical symptoms in those with high screen time exposure. Foods 2017; 6(7): 47. [DOI] [PMC free article] [PubMed] [Google Scholar]
- 14. Touitou Y, Touitou D, Reinberg A, et al. Disruption of adolescents’ circadian clock: the vicious circle of media use, exposure to light at night, sleep loss and risk behaviors. J Physiol Paris 2016; 110(4): 467–479. [DOI] [PubMed] [Google Scholar]
- 15. Heiting G, Wan L. Computer vision syndrome and computer glasses: FAQ. All about vision, 2017. [Google Scholar]
- 16. Lakachew NA, Weldemichael DZ, Alemu HW, et al. Prevalence and associated factors of computer vision syndrome among bank workers in Gondar City, Northwest Ethiopia, 2015. Clin Optom 2017; 9: 67–76. [DOI] [PMC free article] [PubMed] [Google Scholar]
- 17. Mani K. Ergonomics education for office computer workers: an evidence-based strategy. In: Korhan O. (ed.) Anatomy, posture, prevalence, pain, treatment and interventions of musculoskeletal disorders, London: InTech, 2018, pp. 47–62. [Google Scholar]
- 18. Singh H, Tigga MJ, Laad S, et al. Prevention of ocular morbidity among medical students by prevalence assessment of asthenopia and its risk factors. J Evid Based Med Healthc 2016; 3(15): 532–536. [Google Scholar]
- 19. Council V. Eyes overexposed: the digital device dilemma. Alexandria, VA: The Vision Councile, 2016. [Google Scholar]
- 20. Mastrota KM. As seen on TV: doing harm, not help, to the ocular surface. Optometry Times 2019; 11(9): 30–32. [Google Scholar]
- 21. Palaiologou I. Children under five and digital technologies: implications for early years pedagogy. Eur Early Child Educ Res J 2016; 24(1): 5–24. [Google Scholar]
- 22. Tadesse S, Kelaye T, Assefa Y. Utilization of personal protective equipment and associated factors among textile factory workers at Hawassa Town, Southern Ethiopia. J Occup Med Toxicol 2016; 11(1): 1–6. [DOI] [PMC free article] [PubMed] [Google Scholar]
- 23. Charpe NA, Kaushik V. Computer vision syndrome (CVS): recognition and control in software professionals. J Hum Ecol 2009; 28(1): 67–69. [Google Scholar]
- 24. Wimalasundera S. Computer vision syndrome. Galle Med J 2009; 11(1): 25–29. [Google Scholar]
- 25. Agarwal S, Goel D, Sharma A. Evaluation of the factors which contribute to the ocular complaints in computer users. J Clin Diagn Res 2013; 7(2): 331. [DOI] [PMC free article] [PubMed] [Google Scholar]
- 26. Gowrisankaran S, Sheedy JE. Computer vision syndrome: a review. Work 2015; 52(2): 303–314. [DOI] [PubMed] [Google Scholar]
- 27. Long J, Cheung R, Duong S, et al. Viewing distance and eyestrain symptoms with prolonged viewing of smartphones. Clin Exp Optom 2017; 100(2): 133–137. [DOI] [PubMed] [Google Scholar]
- 28. Millodot M. Dictionary of optometry and visual science E-book. London: Elsevier Health Sciences, 2014. [Google Scholar]
- 29. Ranasinghe P, Wathurapatha W, Perera YS, et al. Computer vision syndrome among computer office workers in a developing country: an evaluation of prevalence and risk factors. BMC Res Notes 2016; 9(1): 1–9. [DOI] [PMC free article] [PubMed] [Google Scholar]
- 30. Shantakumari N, Eldeeb R, Sreedharan J, et al. Computer use and vision. Related problems among university students in Ajman, United Arab Emirate. Ann Med Health Sci Res 2014; 4(2): 258–263. [DOI] [PMC free article] [PubMed] [Google Scholar]
- 31. Page MJ, McKenzie JE, Bossuyt PM, et al. The PRISMA 2020 statement: an updated guideline for reporting systematic reviews. Int J Surg 2021; 88: 105906. [DOI] [PubMed] [Google Scholar]
- 32. Moher D, Shamseer L, Clarke M, et al. Preferred reporting items for systematic review and meta-analysis protocols (PRISMA-P) 2015 statement. Syst Rev 2015; 4(1): 1–9. [DOI] [PMC free article] [PubMed] [Google Scholar]
- 33. Agrawal A, Rasouli M. Reference management software programs, in EndNote 1-2-3 Easy! London: Springer, 2019, pp. 7–18. [Google Scholar]
- 34. Munn Z, Tufanaru C, Aromataris E. JBI’s systematic reviews: data extraction and synthesis. AJN Am J Nurs 2014; 114(7): 49–54. [DOI] [PubMed] [Google Scholar]
- 35. Berkey CS, Hoaglin DC, Mosteller F, et al. A random-effects regression model for meta-analysis. Stat Med 1995; 14(4): 395–411. [DOI] [PubMed] [Google Scholar]
- 36. Higgins JP, Thompson SG. Quantifying heterogeneity in a meta-analysis. Stat Med 2002; 21(11): 1539–1558. [DOI] [PubMed] [Google Scholar]
- 37. Pustejovsky JE, Rodgers MA. Testing for funnel plot asymmetry of standardized mean differences. Res Synth Methods 2019; 10(1): 57–71. [DOI] [PubMed] [Google Scholar]
- 38. van Enst WA, Ochodo E, Scholten RJPM, et al. Investigation of publication bias in meta-analyses of diagnostic test accuracy: a meta-epidemiological study. BMC Med Res Methodol 2014; 14(1): 1–11. [DOI] [PMC free article] [PubMed] [Google Scholar]
- 39. Abudawood GA, Ashi HM. Computer vision syndrome among undergraduate medical students in King Abdulaziz University, Jeddah, Saudi Arabia. J Ophthalmol 2020; 2020: 2789376. [Google Scholar]
- 40. Zalat MM, Amer SM, Wassif GA, et al. Computer vision syndrome, visual ergonomics and amelioration among staff members in a Saudi medical college. Int J Occup Saf Ergon 2021; 28(2): 1033–1041. [DOI] [PubMed] [Google Scholar]
- 41. Al Dandan O, Hassan A, Al Shammari M, et al. Digital eye strain among radiologists: a survey-based cross-sectional study. Acad Radiol 2021; 28(8): 1142–1148. [DOI] [PubMed] [Google Scholar]
- 42. Al Subaie M, Al-Dossari S, Bougmiza M IHEB, et al. Computer vision syndrome among mobile phone users in Al-Ahsa, Kingdom of Saudi Arabia. Al-Basar Int J Ophthalmol 2017; 4(4): 99. [Google Scholar]
- 43. Mansoori N, Qamar N, Mubeen SM, et al. Dry eye syndrome and associated risk factors among computer users in Karachi, Pakistan. Ann Abbasi Shaheed Hosp Karachi Med Dent Coll 2017; 22(3): 165–170. [Google Scholar]
- 44. Arshad S, Qureshi MF, Ali M, et al. Computer vision syndrome: prevalence and predictors among students. Ann Psychophysiol 2019; 6(1): 15–22. [Google Scholar]
- 45. Noreen K, Batool Z, Fatima T, et al. Prevalence of computer vision syndrome and its associated risk factors among under graduate medical students of urban karachi. Pak J Ophthalmol 2016; 32(3): 140–146. [Google Scholar]
- 46. Noreen K, Ali K, Aftab K, et al. Computer vision syndrome (CVS) and its associated risk factors among undergraduate medical students in midst of COVID-19. Pak J Ophthalmol 2021; 37(1): 102–108. [Google Scholar]
- 47. Artime-Ríos E, Suárez-Sánchez A, Sánchez-Lasheras F, et al. Computer vision syndrome in healthcare workers using video display terminals: an exploration of the risk factors. J Adv Nurs 2022; 78(7): 2095–2110. [DOI] [PubMed] [Google Scholar]
- 48. Cantó-Sancho N, Sánchez-Brau M, Ivorra-Soler B, et al. Computer vision syndrome prevalence according to individual and video display terminal exposure characteristics in Spanish university students. Int J Clin Pract 2021; 75(3): e13681. [DOI] [PubMed] [Google Scholar]
- 49. Sánchez-Brau M, Domenech-Amigot B, Brocal-Fernández F, et al. Prevalence of computer vision syndrome and its relationship with ergonomic and individual factors in presbyopic VDT workers using progressive addition lenses. Int J Environ Res Public Health 2020; 17(3): 1003. [DOI] [PMC free article] [PubMed] [Google Scholar]
- 50. Boadi-Kusi SB, Abu SL, Acheampong GO, et al. Association between poor ergophthalmologic practices and computer vision syndrome among university administrative staff in Ghana. J Environ Public Health 2020; 2020: 7516357. [DOI] [PMC free article] [PubMed] [Google Scholar]
- 51. Boadi-Kusi SB, Adueming PO-W, Hammond FA, et al. Computer vision syndrome and its associated ergonomic factors among bank workers. Int J Occup Saf Ergon 2021; 28(2): 1219–1226. [DOI] [PubMed] [Google Scholar]
- 52. Akowuah PK, Nti AN, Ankamah-Lomotey S, et al. Digital device use, computer vision syndrome, and sleep quality among an African undergraduate population. Adv Public Health 2021; 2021: 6611348. [Google Scholar]
- 53. Derbew H, Nega A, Tefera W, et al. Assessment of computer vision syndrome and personal risk factors among employees of commercial bank of Ethiopia in Addis Ababa, Ethiopia. J Environ Public Health 2021; 2021: 6636907. [DOI] [PMC free article] [PubMed] [Google Scholar]
- 54. Dessie A, Adane F, Nega A, et al. Computer vision syndrome and associated factors among computer users in Debre Tabor Town, Northwest Ethiopia. J Environ Public Health 2018; 2018: 4107590. [DOI] [PMC free article] [PubMed] [Google Scholar]
- 55. Gondol BN, Areba AS, Kanno GG, et al. Prevalence of visual and posture related symptoms of computer vision syndrome among computer user workers of Ethiopian roads authority. J Environ Occup Health 2020; 10(3): 73–78. [Google Scholar]
- 56. Lemma MG, Beyene KG, Tiruneh MA. Computer vision syndrome and associated factors among secretaries working in ministry offices in Addis Ababa, Ethiopia. Clin Optome 2020; 12: 213. [DOI] [PMC free article] [PubMed] [Google Scholar]
- 57. Lemma MT, Sadik MI, Markos Y, et al. Computer vision syndrome and its predictors among secretary employees working in Jimma University, Southwest Ethiopia. J Environ Occup Health 2021; 11(2): 27–36. [Google Scholar]
- 58. Zenbaba D, Sahiledengle B, Bonsa M, et al. Prevalence of computer vision syndrome and associated factors among instructors in Ethiopian Universities: a web-based cross-sectional study. Sci World J 2021; 2021: 3384332. [DOI] [PMC free article] [PubMed] [Google Scholar]
- 59. Kamal NN, Abd El-Mageed AS. Determinants of computer vision syndrome among bank employees in Minia City, Egypt. Egypt J Community Med 2018; 36(4): 70–76. [Google Scholar]
- 60. Nagwa E, Marwa MA, Almehelmy EM, et al. Computer vision syndrome and associated factors among students of Faculty of Medicine, Cairo University. Med J Cairo Univ 2019; 87: 4877–4881. [Google Scholar]
- 61. Zayed HAM, Saied SM, et al. Digital eye strain: prevalence and associated factors among information technology professionals, Egypt. Environ Sci Pollut Res 2021; 28(20): 25187–25195. [DOI] [PubMed] [Google Scholar]
- 62. Iqbal M, Said O, Ibrahim O, et al. Visual sequelae of computer vision syndrome: a cross-sectional case-control study. J Ophthalmol 2021; 2021: 6630286. [DOI] [PMC free article] [PubMed] [Google Scholar]
- 63. Nwankwo B, Mumueh K, Olorukooba A, et al. Computer vision syndrome: prevalence and associated risk factors among undergraduates in a tertiary institution in north western Nigeria. Kanem J Med Sci 2021; 15(1): 1–8. [Google Scholar]
- 64. Agbonlahor O. Prevalence and knowledge of computer vision syndrome (CVS) among the working class adults in FCT Nigeria. J Niger Optom Assoc 2019; 21(1): 49–60. [Google Scholar]
- 65. Gammoh Y. Digital eye strain and its risk factors among a university student population in Jordan: a cross-sectional study. Cureus 2021; 13(2): e13575. [DOI] [PMC free article] [PubMed] [Google Scholar]
- 66. Han C-C, Liu R, Liu RR, et al. Prevalence of asthenopia and its risk factors in Chinese college students. Int J Ophthalmol 2013; 6(5): 718. [DOI] [PMC free article] [PubMed] [Google Scholar]
- 67. Wang L, Wei X, Deng Y, et al. Computer vision syndrome during SARS-CoV-2 outbreak in university students: a comparison between online courses and classroom lectures. Front Public Health 2021; 9: 696036. [DOI] [PMC free article] [PubMed] [Google Scholar]
- 68. Hashemi H, Khabazkhoob M, Forouzesh S, et al. The prevalence of asthenopia and its determinants among schoolchildren. J Compr Ped 2017; 8(1): e43208. [Google Scholar]
- 69. Poudel S, Khanal SP. Magnitude and determinants of computer vision syndrome (CVS) among IT workers in Kathmandu, Nepal. Nepal J Ophthalmol 2020; 12(2): 245–251. [DOI] [PubMed] [Google Scholar]
- 70. Tiwari RR, Saha A, Parikh JR, et al. Asthenopia (eyestrain) in working children of gem-polishing industries. Toxicol Ind Health 2011; 27(3): 243–247. [DOI] [PubMed] [Google Scholar]
- 71. Ranganatha S, Jailkhani S. Prevalence and associated risk factors of computer vision syndrome among the computer science students of an engineering college of Bengaluru-a cross-sectional study. Galore Int J Health Sci Res 2019; 4(3): 10–15. [Google Scholar]
- 72. Logaraj M, Madhupriya V, Hegde SK, et al. Computer vision syndrome and associated factors among medical and engineering students in Chennai. Ann Med Health Sci Res 2014; 4(2): 179–185. [DOI] [PMC free article] [PubMed] [Google Scholar]
- 73. Mohan A, Sen P, Shah C, et al. Prevalence and risk factor assessment of digital eye strain among children using online e-learning during the COVID-19 pandemic: Digital eye strain among kids (DESK study-1). Indian J Ophthalmol 2021; 69(1): 140. [DOI] [PMC free article] [PubMed] [Google Scholar]
- 74. Rafeeq U, Omear M, Chauhan L, et al. Computer vision syndrome among individuals using visual display terminals for more than two hours. Delta J Ophthalmol 2020; 21(3): 139. [Google Scholar]
- 75. Rathore D. A cross sectional study to assess prevalence of computer vision syndrome and vision related problems in computer users. J Med Sci Clin Res 2016; 4: 11007–11012. [Google Scholar]
- 76. Verma S, Midya U, Gupta S, et al. A cross-sectional study of the prevalence of computer vision syndrome and dry eye in computer operators. TNOA J Ophthalmic Sci Res 2021; 59(2): 160. [Google Scholar]
- 77. Moon JH, Kim KW, Moon NJ. Smartphone use is a risk factor for pediatric dry eye disease according to region and age: a case control study. BMC Ophthalmol 2016; 16(1): 1–7. [DOI] [PMC free article] [PubMed] [Google Scholar]
- 78. Ranasinghe P, Wathurapatha WS, Perera YS, et al. Computer vision syndrome among computer office workers in a developing country: an evaluation of prevalence and risk factors. BMC Res Notes 2016; 9: 150. [DOI] [PMC free article] [PubMed] [Google Scholar]
- 79. Sa EC, Ferreira M, Jr, Rocha LE, et al. Risk factors for computer visual syndrome (CVS) among operators of two call centers in São Paulo, Brazil. Work 2012; 41: 3568–3574. [DOI] [PubMed] [Google Scholar]
- 80. Vilela MA, Castagno VD, Meucci RD, et al. Asthenopia in schoolchildren. Clin ophthalmol 2015; 9: 1595–1603. [DOI] [PMC free article] [PubMed] [Google Scholar]
- 81. Sawaya RIT, El Meski N, Saba JB, et al. Asthenopia among university students: the eye of the digital generation. J Family Med Prim Care 2020; 9(8): 3921–3932. [DOI] [PMC free article] [PubMed] [Google Scholar]
- 82. Uchino M, Yokoi N, Uchino Y, et al. Prevalence of dry eye disease and its risk factors in visual display terminal users: the Osaka study. Am J Ophthalmol 2013; 156(4): 759–766. [DOI] [PubMed] [Google Scholar]
- 83. Wangsan K, Upaphong P, Assavanopakun P, et al. Self-reported computer vision syndrome among Thai University students in virtual classrooms during the COVID-19 pandemic: prevalence and associated factors. Int J Environ Res Public Health 2022; 19(7): 3996. [DOI] [PMC free article] [PubMed] [Google Scholar]
- 84. Khan S, Khan S, Midya MZ, et al. Comparison of prevalence data about digital eye strain (DES), pre-lockdown versus post-lockdown period in India: a systematic review study. Int J Res Rev 2021; 8(5): 59–68. [Google Scholar]
- 85. Rosenfield M. Computer vision syndrome: a review of ocular causes and potential treatments. Ophthalmic Physiol Opt 2011; 31(5): 502–515. [DOI] [PubMed] [Google Scholar]
- 86. Adane F, Alamneh YM, Desta M, et al. Computer vision syndrome and predictors among computer users in Ethiopia: a systematic review and meta-analysis. Trop Med Health 2022; 50(1): 1–12. [DOI] [PMC free article] [PubMed] [Google Scholar]
- 87. Portello JK, Rosenfield M, Bababekova Y, et al. Computer-related visual symptoms in office workers. Ophthalmic Physiol Opt 2012; 32(5): 375–382. [DOI] [PubMed] [Google Scholar]
- 88. Lambooij M, Fortuin M, Heynderickx I, et al. Visual discomfort and visual fatigue of stereoscopic displays: a review. J Imaging Sci Technol 2009; 53(3): 30201–30214. [Google Scholar]
- 89. Bando T, Iijima A, Yano S. Visual fatigue caused by stereoscopic images and the search for the requirement to prevent them: a review. Displays 2012; 33(2): 76–83. [Google Scholar]
- 90. Bali J, Neeraj N, Bali RT. Computer vision syndrome: a review. J Clin Ophthalmol Res 2014; 2(1): 61. [Google Scholar]
- 91. Amit LM, Song Y-W. Effectiveness of ergonomic intervention in work-related postures and musculoskeletal disorders of call center workers: a case-control study. Ind Eng Manag Syst 2021; 20(2): 109–118. [Google Scholar]
- 92. Mowatt L, Gordon C, Santosh ABR, et al. Computer vision syndrome and ergonomic practices among undergraduate university students. Int J Clin Pract 2018; 72(1): e13035. [DOI] [PubMed] [Google Scholar]
- 93. Logaraj M, Priya VM, Seetharaman N, et al. Practice of ergonomic principles and computer vision syndrome (CVS) among Undergraduates students in Chennai. Natl J Med Res 2013; 3(2): 111–116. [Google Scholar]
- 94. Wang J, Li M, Zhu D, et al. Smartphone overuse and visual impairment in children and young adults: systematic review and meta-analysis. J Med Internet Res 2020; 22(12): e21923. [DOI] [PMC free article] [PubMed] [Google Scholar]
- 95. Turkistani AN, Al-Romaih A, Alrayes MM, et al. Computer vision syndrome among Saudi population: an evaluation of prevalence and risk factors. J Family Med Prim Care 2021; 10(6): 2313. [DOI] [PMC free article] [PubMed] [Google Scholar]
- 96. Sitaula RK, Khatri A. Knowledge, attitudes and practice of computer vision syndrome among medical students and its impact on ocular morbidity. J Nepal Health Res Counc 2018; 16(3): 291–296. [PubMed] [Google Scholar]
- 97. Vilela M, Pellanda L, Cesa CC, et al. Asthenopia prevalence and risk factors associated with professional computer use-a systematic review. Int J Adv Med Sci 2015; 3(2): 51–60. [Google Scholar]
- 98. Ellahi A, Khalil MS, Akram F. Computer users at risk: health disorders associated with prolonged computer use. J Bus Manag Econ 2011; 2(4): 171–182. [Google Scholar]
- 99. Al Rashidi SH, Alhumaidan H. Computer vision syndrome prevalence, knowledge and associated factors among Saudi Arabia University Students: is it a serious problem? Int J Health Sci 2017; 11(5): 17. [PMC free article] [PubMed] [Google Scholar]
- 100. Seegehalli PJ. Digital eye strain reduction techniques: A review. Int J Comput Sci Eng 2016; 8(3): 94–100. [Google Scholar]
Associated Data
This section collects any data citations, data availability statements, or supplementary materials included in this article.
Supplementary Materials
Supplemental material, sj-docx-1-smo-10.1177_20503121221142402 for Computer vision syndrome and its determinants: A systematic review and meta-analysis by Asamene Kelelom Lema and Etsay Woldu Anbesu in SAGE Open Medicine
Supplemental material, sj-docx-2-smo-10.1177_20503121221142402 for Computer vision syndrome and its determinants: A systematic review and meta-analysis by Asamene Kelelom Lema and Etsay Woldu Anbesu in SAGE Open Medicine
Supplemental material, sj-docx-4-smo-10.1177_20503121221142402 for Computer vision syndrome and its determinants: A systematic review and meta-analysis by Asamene Kelelom Lema and Etsay Woldu Anbesu in SAGE Open Medicine
Supplemental material, sj-tiff-3-smo-10.1177_20503121221142402 for Computer vision syndrome and its determinants: A systematic review and meta-analysis by Asamene Kelelom Lema and Etsay Woldu Anbesu in SAGE Open Medicine


