

Abstract
The vicious invasive alien plant Amaranthus palmeri poses a serious threat to ecological security and food security due to its strong adaptability, competitiveness, and herbicide resistance. Predicting its potential habitats under current and future climate change is critical for monitoring and early warning. In this study, we used two sets of climate data, namely, WorldClim1.4 and RCPs (the historical climate data of WorldClim version 1.4 and future climate data of RCPs), WorldClim2.1 and SSPs (the historical climate data of WorldClim version 2.1 and future climate data of SSPs), to analyze the dominant environmental variables affecting the habitat suitability and predict the potential distribution of A. palmeri to climate change in China based on the MaxEnt model. The results show that (i) Temperature has a greater impact on the distribution of A. palmeri. The relative contributions of temperature‐related variables count to 70% or more, and the annual mean temperature (bio1) reached more than 40%. (ii) At present, the potentially suitable area is widely distributed in the central‐east and parts of southwest China, and the high suitable area is focused on the North China Plain. The potential suitable area predicted by WorldClim1.4 and WorldClim2.1 both accounts for about 31% of China's total land area. (iii) Future climate change will expand the suitable habitats to high latitudes and altitudes. The overall suitable area maximum increased to 44.93% under SSPs and 38.91% under RCPs. We conclude that climate change would increase the risk of A. palmeri expanding to high latitudes and altitudes, the results have practical implications for the effective long‐term management in response to the global warming of A. palmeri.
Keywords: Amaranthus palmeri S. Watson, climate change, MaxEnt model, potential distribution, suitability
Amaranthus palmeri S. Watson, a malignant invasive weed, its invasion potential has not been fully exploited in China. In the future, it will expand significantly to higher latitudes and altitudes in response to global warming.
1. INTRODUCTION
Biosecurity, biodiversity and biological invasion are interactive and closely linked. Biosecurity is related to ecological civilization, and a good ecological environment is an important foundation for agriculture's high quality and green development. Protecting biodiversity and preventing the invasion of alien species are essential parts of biosecurity, and biological invasion is one of the direct causes of biodiversity decline (McGeoch et al., 2010). Invasive alien species threaten global biodiversity and cause immeasurable damage to ecology by altering the structure and function of ecosystems and disrupting key biological interactions (Mitchell et al., 2006). In addition, the total minimum economic cost of the global biological invasion reached US$1.288 trillion (2017 US dollars) between 1970 and 2017 (Diagne et al., 2021). Nowadays, with the accelerated process of world globalization, the spread risk of invasive alien species is increasing (Seebens et al., 2017, 2018). And the external biological threats and internal biological risks coexist reciprocally. Therefore, it is essential to strengthen the prevention and control of invasive alien species.
Amaranthus palmeri S. Watson is an annual C4 herb originating from the southwestern United States and northwestern Mexico (Sauer, 1957). In China, A. palmeri was first discovered in Beijing in 1985 (Li, 2003). Now, it is mainly distributed in Beijing, Tianjin, Henan, and so on (Li, Cao, et al., 2021; Lv et al., 2015; Mo et al., 2017). It threatens biodiversity and causes a significant decline in crop production by competing for light, water, nutrition, and living space with native plants, existing as a host for various nematode species, and allelopathic effect (Kaspary et al., 2021; Menges, 1987; Ward et al., 2013). According to the statistics of the United States from 2001 to 2010, the most serious yield losses of sweet potato, corn, soybean, peanut, cotton and sorghum caused by A. palmeri were 94%, 91%, 79%, 68%, 59%, and 50%, respectively (Ward et al., 2013). Furthermore, according to a study in Tianjin, China, the relative dominance of A. palmeri was negatively correlated with the Shannon‐Wiener diversity index and evenness. With the increase of the invasion effect of A. palmeri, the species richness decreased, which seriously affected the biodiversity (Li, Mo, et al., 2021).
At present, the control of A. palmeri mainly relies on applying herbicides. However, multiple populations of A. palmeri resistant to herbicides have developed worldwide due to the cultivation of herbicide‐resistant crops and the long‐term use of herbicides (Heap, 2022; Ji et al., 2020). Furthermore, as a dioecious plant, A. palmeri can transfer herbicide‐resistance genes to other closely related weeds through interspecific hybridization, posing the risk of forming a “super weed” (Molin et al., 2016; Ward et al., 2013). China is a big agricultural country with limited arable land. Once A. palmeri is established in a certain place, it is difficult to be completely eradicated it, which will inevitably affect China's agricultural production (Xu et al., 2013). Based on the principle that prevention is superior to governance, it is urgent to assess the risk of A. palmeri to identify the dominant environmental variables that affect the suitable habitat and judge the suitable degree of A. palmeri in China, which contributes to early warning and rapid response.
Climate is important in determining species distribution (Pyšek et al., 2020). Temperature and rainfall indirectly affect the interaction between native and exotic species by influencing species' phenological and physiological activities, thereby affecting the spatial pattern of species (Robinson et al., 2020). Global climate change and extreme climate events could completely alter species' spatial distribution and prevalence (Manzoor et al., 2021; Marchioro & Krechemer, 2021). In addition, rising temperatures and changes in the timing and frequency of rainfall may exacerbate the negative effects of A. palmeri on crops (Davis et al., 2015; McDonald et al., 2009). Therefore, exploring the spatial pattern of suitable areas for A. palmeri under future climate change is important for prospective risk warning.
Species Distribution Models (SDMs) correlate species' distribution data with environmental variables and study the potential spatial pattern of species according to the specific algorithm (Phillips et al., 2006; Yates et al., 2018). The results can be interpreted as the probability of species occurrence, habitat suitability, or species richness (Tu et al., 2021; Zhu et al., 2013). Over the past few decades, many studies applied SDMs to risk assessment of invasive alien species and analysis of the impact of climate change on species distribution (Adhikari et al., 2021; Hong et al., 2021). According to the statistic, the Maximum Entropy (MaxEnt) model ranked first among 17 modeling algorithms used in articles on SDMs and invasive alien plants from 1996 to 2019 (Silva et al., 2021). Many researchers have proved that the MaxEnt model performs well in prediction accuracy and operation (Hong et al., 2021; Phillips & Dudík, 2008; Roger et al., 2015) and has become one of the most popular species distribution modeling tools (Merow et al., 2013).
At present, the study of A. palmeri mainly focuses on the resistance and biological and physiological mechanisms (Ji et al., 2022; Maxwel et al., 2020; Mesgaran et al., 2021; Meyer et al., 2020). In addition, there are studies on predicting suitable habitats for A. palmeri. However, most of the studies are focused on the potential distribution predictions under the current climatic conditions, lacking future projection. And there is no detailed explanation for the dominant environmental variables that affect growth suitability. For example, Xu et al. (2013), Li et al. (2015) and Zhao (2018) used CLIMEX, MaxEnt, and BIOCLIM models to predict the potential distribution of A. palmeri in China under current climatic conditions, respectively. According to another study, CLIMEX was used to predict the potential geographical distribution of A. palmeri under current and future climate scenarios. However, only the Representative Concentration Pathway (RCP) 8.5 emission scenario of the 2050s was adopted, and there was no detailed description of the suitability of A. palmeri in China (Kistner & Hatfield, 2018). The most critical theoretical basis for applying the MaxEnt model is the conservation of species niches (Zhu et al., 2013). Li et al. (2015) pointed out that the niche of A. palmeri was conservative in the process of invasion, which laid a foundation for the application of the MaxEnt model.
Amaranthus palmeri may exhibit a competitive disadvantage in high latitudes and altitudes (Ward et al., 2013). Will it expand northwards in response to climate change in the future? If it expands, how is the expansion? All need further research.
This study used the MaxEnt model to investigate the dominant environmental variables and predict the potentially suitable areas of A. palmeri in China under current and future climate change. The specific objectives are (i) to identify the dominant environmental variables affecting the suitable habitat of A. palmeri and (ii) to predict potential distribution and migration in China under current and future climate scenarios. The outcome of this study may provide a scientific basis with practical significance for the long‐term management of A. palmeri, and it is of great importance for protecting ecological security, biodiversity, and food security.
2. MATERIALS AND METHODS
2.1. Occurrence data
The spatial distribution data of A. palmeri was downloaded from Global Biodiversity Information Facility (GBIF; https://www.gbif.org/), Southwest Environmental Information Network (SEINet; https://swbiodiversity.org/seinet/index.php), Center for Agriculture and Bioscience International (CABI; https://www.plantwise.org/knowledgebank/), Plant Photo Bank of China (PPBC; http://ppbc.iplant.cn/), Chinese Virtual Herbarium (CVH; https://www.cvh.ac.cn/), National Specimen Information Infrastructure (NSII; http://www.nsii.org.cn/), and some records from literatures (Cao et al., 2020; Li, 2003; Li et al., 2015, 2017; Mo et al., 2017; Wu et al., 2018; Zhang, 2020). We kept the records with accurate latitude and longitude from the above data. In addition, records with detailed geographic locations were obtained from CVH, NSII, PPBC, and literatures. Map World (https://www.tianditu.gov.cn) was used to determine geographical coordinates. After deleting the duplicate and inaccuracy records, 2141 samples were retained. To reduce sampling bias, the create fishnet function of ArcGIS software version 10.2 was used to generate the fishnet regarding the spatial resolutions (2.5 min) of the environment layer. It was retained when there was only one occurrence of data in each geographic space. Their average value was calculated and retained when there were more than or equal to two distributed data. After filtering, we obtained 1679 effective samples (Figure 1).
FIGURE 1.

Spatial distribution of the sampling records of Amaranthus palmeri.
2.2. Environment variables
The distribution of species at a large geographical spatial scale is mainly related to climate (Hortal et al., 2010; Pearson & Dawson, 2003; Soberón, 2007, 2010). Therefore, our study mainly considers the influence of climate on the distribution of A. palmeri. The climate data were downloaded from the WorldClim data website (https://www.worldclim.org/data/index.html) including 19 bioclimatic variables (bio1–bio19). Bioclimatic variables are derived from monthly temperature and rainfall values, which are of more biological significance and are widely used in species distribution modeling and related ecological modeling techniques. In addition, altitude may affect the occurrence by affecting temperature (Azrag et al., 2018). Thus, we added altitude as a terrain factor. The elevation above sea level data was derived from the SRTM elevation data. The description of the environment variables is shown in Table 1. Generally, the higher the spatial resolution of the environmental layer is, the more accurate the model running result is. However, the pressure of the model running will greatly increase. Therefore, we chose the 2.5 min spatial resolution of all environmental layers to ensure high accuracy and good running ability.
TABLE 1.
Abbreviation and description of environmental variables
| Abbreviation | Description | Unit | Abbreviation | Description | Unit |
|---|---|---|---|---|---|
| bio1 | Annual mean temperature | °C | bio11 | Mean temperature of coldest quarter | °C |
| bio2 | Mean diurnal range (mean of monthly [max temp − min temp]) | °C | bio12 | Annual precipitation | mm |
| bio3 | Isothermality (bio2/bio7) (×100) | / | bio13 | Precipitation of wettest month | mm |
| bio4 | Temperature seasonality | / | bio14 | Precipitation of driest month | mm |
| bio5 | Max temperature of warmest month | °C | bio15 | Precipitation seasonality (coefficient of variation) | / |
| bio6 | Min temperature of coldest month | °C | bio16 | Precipitation of wettest quarter | mm |
| bio7 | Temperature annual range (bio5–bio6) | °C | bio17 | Precipitation of driest quarter | mm |
| bio8 | Mean temperature of wettest quarter | °C | bio18 | Precipitation of warmest quarter | mm |
| bio9 | Mean temperature of driest quarter | °C | bio19 | Precipitation of coldest quarter | mm |
| bio10 | Mean temperature of warmest quarter | °C | elev | Elevation above sea level | m |
Note: The variables being used in the model are marked bold.
The historical climate data include two versions, WorldClim 1.4 for 1960–1990 and WorldClim 2.1 for 1970–2000. There are two versions for future climate scenarios, RCPs (Representative Concentration Pathways) and SSPs (Shared Socio‐economic Pathways). RCPs were calibrated with WorldClim 1.4 as the baseline and proposed in IPCC‐CMIP5. RCPs contain four pathways (RCPs: 2.6, 4.5, 6.0, and 8.5). SSPs were calibrated with WorldClim 2.1 as the baseline and proposed in IPCC‐CMIP6. The RCPs have new versions in CMIP6. These updated scenarios are called SSP1‐2.6, SSP2‐4.5, SSP4‐6.0, and SSP5‐8.5 (SSPs: 126, 245, 460, and 585). At present, most studies have been based on RCPs. However, the SSPs have considered social and economic development and tended to show notably higher climate sensitivity than RCPs. Therefore, we chose two sets of historical climate data and future climate scenarios to conduct a comprehensive analysis.
As for the Global Climate Models (GCMs), we used the BCC‐CSM1‐1 and the BCC‐CSM2‐MR, which are reliable for simulating precipitation and temperature in China. The Beijing Climate Center Climate System Model (BCC‐CSM) is a fully coupled global climate system consisting of atmosphere, land surface, ocean, and sea ice, which is developed on the basis of the Community Climate System Model (CCSM) by improving the process parameterization schemes of the atmosphere and land surface component models (Shi et al., 2020; Wu et al., 2013, 2019). The BCC‐CSM1‐1 predicts that the rise of mean temperature in China by the end of the 21st century is consistent with the CMIP5 multi‐model ensemble mean, and performs well in simulating the historical evolution of global and Chinese mean surface air temperature (Wu et al., 2013, 2014). BCC‐CSM2‐MR improves the spatial pattern of surface air temperature, precipitation, general atmospheric circulation, and other main climate variables at a global scale and regional scale in East Asia due to the new cloud fraction scheme and the indirect influence of aerosols on cloud and precipitation (Wu et al., 2019). The GCMs developed by BCC‐CSM have been used in many studies to simulate the distribution of native and invasive species in China (Ma et al., 2021; Tu et al., 2021; Zhao, Deng, et al., 2021).
Eventually, we selected two sets of current and future climate scenarios, including WorldClim1.4, RCP2.6‐2050s, RCP2.6‐2070s, RCP4.5‐2050s, RCP4.5‐2070s, RCP8.5‐2050s, and RCP8.5‐2070s; WorldClim2.1, SSP126‐2050s, SSP126‐2070s, SSP245‐2050s, SSP245‐2070s, SSP585‐2050s, and SSP585‐2070s.
To avoid the over‐fitting caused by the high correlation of environmental variables, we used the Pearson correlation of IBM SPSS Statistics Software version 21 to test the multicollinearity of bioclimatic variables. Only one meaningful variable was retained when the correlation coefficient |R| ≥ .8. The two versions of bioclimatic variables showed similar correlations (Tables 2 and 3). For temperature‐related variables, according to the information that the annual mean temperature plays an important role in the distribution prediction models of A. palmeri (Li et al., 2015; Runquist et al., 2019) and the seeds' germination ability of A. palmeri is significantly affected by temperature seasonality (Jha et al., 2010), we retained annual mean temperature (bio1) and temperature seasonality (bio4) and removed variables that are highly correlated with them. For precipitation‐related variables, according to the information that the appearance of A. palmeri is often related to arid environment, it can quickly respond to the available moisture in the environment (Ehleringer, 1983; Piskackova et al., 2021), and severe flooding conditions may affect its occurrence (Franca et al., 2020), we retained extreme precipitation variable precipitation of wettest month (bio13) and quarterly precipitation variable precipitation of driest quarter (bio17) and removed variables that are highly correlated with them. We retained the remaining variables and finally selected 11 bioclimatic variables and elevation to participate in modeling (Table 1).
TABLE 2.
The Pearson correlation coefficient of bioclimatic variables for WorldClim 1.4
| bio1 | bio2 | bio3 | bio4 | bio5 | bio6 | bio7 | bio8 | bio9 | bio10 | bio11 | bio12 | bio13 | bio14 | bio15 | bio16 | bio17 | bio18 | bio19 | |
|---|---|---|---|---|---|---|---|---|---|---|---|---|---|---|---|---|---|---|---|
| bio1 | 1 | ||||||||||||||||||
| bio2 | 0.110 | 1 | |||||||||||||||||
| bio3 | 0.571 | 0.511 | 1 | ||||||||||||||||
| bio4 | −0.574 | 0.029 | −0.814 | 1 | |||||||||||||||
| bio5 | 0.686 | 0.545 | 0.253 | 0.071 | 1 | ||||||||||||||
| bio6 | 0.888 | −0.139 | 0.631 | −0.830 | 0.323 | 1 | |||||||||||||
| bio7 | −0.477 | 0.476 | −0.484 | 0.884 | 0.287 | −0.813 | 1 | ||||||||||||
| bio8 | 0.484 | 0.278 | 0.177 | 0.038 | 0.555 | 0.204 | 0.135 | 1 | |||||||||||
| bio9 | 0.751 | 0.227 | 0.640 | −0.629 | 0.498 | 0.786 | −0.489 | 0.083 | 1 | ||||||||||
| bio10 | 0.817 | 0.186 | 0.144 | −0.002 | 0.905 | 0.504 | 0.046 | 0.611 | 0.499 | 1 | |||||||||
| bio11 | 0.937 | 0.085 | 0.749 | −0.820 | 0.461 | 0.969 | −0.698 | 0.316 | 0.806 | 0.573 | 1 | ||||||||
| bio12 | −0.131 | −0.559 | −0.374 | 0.060 | −0.334 | −0.047 | −0.158 | −0.107 | −0.286 | −0.154 | −0.142 | 1 | |||||||
| bio13 | 0.095 | −0.407 | −0.034 | −0.170 | −0.232 | 0.158 | −0.302 | 0.070 | −0.111 | −0.050 | 0.109 | 0.758 | 1 | ||||||
| bio14 | −0.279 | −0.486 | −0.562 | 0.285 | −0.296 | −0.234 | 0.055 | −0.173 | −0.362 | −0.161 | −0.332 | 0.777 | 0.244 | 1 | |||||
| bio15 | 0.370 | 0.182 | 0.555 | −0.427 | 0.111 | 0.380 | −0.316 | 0.170 | 0.341 | 0.141 | 0.434 | −0.365 | 0.266 | −0.748 | 1 | ||||
| bio16 | 0.066 | −0.419 | −0.025 | −0.198 | −0.277 | 0.156 | −0.328 | 0.012 | −0.110 | −0.102 | 0.101 | 0.799 | 0.983 | 0.285 | 0.215 | 1 | |||
| bio17 | −0.263 | −0.473 | −0.554 | 0.281 | −0.273 | −0.225 | 0.060 | −0.161 | −0.343 | −0.144 | −0.319 | 0.783 | 0.253 | 0.994 | −0.756 | 0.290 | 1 | ||
| bio18 | −0.082 | −0.293 | −0.174 | 0.068 | −0.237 | −0.094 | −0.051 | 0.273 | −0.367 | −0.092 | −0.111 | 0.724 | 0.804 | 0.375 | 0.014 | 0.801 | 0.379 | 1 | |
| bio19 | −0.071 | −0.468 | −0.247 | −0.071 | −0.266 | 0.120 | −0.285 | −0.528 | 0.185 | −0.143 | −0.022 | 0.514 | 0.246 | 0.520 | −0.261 | 0.291 | 0.521 | −0.074 | 1 |
Note: The description of environmental variables is shown in Table 1 and the variables with correlation coefficient ≥0.8 are marked in bold.
TABLE 3.
The Pearson correlation coefficient of bioclimatic variables for WorldClim 2.1
| bio1 | bio2 | bio3 | bio4 | bio5 | bio6 | bio7 | bio8 | bio9 | bio10 | bio11 | bio12 | bio13 | bio14 | bio15 | bio16 | bio17 | bio18 | bio19 | |
|---|---|---|---|---|---|---|---|---|---|---|---|---|---|---|---|---|---|---|---|
| bio1 | 1 | ||||||||||||||||||
| bio2 | 0.156 | 1 | |||||||||||||||||
| bio3 | 0.562 | 0.553 | 1 | ||||||||||||||||
| bio4 | −0.549 | 0.004 | −0.800 | 1 | |||||||||||||||
| bio5 | 0.691 | 0.579 | 0.271 | 0.082 | 1 | ||||||||||||||
| bio6 | 0.878 | −0.112 | 0.609 | −0.818 | 0.317 | 1 | |||||||||||||
| bio7 | −0.434 | 0.482 | −0.434 | 0.869 | 0.324 | −0.795 | 1 | ||||||||||||
| bio8 | 0.484 | 0.329 | 0.213 | 0.036 | 0.556 | 0.191 | 0.165 | 1 | |||||||||||
| bio9 | 0.753 | 0.220 | 0.602 | −0.604 | 0.499 | 0.788 | −0.467 | 0.072 | 1 | ||||||||||
| bio10 | 0.816 | 0.214 | 0.133 | 0.031 | 0.900 | 0.489 | 0.088 | 0.596 | 0.503 | 1 | |||||||||
| bio11 | 0.933 | 0.126 | 0.741 | −0.809 | 0.463 | 0.965 | −0.666 | 0.319 | 0.802 | 0.562 | 1 | ||||||||
| bio12 | −0.118 | −0.557 | −0.348 | 0.027 | −0.350 | −0.021 | −0.203 | −0.098 | −0.263 | −0.155 | −0.120 | 1 | |||||||
| bio13 | 0.116 | −0.388 | 0.012 | −0.223 | −0.258 | 0.190 | −0.354 | 0.087 | −0.093 | −0.058 | 0.147 | 0.753 | 1 | ||||||
| bio14 | −0.269 | −0.486 | −0.545 | 0.269 | −0.290 | −0.215 | 0.029 | −0.173 | −0.335 | −0.150 | −0.319 | 0.770 | 0.231 | 1 | |||||
| bio15 | 0.361 | 0.213 | 0.565 | −0.440 | 0.092 | 0.366 | −0.306 | 0.169 | 0.327 | 0.115 | 0.434 | −0.366 | 0.272 | −0.741 | 1 | ||||
| bio16 | 0.090 | −0.399 | 0.021 | −0.251 | −0.295 | 0.190 | −0.379 | 0.025 | −0.085 | −0.107 | 0.142 | 0.792 | 0.982 | 0.269 | 0.223 | 1 | |||
| bio17 | −0.264 | −0.475 | −0.540 | 0.268 | −0.279 | −0.213 | 0.034 | −0.167 | −0.324 | −0.146 | −0.314 | 0.779 | 0.238 | 0.994 | −0.753 | 0.274 | 1 | ||
| bio18 | −0.032 | −0.257 | −0.101 | 0.002 | −0.221 | −0.041 | −0.100 | 0.300 | −0.328 | −0.072 | −0.046 | 0.718 | 0.814 | 0.344 | 0.038 | 0.810 | 0.351 | 1 | |
| bio19 | −0.082 | −0.489 | −0.271 | −0.066 | −0.287 | 0.124 | −0.307 | −0.542 | 0.206 | −0.148 | −0.032 | 0.495 | 0.215 | 0.516 | −0.264 | 0.267 | 0.516 | −0.102 | 1 |
Note: The description of environmental variables is shown in Table 1 and the variables with correlation coefficient ≥0.8 are marked in bold.
2.3. Model setting and evaluation
In this study, we used the MaxEnt model (version 3.4.1) to predict the potential spatial distribution of A. palmeri. The models were set to 10 replicates using the subsample sampling method; 75% of data were randomly selected as the training data sets and the remaining 25% as the test sets. In addition, the random seed was applied for each run to make a different random test or train partition and use a different random subset of the background. The jackknife was used to measure the importance of environmental variables, and the response curve was drawn to analyze the response of the distribution probability of A. palmeri to environmental factors. Besides, the output format was adjusted to logistic to better understand the probabilistic relationship between distribution and environmental variables. Other settings remain default. Eventually, we adopted the average result of 10 repeated runs.
The commonly used model evaluation indexes include Kappa (Cohen, 1960), TSS (Allouche et al., 2006), and AUC (Hanley & McNeil, 1982) statistics value. AUC measures the commission and omission error equally, which may be misleading in model evaluation (Lobo et al., 2008). Kappa is affected by species distribution rate (Lantz & Nebenzahl, 1996). TSS equally weights sensitivity and specificity, but different weights may be required for practical application (Allouche et al., 2006). Therefore, we used the test set to calculate AUC, Kappa and TSS to evaluate the model's performance. The range of AUC was [0,1] (Swets, 1988), and the range of Kappa and TSS was [−1,1] (Allouche et al., 2006). In practical application, when AUC > 0.5, Kappa > 0, or TSS > 0, the prediction effect of the model is better than that of random prediction and the judgment of the model is meaningful (Allouche et al., 2006; Swets, 1988). The larger the AUC, Kappa, and TSS values, the higher the accuracy of prediction and the better the consistency.
2.4. Division of suitable areas
To quantify the potential suitable areas of A. palmeri in China, the clip function of data management in ArcGIS was used to cut the Chinese result from the predicted potential distribution map, and the reclass function was used to classify the suitable areas. Referring to the division method of Zhao, Cui, et al. (2021) and Zhao, Deng, et al. (2021), we used the natural breaks (Jenks) to divide the prediction results. According to the results of Jenks, we reclassified the potential distribution prediction results of A. palmeri into four categories, unsuitable (0–0.1), low suitable (0.1–0.2), moderate suitable (0.2–0.4), and high suitable (0.4–1).
For further quantitatively comparing the spatial pattern changes in potential suitable habitats (Jian et al., 2022; Ran et al., 2019), we superimposed distribution layers from the current to the 2050s (current‐2050s) and from the 2050s to the 2070s (2050s–2070s). We took 1, 2, 3, and 4 as the codes of the unsuitable, low, moderate, and high suitable areas, respectively. The reclassification results were superimposed and classified using the ArcGIS's raster calculator. The calculation formula is as follows:
| (1) |
represents the code for the overlay layer, represents the code for the first layer, represents the code for the second layer. The description of the overlay code is shown in Table 4. The first and second digits of the overlay code can be considered suitable levels for the first and second layers of the overlay layer.
TABLE 4.
The description of the overlay code
| Overlay code | Description |
|---|---|
| 11 | Unsuitable |
| 22, 33, 44 | Suitable level remained the same |
| 12, 13, 14 | New (unsuitable to suitable) |
| 23, 24, 34 | Suitable level raised |
| 21, 31, 41 | Disappeared (suitable to unsuitable) |
| 32, 42, 43 | Suitable level dropped |
3. RESULTS
3.1. Model accuracy evaluation
As shown in Table 5, the average AUC values of models running on the two sets of environment data were >0.9, and the average Kappa and TSS values were >0.8. That means the two sets of environmental data prediction models have great accuracy and consistency. The standard deviations of Kappa and TSS of WorldClim2.1 were slightly lower than WorldClim1.4, indicating that the model predicted by WorldClim2.1 might have better stability.
TABLE 5.
The values of AUC, Kappa, and TSS
| Category | WorldClim 1.4 | WorldClim 2.1 |
|---|---|---|
| AUC | ||
| Average | 0.9641 | 0.9729 |
| SD | 0.0042 | 0.0042 |
| Kappa | ||
| Average | 0.8090 | 0.8392 |
| SD | 0.0140 | 0.0119 |
| TSS | ||
| Average | 0.8118 | 0.8393 |
| SD | 0.0128 | 0.0124 |
3.2. Dominant environmental variables
For the dominant environmental variables affecting the suitable habitat of A. palmeri, we comprehensively consider the relative contributions of the environmental variables to the models and the results of the jackknife test of variable importance.
Table 6 gives two estimates of relative contributions, including percent contribution and permutation importance. The two estimates of the relative contributions are different because of different calculation methods. Generally, the percent contribution is preferred. According to the results, the percent contribution of annual mean temperature (bio1), mean diurnal range (bio2), temperature seasonality (bio4), and precipitation of coldest quarter (bio19) to the models are all >10%. Their cumulative contribution to WorldClim 1.4 and WorldClim 2.1 is 83.9% and 83.7%, respectively. Overall, the percent contribution of temperature‐related environmental variables is higher than rainfall‐related variables, although the percent contribution in WorldClim 1.4 and WorldClim 2.1 is different.
TABLE 6.
The estimates of relative contributions of the environmental variables
| Variable | WorldClim 1.4 | WorldClim 2.1 | ||
|---|---|---|---|---|
| Percent contribution (%) | Permutation importance (%) | Percent contribution (%) | Permutation importance (%) | |
| bio1 | 41.8 | 40.5 | 48.3 | 57.5 |
| bio2 | 14.1 | 6.6 | 14.6 | 5.7 |
| bio4 | 14.7 | 8.8 | 10.6 | 4.4 |
| bio5 | 0.4 | 1.0 | 1.2 | 0.5 |
| bio8 | 2.5 | 5.1 | 0.9 | 7.8 |
| bio9 | 2.8 | 3.5 | 5.7 | 1.5 |
| bio12 | 1.4 | 5.5 | 1.4 | 5.1 |
| bio13 | 4.3 | 0.1 | 2.8 | 0.0 |
| bio15 | 0.5 | 3.9 | 0.3 | 2.6 |
| bio17 | 2.6 | 4.2 | 1.9 | 2.9 |
| bio19 | 13.3 | 19.5 | 10.2 | 10.7 |
| elev | 1.9 | 1.3 | 2.1 | 1.3 |
Note: The description of environmental variables is shown in Table 1.
As shown in Figure 2, it gives the results of the jackknife test of variable importance. The regularized training gain is used to judge the importance of environmental variables. For WorldClim1.4, the environmental variables with a high gain when used in isolation are the annual mean temperature (bio1), mean diurnal range (bio2), and temperature seasonality (bio4), which therefore appear to have the most useful information by themselves. In addition, the environmental variable that decreases the gain the most when it is omitted is the precipitation of coldest quarter (bio19), which therefore appears to have the most information that is not present in the other variables. Besides, warmest month (bio5) and mean temperature of driest quarter (bio9) also have a high gain when used in isolation. However, the regularized training gain is still at a high level and there is no significant decrease when they are excluded, respectively. These suggest that bio1, bio2, bio4, and bio19 play dominant roles in the growth of A. palmeri, while bio5 and bio9 do not.
FIGURE 2.
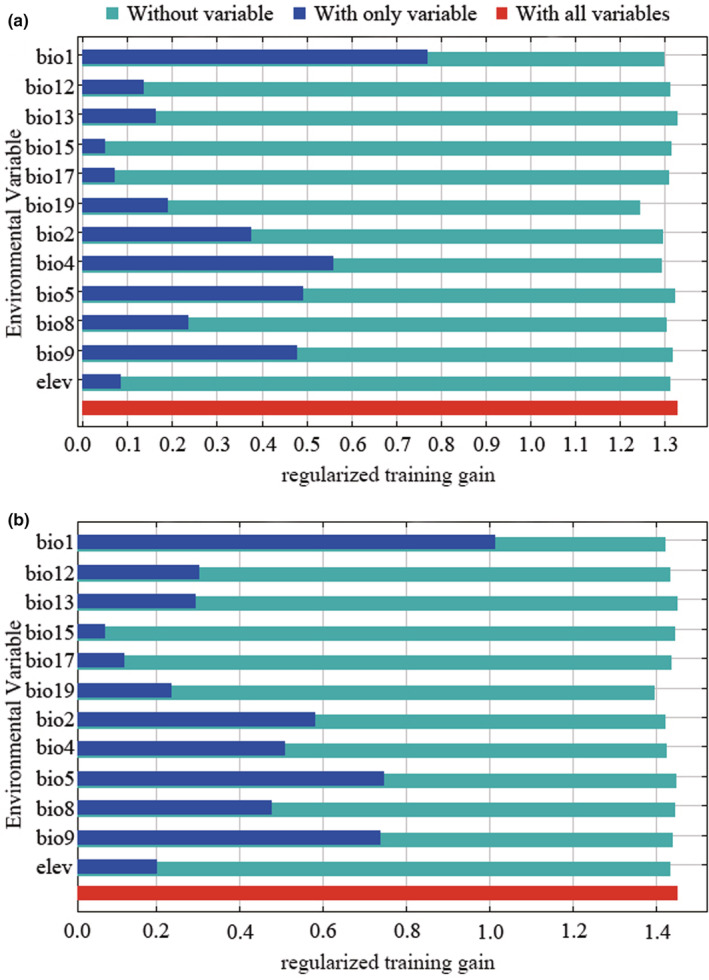
Jackknife of regularized training gain for Amaranthus palmeri. The description of environmental variables is shown in Table 1. (a) is the result of WorldClim 1.4; (b) is the result of WorldClim 2.1.
Similarly, they are also true in WorldClim2.1. However, the regularized training gains in WorldClim 2.1 are generally higher than in WorldClim 1.4. Overall, the regularized training gain of temperature‐related environmental variables is higher than that of rainfall‐related variables, although the results of jackknife tests with variable importance in WorldClim 1.4 and WorldClim 2.1 are different.
In summary, temperature‐related environmental variables have a greater impact on the suitable habitat of A. palmeri than rainfall‐related variables, and the dominant environmental variables affecting the suitable habitat of A. palmeri include annual mean temperature (bio1), mean diurnal range (bio2), temperature seasonality (bio4), and precipitation of coldest quarter (bio19).
3.3. Response to dominant environmental variables
As shown in Figure 3, each curve represents a different model created by using only the corresponding variable. These plots reflect the dependence of predicted suitability on the selected variable and how the predicted probability of presence changes.
FIGURE 3.

Response of Amaranthus palmeri to dominant environmental variables. (a) is the result of WorldClim 1.4; (b) is the result of WorldClim 2.1.
For WorldClim1.4, the presence probability of A. palmeri shows a typical unimodal response curve to annual mean temperature (bio1). It first increases and then decreases with the increase of bio1. When bio1 is about 18°C, the presence probability reaches a peak. In addition, the presence probability increases with the mean diurnal range (bio2) in the limited data range, and it reaches the maximum and tends to be stable when bio2 is about 20°C. However, the speed of rising is unstable. Besides, the presence probability increases first and then decreases with the increase of temperature seasonality (bio4), and reaches the maximum when bio4 is about 75. Moreover, at the range of precipitation of coldest quarter (bio19) is 0–100 mm, the presence probability fluctuates around 0.5, then increases with the increase of bio19 and reaches the maximum when bio19 is about 250 mm then decreases with the increase of bio19.
For WorldClim2.1, the response of the presence probability of A. palmeri to dominant environmental variables is roughly consistent with that in WorldClim 1.4, especially bio1. However, the rising speed of presence probability is more stable with the increase of bio2. In addition, the presence probability increases faster with bio4 when bio4 ranges from 0 to 25, and the peak and the value of bio4 when presence probability reaches the peak are different. Besides, the peak of presence probability is more than 0.6 when bio19 is about 250 mm, and the presence probability eventually decreases to about 0.04 and then tends to be stable.
In summary, the survival probability of A. palmeri is close to the unimodal response curve to bio1, bio4, and bio19, indicating that it increases first and then decreases with their increase. In addition, the survival probability is almost a linear response to bio2 in a limited data range, indicating that it is almost proportional to bio2.
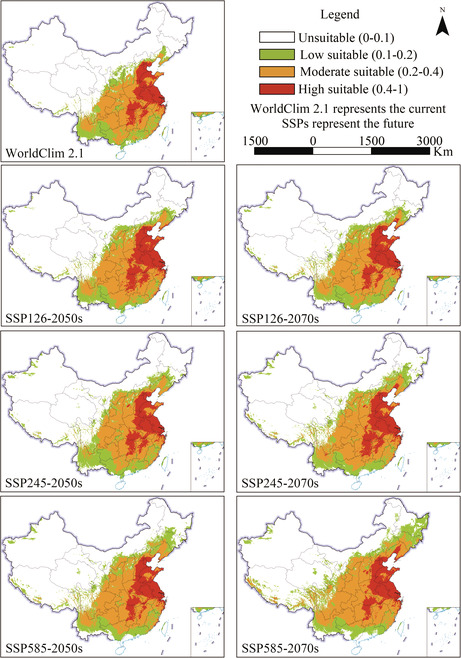
3.4. Potential distribution under current and future climate scenarios
For WorldClim 1.4 and RCPs, the potential distribution of A. palmeri and the area proportion of different suitable habitats are shown in Figures 4 and 5, respectively. At present, the potential suitable area of A. palmeri is widely distributed in the central‐east and parts of southwest China. The high suitable areas are focused on the North China Plain. In addition, the high, moderate, low, and unsuitable areas account for 6.80%, 13.05%, 11.39%, and 68.75% of China's total land area, respectively. In the future, the high suitable habitat will be consistent with the current. However, the potential suitable habitat has an obvious expansion trend to the higher latitude and altitude areas. The total suitable area shows an increasing trend. Although the suitable area will decrease under RCP2.6 from the 2050s to 2070s, the suitable area is still slightly larger than the current. In addition, the potential suitable habitat in coastal and border areas in southwest China will disappear to varying degrees, especially in the future 2070s with high carbon emission scenarios (RCP8.5).
FIGURE 4.

The suitable area of Amaranthus palmeri under WorldClim 1.4 and RCPs.
FIGURE 5.

Percentage of suitable areas under WorldClim 1.4 and RCPs.
For WorldClim 2.1 and SSPs, the potential distribution of A. palmeri and area proportion of different suitable habitats are shown in Figures 6 and 7, respectively. The potential suitable distribution region of A. palmeri is roughly the same as predicted in WorldClim 1.4, but the area proportion of different suitable habitats is different. The high, moderate, low, and unsuitable areas account for 6.98%, 14.96%, 9.46%, and 68.6% of China's total land area, respectively. In the future, the trend of expansion to higher latitudes and altitudes is more significant than that under RCPs. Whether from low to high carbon emissions in the same future period or under the same carbon emission scenario from 2050 to 2070, the total potential suitable area shows an upward trend under SSPs. In addition, the potential suitable habitat in coastal and border areas in southwest China will also disappear to varying degrees, but the loss is smaller than predicted in RCPs.
FIGURE 6.

The suitable area of Amaranthus palmeri under WorldClim 2.1 and SSPs.
FIGURE 7.

Percentage of suitable areas under WorldClim 2.1 and SSPs.
In summary, the current potential suitable area of A. palmeri is widely distributed in the central‐east and parts of southwest China. The high suitable regions are focused on the North China Plain. The total suitable area under WorldClim 1.4 and WorldClim 2.1 is 31.25% and 31.4%, respectively. The suitable area will show an expansion trend in the future, and the expansion under SSPs is greater than that of RCPs.
3.5. Change in the suitable area under future climate scenarios
For WorldClim 1.4 and RCPs, the change in the suitable area of A. palmeri is shown in Figure 8. From the current to the 2050s under RCPs, the suitable area will show a continuous expansion trend with increased carbon emissions. At the same time, it will show a certain loss of suitable area and a decline in the suitable degree in the southwest coastal and border areas. From the 2050s to the 2070s, the suitable areas will shrink in large areas and barely expand under RCP2.6, the expansion and contraction range are all small under RCP4.5, and the range of expansion and contraction is the largest under RCP8.5.
FIGURE 8.

Changes in suitable area of Amaranthus palmeri under WorldClim 1.4 and RCPs. The overlay code description is shown in Table 4.
For WorldClim 2.1 and SSPs, the change in the suitable area of A. palmeri is shown in Figure 9. From the current to the 2050s and from the 2050s to the 2070s, the range of suitable areas expands more widely with the carbon emissions rise. In addition, the contraction changes little under SSPs.
FIGURE 9.

Changes in suitable area of Amaranthus palmeri under WorldClim 2.1 and SSPs. The overlay code description is shown in Table 4.
In summary, the suitable habitats expansion trend of A. palmeri will be greater than the contraction, and the contraction trend of RCPs is more obvious than that of SSPs. Overall, suitable habitats will migrate to high latitudes.
4. DISCUSSION
4.1. Reliability of model predictions
According to the existing distribution information of A. palmeri, its distribution in China is unbalanced, and the data record is incomplete. If only the distribution information in China was used to construct the model, it might not be able to capture all the survival potential (Jiménez‐Valverde et al., 2011). Nevertheless, if only the native data is used to construct the model, it is impossible to explain the niche change of the invaded area (Olivier & Antoine, 2008). Li et al. (2015) pointed out that the ecological niche of American, European and Asian populations of A. palmeri showed different degrees of overlap. The niche occupied by European and Asian populations showed expansion and vacancy compared with the native populations of the Americas. Hence, we used the global distribution data of A. palmeri including the native and invasive areas to obtain the best hypothesis of the potential distribution.
The occurrence degree and sampling factors may cause the data to be concentrated in a geographic space, and redundant data exists while the model runs (Boria et al., 2014). Therefore, our study created the fishnet based on the spatial resolution of the environment layer to filter data. And only one sample point was retained in each grid to ensure no redundant data in the same geographic unit. Additionally, we reduced the dimension of highly correlated environmental variables by multiple collinearity analysis (Jiménez‐Valverde et al., 2011), and selected predictive factors related to the physiological needs of A. palmeri. These all improve the accuracy of the model prediction. According to the result, the AUC, Kappa, and TSS values of the models in our study all reached 0.8. The potential suitable areas of the model predicted can completely cover the distribution points of A. palmeri in China, indicating that the model prediction results were reliable.
4.2. Dominant environmental variables
The key environmental variables related to temperature include annual mean temperature, mean diurnal range, and temperature seasonality. As a C4 plant, the appearance and distribution of A. palmeri are closely related to the high temperature and arid environment (Ehleringer et al., 1997). Amaranthus palmeri is mainly distributed in tropical, subtropical and temperate regions (Xu et al., 2013). Plant growth is closely related to photosynthesis, which usually presents a unimodal response curve to temperature change. Under the condition of sufficient soil moisture, the photosynthesis of A. palmeri first increased and then decreased with the leaf temperature. And ninety percent of the peak photosynthetic rate occurred within 36–46°C (the peak leaf temperature was 42°C). The photosynthetic rate decreased relatively fast on both sides of the optimal leaf temperature range (Ehleringer, 1983). In addition, high temperatures can cause secondary dormancy of seeds and reduce the germination rate (Jha et al., 2010; Steckel et al., 2004). According to field observations, most populations of A. palmeri occur only vegetative growth in the northeastern temperate region with relatively low annual mean temperature (Cao et al., 2020). Therefore, the survival potential of A. palmeri could be limited in areas with relatively high and low annual mean temperatures. The annual mean temperature was also determined as the key factor affecting the suitability of A. palmeri in other model prediction research (Kistner & Hatfield, 2018; Runquist et al., 2019). The result of our study is consistent with the above.
Both mean diurnal range and temperature seasonality represent temperature fluctuations. Amaranthus palmeri emerged in the whole growing season from spring to autumn. Few emerged in the late growth period, and the plants observed after July were <10% (Piskackova et al., 2021). It has been proved that the germination temperature requirements of A. palmeri are different during the 12 months in a year after seed maturation, and the germination ability is significantly affected by temperature seasonally (Jha et al., 2010). All of these indicate that A. palmeri is affected by seasonal temperature fluctuations. According to previous studies, the germination rate of A. palmeri seeds increased under alternating temperatures compared with constant temperature (Ji et al., 2021; Steckel et al., 2004). When the alternating temperature is at 5°C, the germination rate is only 8%, and with the increase of alternating temperatures, the germination rate is also increasing (Steckel et al., 2004). In another study, the germination rate reached 99.7% at 35°C/15°C in half a month (Ji et al., 2021). In our study, the survival probability of A. palmeri showed a linear response in the limited range of mean diurnal range, which was consistent with the results of previous studies. The changes of survival probability with temperature fluctuation further proved that the annual mean temperature played an important role in the survival potential of A. palmeri.
Only precipitation of coldest quarter is the important environmental variable associated with rainfall. Rainfall in a particular season seems to be an important factor in plant invasion (Bradley et al., 2009). Amaranthus palmeri is an opportunist, which can germinate rapidly in response to water availability in arid environments (Ehleringer, 1983). Studies have shown that A. palmeri increased sharply within 1 month of emergence, indicating a rapid rise under favorable conditions (Piskackova et al., 2021). The precipitation of the coldest quarter directly affects soil moisture accumulation before germination. It can be seen from the response curve that when the precipitation of coldest quarter was relatively low, the survival probability showed a rapid increase trend, which indicated the rapid response to water. In addition, the growth, reproduction, and seed germination of A. palmeri under no water stress were better than those under water stress (Chahal et al., 2018), which further indicated that the survival probability increased under sufficient water. However, the seed germination rate was significantly reduced under severe flooding conditions, and the presence of fungi resulted in seed rot and decreased seed vigor (Franca et al., 2020). The result in our study was consistent with the previous research results. It is worth noting that the survival probability is relatively high within 500 mm of precipitation of coldest quarter, and the coldest‐season rainfall in China is within this range except in Taiwan Province. According to literature and reports, A. palmeri can grow in a variety of habitats with large differences in soil moisture such as farmland, roadside, riverside, and desert (Li, 2003). These indicate that rainfall has little contribution to distribution, but has some influence on growth. Hence, it may be that the relative resistance to waterlogging and drought of A. palmeri leads to the contribution of rainfall factors.
4.3. Potential distribution and migration
The joint action of different dominant environments restricts the potential distribution of A. palmeri in China. The potential distribution area mainly belongs to subtropical and temperate monsoon climate with an annual mean temperature at 8–22°C and has a certain temperature fluctuation. Although distributed in tropical monsoon climate regions, the distribution area is small and has a low survival probability. Because the appearance of A. palmeri is proportional to temperature and inversely proportional to rainfall within a certain range (Ehleringer et al., 1997), these areas have frequent rainfall, small temperature fluctuations, and high temperatures throughout the year with an annual mean temperature above 22°C.
The prediction results of SDMs vary with occurrence data, environmental variables, prediction methods and classification methods (Iverson et al., 2017; Zhang et al., 2011). For further comparison with the results of other studies, the coincidence degree comparison was carried out by overlapping the color blocks of different suitable levels in the prediction maps of different research results based on the number of pixels in PS version 2022. When comparing WorldClim 1.4 and WorldClim 2.1 with Li et al. (2015), the coincidence degree of the suitable area reached 98.14% and 97.64%, and the highly suitable area reached 50.16% and 48.54%, respectively. However, the color blocks in the contrast area cannot be accurately selected in extracting color blocks because the color distinction of Li et al. (2015) is not obvious enough. Therefore, there was a certain deviation in the comparison results of the coincidence degree in the high suitable area. Nevertheless, from the prediction results, our study is consistent with the range of suitable areas predicted by Li et al. (2015) and Xu et al. (2013).
The temperature and rainfall changes in coastal and border areas in southwest China will intensify, especially the annual mean temperature will rise. Climate change will further restrict the occurrence of A. palmeri in these areas, leading to the loss of suitable habitats in cases of low suitability. In addition, global warming in the future will increase in accumulated temperature, thereby extending the growth period of A. palmeri in high latitudes. And the climatic suitability in the northern hemisphere will improve (Kistner & Hatfield, 2018). In this study, the expansion of A. palmeri to high latitude is consistent with the above. The correlation between phenotypic variation and temperature in different latitude populations of A. palmeri shows strong climate adaptability (Cao et al., 2020). The combined effects of climate change and high plasticity will contribute to the invasion and have a broader niche (Cao et al., 2020; Korres & Norsworthy, 2017).
Furthermore, global warming leads to changes in limiting factors for plant invasion in the mountain ecosystem, such as increased plant growth seasons by increasing temperature, reduced frequency and duration of frost and snow, and so on (Chen et al., 2011). These may weaken the abiotic resistance of most mountain ecosystems to plant invasion. There are signs that alien species are expanding upward, and more than 1000 alien species have been naturalized in global high‐altitude ecosystems (Pauchard et al., 2009). These indicate that climate changes will promote the invasion of alien plants to high‐altitude areas in the future. In our study, A. palmeri will expand to high‐altitude areas, especially in high carbon emission scenarios.
Invasive plants are usually more adaptable to the new environment than local plants (Bradley et al., 2009). The increased carbon dioxide concentration in the atmosphere has a direct “fertilization” effect on plants, and changes in temperature and precipitation can also create new environments (Bradley et al., 2009). These will benefit the invasive plants. On the other hand, reduced photosynthetic rates and energy limits at lower temperatures may limit the potential range of A. palmeri, or at least affect its competitiveness with other plants (Ward et al., 2013). Among our predictions under future climate scenarios, the lowest temperature rise is under RCP2.6 (Shen & Wang, 2013), limiting the global average temperature rise to 2°C by 2100. In our study, the increase of suitable area under RCPs is less than that under SSPs, and the minimum increase under RCP2.6. Therefore, we consider that low‐carbon emissions may be an important factor restricting the suitable habitat. Compared with the SSPs, the contraction trend of RCPs is more obvious. This may be because the future climate scenarios SSPs consider socio‐economic development factors so that SSPs have substantially higher CO2 emissions than RCPs, with correspondingly larger cuts in non‐CO2 emissions. Therefore, the prediction of the potential distribution of A. palmeri under SSPs is more stable than that under RCPs. However, the important environmental variables that cause the migration remain to be further studied.
4.4. Research significance and prospect
Climate change and biological invasion have directly affected biodiversity and food security. Many observations show that climate change significantly impacts biodiversity by affecting the frequency and extent of pests and diseases, the phenology, biotic interactions, distribution, and abundance of species (Habibullah et al., 2022; Wu et al., 2009). Climate change and extreme weather events, such as low or high temperature stress, changes in rainfall patterns, rainstorms, and droughts, not only threaten crop productivity through biological structures such as affecting crop cycles, pest invasions, but also cause difficulties in agricultural activities (Farooq et al., 2022; Zhou et al., 2013). In addition, the increased carbon dioxide promotes weed growth and reduces herbicide efficacy, leading to increased competition between weeds and crops (Ziska et al., 2004, 2011). The confluence of climate change and biological invasion may profoundly impact biodiversity and agricultural production.
Physiological plasticity, varied tolerance ranges, phenotypic plasticity, and high fecundity and transmission capacity may make invasive alien plants easy to cope with global change (Bradley et al., 2009; Qin et al., 2018). However, types of research prove that some components of global change may promote or hinder species invasion. For example, global warming may increase the speed of diffusion and growth of organisms controlled by temperature (Walther et al., 2009). The photosynthetic rate of Mikania micrantha, Wedelia trilobata, and Ipomoea cairica increased by 67.1% on average when they were exposed to elevated CO2 concentrations. And the elevated CO2 also led to significant changes in biomass allocation and morphology of M. micrantha and W. trilobata (Song et al., 2009). Elevated CO2 and warming had antagonistic effects on the population growth of Hypochaeris radicata and Leontodon taraxacoides (Williams et al., 2007). In addition, non‐local plant invasion promotes greenhouse gas emissions, thereby accelerating global climate change (Beyene et al., 2022). Species invasion is related to the synergy of the species characteristics and global change. It is necessary to prepare for the expansion and contraction of invasive species.
Amaranthus palmeri was first discovered in China near a railway line dedicated to cooking oil factories in Beijing (Li, 2003). It usually occurs with crop growth, so it is likely to mix with crop harvest and spread with grain transportation. According to the statistical analysis of port interception in China, the seeds of A. palmeri were most frequently intercepted from soybean goods originating in the United States and Brazil (Yang et al., 2015). Therefore, A. palmeri may be imported into China with imported oil soybeans and other agricultural products. In recent years, A. palmeri has been colonized in many provinces across low‐latitude tropical regions and high‐latitude temperate regions in China, especially in the Beijing‐Tianjin‐Hebei region. Other areas with distribution have relatively few records. According to the distribution of A. palmeri in China and the diffusion models in the distribution area of invasive species proposed by Shigesada and Kawasaki (1997), it can be judged that A. palmeri is spreading in both short and long distances. Nowadays, the increasing frequency of human activities and the rapid development of transportation and logistics greatly increase the risk of species spreading along specific vectors such as transportation (Horvitz et al., 2017). However, it is necessary to verify further the correlation between the distribution of A. palmeri and the road to determine whether a road is the main way of its long‐distance dispersal.
On the one hand, as a C4 plant, A. palmeri has the characteristics of high carbon dioxide utilization and low water requirement for growth, which has certain advantages in dealing with the increase of atmospheric carbon dioxide and more frequent and severe drought (Ward et al., 1999). On the other hand, changes in temperature and precipitation can create a new environment (Bradley et al., 2009). Some traits of invasive species will make them adapt to the new environment faster and better than native species (Engel et al., 2011). Studies have shown that A. palmeri can adapt to different environmental conditions by adjusting its phenotypic traits or genetic variations (Cao et al., 2020; Korres & Norsworthy, 2017), which plays an important role in its colonization and invasion of new environments under climate change. It has been found that most of A. palmeri were vegetative growth in the northeast temperate zone of China with low annual mean temperature (Cao et al., 2020). With the development of global warming, it may improve the climate suitability of A. palmeri in the high latitudes of the northern hemisphere to promote reproductive growth.
The current and future potential suitable areas of A. palmeri in China are consistent with the production areas of soybean, corn and other crops. Early germination behavior and rapid growth characteristics can promote biomass accumulation and lead to the successful establishment of A. palmeri in the agricultural field (Ehleringer, 1983; Piskackova et al., 2021; Steckel et al., 2004). And it cannot be effectively controlled for a long time due to the evolved herbicide resistance of A. palmeri (Ward et al., 2013). Although A. palmeri has been recorded in many provinces of China, its invasion potential has not been fully exploited. Early monitoring and warning and active rapid responses are important means to prevent the introduction from foreign countries and further spread in China. In this study, the dominant environmental variables affecting the suitability habitat of A. palmeri were determined and the potentially suitable areas in China under current and future climate scenarios were predicted, which is beneficial to the accurate policy and effective management of the continuous invasion and future spread.
However, our study still has many deficiencies. Firstly, species distribution is subject to interactions between biological and abiotic factors (Boivin et al., 2016; Gama et al., 2015; Lewis et al., 2017). Our study mainly considered the influence of climate on the distribution of A. palmeri. The invasion potential of species, the interaction between organisms, soil conditions, and land use play an important role in the distribution of invasive plants (Hong et al., 2021; Manzoor et al., 2021; Potter & Bowman, 2020). In addition, transportation construction, trade activities, and water conservancy projects are extremely important for spreading invasive species (Adhikari et al., 2021; Horvitz et al., 2017; Liu et al., 2017). Therefore, a realistic risk assessment must integrate ecology, geography, climate science and economic development (Bradley et al., 2009). Secondly, the prediction results of models will be affected due to different global climate models and carbon emission scenarios (Jiang et al., 2022). Different regions have different carbon emission conditions and emission reduction policies, so the prediction of species distribution under future climate change should be combined with the actual emission targets and trends (Gütschow et al., 2021). Thirdly, the model itself is an uncertain factor, and there is no general standard for algorithm selection when modeling the geographical distribution of species (Silva et al., 2021; Zhao, Cui, et al., 2021). Different models have different preferences due to the different operating principles. Biomod2 package enables weighted integration of multiple models. Thus, it is increasingly used to predict the potential distribution of species (Fang et al., 2020; Pacifici et al., 2019). In further research, it is necessary to carry out a field survey of risk areas in time and use updated data combined with more variables to conduct further regional scale analysis based on the ensemble model. And combined with China's carbon emissions policy, make it more in line with China's actual situation forecast.
5. CONCLUSION
In this study, the MaxEnt model was used to analyze the dominant environmental variables affecting the suitability habitat of A. palmeri and predict its potential distribution in China under current and future climate scenarios. Our research shows that temperature‐related environmental variables have a greater impact on the suitable habitat of A. palmeri than rainfall‐related variables. At present, the potential distribution of A. palmeri is widely distributed in the central‐east and parts of southwest China. The highly suitable areas are focused on the North China Plain. In the future, the suitable habitat will expand significantly to higher latitudes and altitudes in response to global warming. Therefore, it is necessary to establish early monitoring and warning, rapid response, and real‐time control systems to prevent further spread and outbreaks.
AUTHOR CONTRIBUTIONS
Xinyi Zhang: Data curation (lead); formal analysis (lead); methodology (lead); visualization (lead); writing – original draft (lead); writing – review and editing (equal). Jian Zhao: Conceptualization (lead); funding acquisition (lead); project administration (lead); supervision (supporting); writing – review and editing (equal). Miaomiao Wang: Supervision (supporting); writing – review and editing (equal). Zhipeng Li: Funding acquisition (equal); project administration (equal); supervision (supporting); writing – review and editing (supporting). Sheng Lin: Supervision (supporting); writing – review and editing (supporting). Hong Chen: Supervision (supporting); writing – review and editing (supporting).
CONFLICT OF INTEREST
The authors declare that they have no conflict of interest.
ACKNOWLEDGMENTS
Thanks for the support of the National Key Research and Development Program of China (2021YFC2600403), the General Project of Fujian Natural Science Foundation (2020J011376), Collaborative Innovation Project of High‐Quality Development of Agriculture in Fujian Province (XTCXGC2021015), and Fujian Intelligent Agricultural Science and Technology Innovation Team (CXTD2021013‐1).
Zhang, X. , Zhao, J. , Wang, M. , Li, Z. , Lin, S. , & Chen, H. (2022). Potential distribution prediction of Amaranthus palmeri S. Watson in China under current and future climate scenarios. Ecology and Evolution, 12, e9505. 10.1002/ece3.9505
DATA AVAILABILITY STATEMENT
Datasets used in this study are available online in Dryad at https://doi.org/10.5061/dryad.zpc866tc4.
REFERENCES
- Adhikari, P. , Lee, Y.‐H. , Park, Y.‐S. , & Hong, S.‐H. (2021). Assessment of the spatial invasion risk of intentionally introduced alien plant species (IIAPS) under environmental change in South Korea. Biology, 10, 1169. 10.3390/biology10111169 [DOI] [PMC free article] [PubMed] [Google Scholar]
- Allouche, O. , Tsoar, A. , & Kadmon, R. (2006). Assessing the accuracy of species distribution models: Prevalence, kappa and the true skill statistic (TSS). Journal of Applied Ecology, 43(6), 1223–1232. 10.1111/j.1365-2664.2006.01214.x [DOI] [Google Scholar]
- Azrag, A. G. A. , Pirk, C. W. W. , Yusuf, A. A. , Pinard, F. , Niassy, S. , Mosomtai, G. , Babin, R. , & Mankin, R. (2018). Prediction of insect pest distribution as influenced by elevation: Combining field observations and temperature‐dependent development models for the coffee stink bug, Antestiopsis thunbergii (Gmelin). PLoS One, 13(6), e0199569. 10.1371/journal.pone.0199569 [DOI] [PMC free article] [PubMed] [Google Scholar]
- Beyene, B. B. , Li, J. , Yuan, J. , Dong, Y. , Liu, D. , Chen, Z. , Kim, J. , Kang, H. , Freeman, C. , & Ding, W. (2022). Non‐native plant invasion can accelerate global climate change by increasing wetland methane and terrestrial nitrous oxide emissions. Global Change Biology, 28, 5453–5468. 10.1111/gcb.16290 [DOI] [PubMed] [Google Scholar]
- Boivin, N. L. , Zeder, M. A. , Fuller, D. Q. , Crowtherf, A. , Larsong, G. , Erlandson, J. M. , Denham, T. , & Petraglia, M. D. (2016). Ecological consequences of human niche construction: Examining long‐term anthropogenic shaping of global species distributions. Proceedings of the National Academy of Sciences of the United States of America, 113(23), 6388–6396. 10.1073/pnas.1525200113 [DOI] [PMC free article] [PubMed] [Google Scholar]
- Boria, R. A. , Olson, L. E. , Goodman, S. M. , & Anderson, R. P. (2014). Spatial filtering to reduce sampling bias can improve the performance of ecological niche models. Ecological Modelling, 275, 73–77. 10.1016/j.ecolmodel.2013.12.012 [DOI] [Google Scholar]
- Bradley, B. A. , Blumenthal, D. M. , Wilcove, D. S. , & Ziska, L. H. (2009). Predicting plant invasions in an era of global change. Trends in Ecology & Evolution, 25(5), 310–318. 10.1016/j.tree.2009.12.003 [DOI] [PubMed] [Google Scholar]
- Cao, J. , Wang, R. , Li, Y. , Zhang, G. , Guo, J. , & Wan, F. (2020). The phenotypic variation and environmental adaptability among different geographical populations of Amaranthus palmeri in China. Plant Quarantine, 34(3), 25–31. 10.19662/j.cnki.issn1005-2755.2020.00.007 [DOI] [Google Scholar]
- Chahal, P. S. , Irmak, S. , Jugulam, M. , & Jhala, A. J. (2018). Evaluating effect of degree of water stress on growth and fecundity of Palmer amaranth (Amaranthus palmeri) using soil moisture sensors. Weed Science, 66(6), 738–745. [Google Scholar]
- Chen, J. , Yang, Y. , & Sun, H. (2011). Advances in the studies of responses of alpine plants to global warming. Chinese Journal of Applied & Environmental Biology, 17(3), 435–446. [Google Scholar]
- Cohen, J. (1960). A coefficient of agreement for nominal scales. Educational and Psychological Measurement, 20(1), 37–46. 10.1177/001316446002000104 [DOI] [Google Scholar]
- Davis, A. S. , Schutte, B. J. , Hager, A. G. , & Young, B. G. (2015). Palmer amaranth (Amaranthus palmeri) damage niche in Illinois soybean is seed limited. Weed Science, 63(3), 658–668. 10.1614/WS-D-14-00177.1 [DOI] [Google Scholar]
- Diagne, C. , Leroy, B. , Vaissière, A. C. , Gozlan, R. E. , Roiz, D. , Jarić, I. , Salles, J. M. , Bradshaw, C. J. A. , & Courchamp, F. (2021). High and rising economic costs of biological invasions worldwide. Nature, 592(7855), 571–576. 10.1038/S41586-021-03405-6 [DOI] [PubMed] [Google Scholar]
- Ehleringer, J. (1983). Ecophysiology of Amaranthus palmeri, a sonoran desert summer annual. Oecologia, 57(1–2), 107–112. 10.1007/BF00379568 [DOI] [PubMed] [Google Scholar]
- Ehleringer, J. R. , Cerling, T. E. , & Helliker, B. R. (1997). C4 photosynthesis, atmospheric CO2, and climate. Oecologia, 112, 285–299. 10.1007/s004420050311 [DOI] [PubMed] [Google Scholar]
- Engel, K. , Tollrian, R. , & Jeschke, J. M. (2011). Integrating biological invasions, climate change and phenotypic plasticity. Communicative & Integrative Biology, 4(3), 247–250. 10.4161/cib.4.3.14885 [DOI] [PMC free article] [PubMed] [Google Scholar]
- Fang, Y. , Zhang, X. , Wei, H. , Wang, D. , Chen, R. , Wang, L. , & Gu, W. (2020). Predicting the invasive trend of exotic plants in China based on the ensemble model under climate change: A case for three invasive plants of Asteraceae . Science of the Total Environment, 756, 143841. 10.1016/J.SCITOTENV.2020.143841 [DOI] [PubMed] [Google Scholar]
- Farooq, M. S. , Uzair, M. , Raza, A. , Habib, M. , Xu, Y. , Yousuf, M. , Yang, S. H. , & Khan, M. R. (2022). Uncovering the research gaps to alleviate the negative impacts of climate change on food security: A review. Frontiers in Plant Science, 13, 927535. 10.3389/FPLS.2022.927535 [DOI] [PMC free article] [PubMed] [Google Scholar]
- Franca, L. X. , Dodds, D. M. , Reynolds, D. B. , Bond, J. A. , Mills, J. A. , Catchot, A. L. , & Peterson, D. G. (2020). Influence of flooding period and seed burial depth on Palmer amaranth (Amaranthus palmeri) seed germination. Pest Management Science, 76(11), 3832–3837. 10.1002/ps.5934 [DOI] [PubMed] [Google Scholar]
- Gama, M. , Crespo, D. , Dolbeth, M. , & Anastácio, P. (2015). Predicting global habitat suitability for Corbicula fluminea using species distribution models: The importance of different environmental datasets. Ecological Modelling, 319, 163–169. 10.1016/j.ecolmodel.2015.06.001 [DOI] [Google Scholar]
- Gütschow, J. , Jeffery, M. L. , Günther, A. , & Meinshausen, M. (2021). Country‐resolved combined emission and socio‐economic pathways based on the representative concentration pathway (RCP) and shared socio‐economic pathway (SSP) scenarios. Earth System Science Data, 13(3), 1005–1040. 10.5194/essd-13-1005-2021 [DOI] [Google Scholar]
- Habibullah, M. S. , Din, B. H. , Tan, S.‐H. , & Zahid, H. (2022). Impact of climate change on biodiversity loss: Global evidence. Environmental Science and Pollution Research, 29, 1073–1086. 10.1007/s11356-021-15702-8 [DOI] [PubMed] [Google Scholar]
- Hanley, J. A. , & McNeil, B. J. (1982). The meaning and use of the area under a receiver operating characteristic (ROC) curve. Radiology, 143(1), 29–36. 10.1148/radiology.143.1.7063747 [DOI] [PubMed] [Google Scholar]
- Heap, I. (2022). The international survey of herbicide resistant weeds . Retrieved May 19, 2022, from www.weedscience.org
- Hong, S. H. , Lee, Y. H. , Lee, G. , Lee, D.‐H. , & Adhikari, P. (2021). Predicting impacts of climate change on northward range expansion of invasive weeds in South Korea. Plants, 10, 1604. 10.3390/plants10081604 [DOI] [PMC free article] [PubMed] [Google Scholar]
- Hortal, J. , Roura‐Pascual, N. , Sanders, N. J. , & Rahbek, C. (2010). Understanding (insect) species distributions across spatial scales. Ecography, 33(1), 51–53. 10.1111/j.1600-0587.2009.06428.x [DOI] [Google Scholar]
- Horvitz, N. , Wang, R. , Wan, F. , & Nathan, R. (2017). Pervasive human‐mediated large‐scale invasion: Analysis of spread patterns and their underlying mechanisms in 17 of China's worst invasive plants. Journal of Ecology, 105(1), 85–94. 10.1111/1365-2745.12692 [DOI] [Google Scholar]
- Iverson, L. R. , Thompson, F. R. , Matthews, S. , Peters, M. , Prasad, A. , Dijak, W. D. , Fraser, J. , Wang, W. , Hanberry, B. , He, H. , Janowiak, M. , Butler, P. , Brandt, L. , & Swanston, C. (2017). Multi‐model comparison on the effects of climate change on tree species in the eastern U.S.: Results from an enhanced niche model and process‐based ecosystem and landscape models. Landscape Ecology, 32(7), 1327–1346. 10.1007/s10980-016-0404-8 [DOI] [Google Scholar]
- Jha, P. , Norsworthy, J. K. , Riley, M. B. , & Bridges, W. (2010). Annual changes in temperature and light requirements for germination of Palmer amaranth (Amaranthus palmeri) seeds retrieved from soil. Weed Science, 58(4), 426–432. 10.1614/WS-D-09-00038.1 [DOI] [Google Scholar]
- Ji, M. , Cui, H. , Chen, J. , Yu, H. , Zhang, J. , & Li, X. (2021). Influence factors on seed germination of Amaranthus palmeri . Journal of Weed Science, 39(3), 8–14. 10.19588/j.issn.1003-935X.2021.03.002 [DOI] [Google Scholar]
- Ji, M. , Huang, Z. , Cui, H. , Chen, J. , Yu, H. , & Li, X. (2022). Target‐site mutation in the ALS gene endowing imazethapyr resistance in invasive weed Amaranthus palmeri in China. Plant Protection, 48(1), 173–178. 10.16688/j.zwbh.2020639 [DOI] [Google Scholar]
- Ji, M. , Huang, Z. , Cui, H. , Yu, H. , Zhang, J. , & Li, X. (2020). A new imazethapyr ‐ Resistant population of Amaranthus palmeri . Journal of Weed Science, 38(3), 23–27. 10.19588/j.issn.1003-935X.2020.03.005 [DOI] [Google Scholar]
- Jian, S. , Zhu, T. , Wang, J. , & Yan, D. (2022). The current and future potential geographical distribution and evolution process of Catalpa bungei in China. Forests, 13(1), 96. 10.3390/f13010096 [DOI] [Google Scholar]
- Jiang, T. , Wang, B. , Xu, X. , Cao, Y. , Liu, D. , He, L. , Jin, N. , Ma, H. , Chen, S. , Zhao, K. , Feng, H. , Yu, Q. , He, Y. , & He, J. (2022). Identifying sources of uncertainty in wheat production projections with consideration of crop climatic suitability under future climate. Agricultural and Forest Meteorology, 319, 108933. 10.1016/j.agrformet.2022.108933 [DOI] [Google Scholar]
- Jiménez‐Valverde, A. , Peterson, A. T. , Soberón, J. , Overton, J. M. , Aragón, P. , & Lobo, J. M. (2011). Use of niche models in invasive species risk assessments. Biological Invasions, 13(12), 2785–2797. 10.1007/s10530-011-9963-4 [DOI] [Google Scholar]
- Kaspary, T. E. , García, M. A. , & Bellé, C. (2021). The weed Amaranthus palmeri is a host of Meloidogyne incognita in Uruguay. Rhizosphere, 19, 100400. 10.1016/J.RHISPH.2021.100400 [DOI] [Google Scholar]
- Kistner, E. J. , & Hatfield, J. L. (2018). Potential geographic distribution of Palmer amaranth under current and future climates. Agricultural & Environmental Letters, 3(1), 1–5. 10.2134/ael2017.12.0044 [DOI] [Google Scholar]
- Korres, N. E. , & Norsworthy, J. K. (2017). Palmer amaranth (Amaranthus palmeri) demographic and biological characteristics in wide‐row soybean. Weed Science, 65(4), 491–503. 10.1017/wsc.2017.12 [DOI] [Google Scholar]
- Lantz, C. A. , & Nebenzahl, E. (1996). Behavior and interpretation of factors affecting the performance of climatic envelope models. Journal of Clinical Epidemiology, 49, 431–434. 10.1016/0895-4356(95)00571-4 [DOI] [PubMed] [Google Scholar]
- Lewis, J. S. , Farnsworth, M. L. , Burdett, C. L. , Theobald, D. M. , Gray, M. , & Miller, R. S. (2017). Biotic and abiotic factors predicting the global distribution and population density of an invasive large mammal. Scientific Reports, 7(1), 44152. 10.1038/srep44152 [DOI] [PMC free article] [PubMed] [Google Scholar]
- Li, H. , Zhao, L. , Zhu, P. , Zhang, Y. , Zhu, G. , & Liu, Q. (2015). Potential distribution of invasive Palmer amaranth in China (Amaranthus palmeri). Journal of Tianjin Normal University (Natural Science Edition), 35(4), 57–61. 10.3969/j.issn.1671-1114.2015.04.013 [DOI] [Google Scholar]
- Li, X. , Wei, C. , Pan, Y. , & Tang, S. (2017). Three new records of naturalized plants in Guangxi and analyses on their invasiveness. Guihaia, 37(6), 806–810. [Google Scholar]
- Li, Y. , Cao, J. , Wang, R. , Huang, Y. , & Chen, H. (2021). Risk assessment based on analytic hierarchy process of an invasive alien weed, Amaranthus palmeri, in northern Henan province. Plant Quarantine, 35(5), 60–65. 10.19662/j.cnki.issn1005-2755.2021.05.006 [DOI] [Google Scholar]
- Li, Y. , Mo, X. , Li, Q. , Liang, C. , Liu, S. , Zhang, Y. , & Zhang, Z. (2021). Effects of an invasive plant Palmer amaranth (Amaranthus palmeri) on herb communities. IOP Conference Series: Earth and Environmental Science, 791(1), 012202. 10.1088/1755-1315/791/1/012202 [DOI] [Google Scholar]
- Li, Z. (2003). Amaranthus palmeri S. Watson, a newly naturalized species in China. Chinese Bulletin of Botany, 20(6), 734–735. 10.1023/A:1022289509702 [DOI] [Google Scholar]
- Liu, D. , Wang, R. , Gordon, D. R. , Sun, X. , Chen, L. , & Wang, Y. (2017). Predicting plant invasions following China's water diversion project. Environmental Science & Technology, 51(3), 1450–1457. 10.1021/acs.est.6b05577 [DOI] [PubMed] [Google Scholar]
- Lobo, J. M. , Jiménez‐Valverde, A. , & Real, R. (2008). AUC: A misleading measure of the performance of predictive distribution models. Global Ecology and Biogeography, 17, 145–151. 10.1111/j.1466-8238.2007.00358.x [DOI] [Google Scholar]
- Lv, Y. , Fu, L. , Zhang, J. , Bian, Y. , & Liu, R. (2015). Distribution and risk assessment of Amaranthus invasive plants in Beijing. Journal of Beijing University of Agriculture, 30(2), 20–23. 10.13473/j.cnki.issn.1002-3186.2015.0013 [DOI] [Google Scholar]
- Ma, D. , Lun, X. , Li, C. , Zhou, R. , Zhao, Z. , Wang, J. , Zhang, Q. , & Liu, Q. (2021). Predicting the potential global distribution of Amblyomma americanum (Acari: Ixodidae) under near current and future climatic conditions, using the maximum entropy model. Biology, 10(10), 1057. 10.3390/biology10101057 [DOI] [PMC free article] [PubMed] [Google Scholar]
- Manzoor, S. A. , Griffiths, G. , & Lukac, M. (2021). Land use and climate change interaction triggers contrasting trajectories of biological invasion. Ecological Indicators, 120, 106936. 10.1016/j.ecolind.2020.106936 [DOI] [Google Scholar]
- Marchioro, C. A. , & Krechemer, F. S. (2021). Prevention is better than cure: Integrating habitat suitability and invasion threat to assess global biological invasion risk by insect pests under climate change. Pest Management Science, 77(10), 4510–4520. 10.1002/ps.6486 [DOI] [PubMed] [Google Scholar]
- Maxwel, C. O. , Giacomini, D. A. , Arsenijevic, N. , Vieira, G. , Tranel, P. J. , & Werle, R. (2020). Distribution and validation of genotypic and phenotypic glyphosate and PPO‐inhibitor resistance in Palmer amaranth (Amaranthus palmeri) from southwest Nebraska. Weed Technology, 35(1), 65–76. 10.1017/wet.2020.74 [DOI] [Google Scholar]
- McDonald, A. , Riha, S. , DiTommaso, A. , & DeGaetano, A. (2009). Climate change and the geography of weed damage: Analysis of US maize systems suggests the potential for significant range transformations. Agriculture, Ecosystems & Environment, 130(3), 131–140. 10.1016/j.agee.2008.12.007 [DOI] [Google Scholar]
- McGeoch, M. A. , Butchart, S. H. M. , Spear, D. , Marais, E. , Kleynhans, E. J. , Symes, A. , Chanson, J. , & Hoffmann, M. (2010). Global indicators of biological invasion: Species numbers, biodiversity impact and policy responses. Diversity and Distributions, 16(1), 95–108. 10.1111/j.1472-4642.2009.00633.x [DOI] [Google Scholar]
- Menges, R. M. (1987). Allelopathic effects of Palmer amaranth (Amaranthus palmeri) and other plant residues in soil. Weed Science, 35(3), 339–347. 10.1017/S0043174500053790 [DOI] [Google Scholar]
- Merow, C. , Smith, M. J. , & Silander, J. A. (2013). A practical guide to MaxEnt for modeling species' distributions: What it does, and why inputs and settings matter. Ecography, 36(10), 1058–1069. 10.1111/j.1600-0587.2013.07872.x [DOI] [Google Scholar]
- Mesgaran, M. B. , Matzrafi, M. , & Ohadi, S. (2021). Sex dimorphism in dioecious Palmer amaranth (Amaranthus palmeri) in response to water stress. Planta, 254, 17. 10.1007/S00425-021-03664-7 [DOI] [PMC free article] [PubMed] [Google Scholar]
- Meyer, C. J. , Peter, F. , Norsworthy, J. K. , & Beffa, R. (2020). Uptake, translocation, and metabolism of glyphosate, glufosinate, and dicamba mixtures in Echinochloa crus‐galli and Amaranthus palmeri . Pest Management Science, 76(9), 3078–3087. 10.1002/ps.5859 [DOI] [PubMed] [Google Scholar]
- Mitchell, C. E. , Agrawal, A. A. , Bever, J. D. , Golbert, G. S. , Hufbauer, R. A. , Klironomos, J. N. , Maron, J. L. , Morris, W. F. , Paeker, I. M. , Power, A. G. , Seabloom, E. W. , Torchin, M. E. , & Vázquez, D. P. (2006). Biotic interactions and plant invasions. Ecology Letters, 9(6), 726–740. 10.1111/j.1461-0248.2006.00908.x [DOI] [PubMed] [Google Scholar]
- Mo, X. , Meng, W. , & Li, H. (2017). New distribution records of three species of exotic plants in Tianjin: Amaranthus palmeri, Ipomoea lacunosa and Aster subulatus . Journal of Tianjin Normal University (Natural Science Edition), 37(2), 36–38, 56. [Google Scholar]
- Molin, W. T. , Nandula, V. K. , Wright, A. A. , & Bond, J. A. (2016). Transfer and expression of ALS inhibitor resistance from Palmer amaranth (Amaranthus palmeri) to an A. spinosus × A. palmeri hybrid. Weed Science, 64(2), 240–247. 10.1614/WS-D-15-00172.1 [DOI] [Google Scholar]
- Olivier, B. , & Antoine, G. (2008). Predicting current and future biological invasions: Both native and invaded ranges matter. Biology Letters, 4(5), 585–589. 10.1098/rsbl.2008.0254 [DOI] [PMC free article] [PubMed] [Google Scholar]
- Pacifici, K. , Reich, B. J. , Miller, D. A. W. , & Pease, B. S. (2019). Resolving misaligned spatial data with integrated species distribution models. Ecology, 100(6), e02709. 10.1002/ecy.2709 [DOI] [PMC free article] [PubMed] [Google Scholar]
- Pauchard, A. , Kueffer, C. , Dietz, H. , Daehler, C. C. , Alexander, J. , Edwards, P. J. , Arévalo, J. R. , Cavieres, L. A. , Guisan, A. , Haider, S. , Jakobs, G. , McDougall, K. , Millar, C. I. , Naylor, B. J. , Parks, C. G. , Rew, L. J. , & Seipel, T. (2009). Ain't no mountain high enough: Plant invasions reaching new elevations. Frontiers in Ecology and the Environment, 7(9), 479–486. 10.1890/080072 [DOI] [Google Scholar]
- Pearson, R. G. , & Dawson, T. P. (2003). Predicting the impacts of climate change on the distribution of species: Are bioclimate envelope models useful? Global Ecology and Biogeography, 12(5), 361–371. 10.1046/j.1466-822X.2003.00042.x [DOI] [Google Scholar]
- Phillips, S. J. , Anderson, R. P. , & Schapire, R. E. (2006). Maximum entropy modeling of species geographic distributions. Ecological Modelling, 190(3), 231–259. 10.1016/j.ecolmodel.2005.03.026 [DOI] [Google Scholar]
- Phillips, S. J. , & Dudík, M. (2008). Modeling of species distributions with Maxent: New extensions and a comprehensive evaluation. Ecography, 31(2), 161–175. 10.1111/j.0906-7590.2008.5203.x [DOI] [Google Scholar]
- Piskackova, T. A. R. , Reberg‐Horton, S. C. , Richardson, R. J. , Jennings, K. M. , Franca, L. , Young, B. G. , & Leon, R. G. (2021). Windows of action for controlling Palmer amaranth (Amaranthus palmeri) using emergence and phenology models. Weed Research, 61(3), 188–198. 10.1111/wre.12470 [DOI] [Google Scholar]
- Potter, T. S. , & Bowman, W. D. (2020). Testing invasion filters for the alpine: The roles of temperature, nitrogen deposition and soil. Biological Invasions, 22, 1–13. 10.1007/s10530-020-02225-5 [DOI] [Google Scholar]
- Pyšek, P. , Hulme, P. E. , Simberloff, D. , Bacher, S. , Blackburn, T. M. , Carlton, J. T. , Dawson, W. , Essl, F. , Foxcroft, L. C. , Genovesi, P. , Jeschke, J. M. , Kühn, I. , Liebhold, A. M. , Mandrak, N. E. , Meyerson, L. A. , Pauchard, A. , Pergl, J. , Roy, H. E. , Seebens, H. , … Richardson, D. M. (2020). Scientists' warning on invasive alien species. Biological Reviews, 95, 1511–1534. 10.1111/brv.12627 [DOI] [PMC free article] [PubMed] [Google Scholar]
- Qin, Z. , Zhang, J. , Jiang, Y. , Wei, H. , Wang, F. , & Lu, X. (2018). Invasion process and potential spread of Amaranthus retroflexus in China. Weed Research, 58(1), 57–67. 10.1111/wre.12282 [DOI] [Google Scholar]
- Ran, Q. , Wei, H. , Zhao, Z. , Zhang, Q. , Liu, J. , & Gu, W. (2019). Impact of climate change on the potential distribution and habitat fragmentation of the relict plant Cathaya argyrophylla Chun et Kuang. Acta Ecologica Sinica, 39(7), 2481–2493. 10.5846/stxb201802010282 [DOI] [Google Scholar]
- Robinson, T. B. , Martin, N. , Loureiro, T. G. , Matikinca, P. , & Robertson, M. P. (2020). Double trouble: The implications of climate change for biological invasions. NeoBiota, 62, 463–487. 10.3897/neobiota.62.55729 [DOI] [Google Scholar]
- Roger, E. , Duursma, D. E. , Downey, P. O. , Gallagher, R. V. , Hughes, L. , Steel, J. , Johnson, S. B. , & Leishman, M. R. (2015). A tool to assess potential for alien plant establishment and expansion under climate change. Journal of Environmental Management, 159, 121–127. 10.1016/j.jenvman.2015.05.039 [DOI] [PubMed] [Google Scholar]
- Runquist, R. D. B. , Lake, T. , Tiffin, P. , & Moeller, D. A. (2019). Species distribution models throughout the invasion history of Palmer amaranth predict regions at risk of future invasion and reveal challenges with modeling rapidly shifting geographic ranges. Scientific Reports, 9, 2426. 10.1038/s41598-018-38054-9 [DOI] [PMC free article] [PubMed] [Google Scholar]
- Sauer, J. (1957). Recent migration and evolution of the dioecious Amaranths . Evolution, 11(1), 11–31. 10.1111/j.1558-5646.1957.tb02872.x [DOI] [Google Scholar]
- Seebens, H. , Blackburn, T. M. , Dyer, E. E. , Genovesi, P. , Hulme, P. E. , Jeschke, J. M. , Paged, S. , Pyšek, P. , Kleunen, M. , Winter, M. , Ansong, M. , Arianoutsou, M. , Bacher, S. , Blasius, B. , Brockerhoff, E. G. , Brundu, G. , Capinha, C. , Causton, C. E. , Celesti‐Grapow, L. , … Essl, F. (2018). Global rise in emerging alien species results from increased accessibility of new source pools. Proceedings of the National Academy of Sciences of the United States of America, 115(10), E2264–E2273. 10.1073/pnas.1719429115 [DOI] [PMC free article] [PubMed] [Google Scholar]
- Seebens, H. , Blackburn, T. M. , Dyer, E. E. , Genovesi, P. , Hulme, P. E. , Jeschke, J. M. , Paged, S. , Pyšek, P. , Winter, M. , Arianoutsou, M. , Bacher, S. , Blasius, B. , Brundu, G. , Capinha, C. , Celesti‐Grapow, L. , Dawson, W. , Dullinger, S. , Fuentes, N. , Jäger, H. , … Essl, F. (2017). No saturation in the accumulation of alien species worldwide. Nature Communications, 8, 14435. 10.1038/ncomms14435 [DOI] [PMC free article] [PubMed] [Google Scholar]
- Shen, Y. , & Wang, G. (2013). Key findings and assessment results of IPCC WGI fifth assessment report. Journal of Glaciology and Geocryology, 35(5), 1068–1076. 10.7522/j.issn.1000-0240.2013.0120 [DOI] [Google Scholar]
- Shi, X. , Chen, X. , Dai, Y. , & Hu, G. (2020). Climate sensitivity and feedbacks of BCC‐CSM to idealized CO2 forcing from CMIP5 to CMIP6. Journal of Meteorological Research, 34(4), 865–878. 10.1007/s13351-020-9204-9 [DOI] [Google Scholar]
- Shigesada, N. , & Kawasaki, K. (1997). Biological invasions: Theory and practice. John Wiley & Sons, Ltd. [Google Scholar]
- Silva, L. D. , Elias, R. B. , & Silva, L. (2021). Modelling invasive alien plant distribution: A literature review of concepts and bibliometric analysis. Environmental Modelling & Software, 145, 105203. 10.1016/j.envsoft.2021.105203 [DOI] [Google Scholar]
- Soberón, J. (2007). Grinnellian and Eltonian niches and geographic distributions of species. Ecology Letters, 10(12), 1115–1123. 10.1111/j.1461-0248.2007.01107.x [DOI] [PubMed] [Google Scholar]
- Soberón, J. M. (2010). Niche and area of distribution modeling: A population ecology perspective. Ecography, 33(1), 159–167. 10.1111/j.1600-0587.2009.06074.x [DOI] [Google Scholar]
- Song, L. , Wu, J. , Li, C. , Li, F. , Peng, S. , & Chen, B. (2009). Different responses of invasive and native species to elevated CO2 concentration. Acta Oecologica, 35(1), 128–135. 10.1016/j.actao.2008.09.002 [DOI] [Google Scholar]
- Steckel, L. E. , Sprague, C. L. , Stoller, E. W. , & Wax, L. M. (2004). Temperature effects on germination of nine Amaranthus species. Weed Science, 52(2), 217–221. 10.1614/WS-03-012R [DOI] [Google Scholar]
- Swets, J. A. (1988). Measuring the accuracy of diagnostic systems. Science, 240, 1285–1293. 10.1126/science.3287615 [DOI] [PubMed] [Google Scholar]
- Tu, W. , Xiong, Q. , Qiu, X. , & Zhang, Y. (2021). Dynamics of invasive alien plant species in China under climate change scenarios. Ecological Indicators, 129, 107919. 10.1016/j.ecolind.2021.107919 [DOI] [Google Scholar]
- Walther, G.‐R. , Roques, A. , Hulme, P. E. , Sykes, M. T. , Pyšek, P. , Kühn, I. , Zobel, M. , Bacher, S. , Botta‐Dukát, Z. , Bugmann, H. , Czúcz, B. , Dauber, J. , Hickler, T. , Jarošík, V. , Kenis, M. , Klotz, S. , Minchin, D. , Moora, M. , Nentwig, W. , … Settele, J. (2009). Alien species in a warmer world: Risks and opportunities. Trends in Ecology & Evolution, 24(12), 686–693. 10.1016/j.tree.2009.06.008 [DOI] [PubMed] [Google Scholar]
- Ward, J. K. , Tissue, D. T. , Thomas, R. B. , & Strain, B. R. (1999). Comparative responses of model C3 and C4 plants to drought in low and elevated CO2 . Global Change Biology, 5(8), 857–867. 10.1046/j.1365-2486.1999.00270.x [DOI] [Google Scholar]
- Ward, S. M. , Webster, T. M. , & Steckel, L. E. (2013). Palmer amaranth (Amaranthus palmeri): A review. Weed Technology, 27(1), 12–27. 10.1614/WT-D-12-00113.1 [DOI] [Google Scholar]
- Williams, A. L. , Wills, K. E. , Janes, J. K. , Vander Schoor, J. K. , Newton, P. C. D. , & Hovenden, M. J. (2007). Warming and free‐air CO2 enrichment alter demographics in four co‐occurring grassland species. New Phytologist, 176(2), 365–374. 10.1111/j.1469-8137.2007.02170.x [DOI] [PubMed] [Google Scholar]
- Wu, J. , Lv, J. , & Ai, L. (2009). The impacts of climate change on the biodiversity: Vulnerability and adaptation. Journal of Ecological Environment, 18(2), 693–703. 10.16258/j.cnki.1674-5906.2009.02.034 [DOI] [Google Scholar]
- Wu, T. , Li, W. , Ji, J. , Xin, X. , Li, L. , Wang, Z. , Zhang, Y. , Li, J. , Zhang, F. , Wei, M. , Shi, X. , Wu, F. , Zhang, L. , Chu, M. , Jie, W. , Liu, Y. , Wang, F. , Liu, X. , Li, Q. , … Zhang, J. (2013). Global carbon budgets simulated by the Beijing climate center climate system model for the last century. Journal of Geophysical Research‐Atmospheres, 118(10), 4326–4347. 10.1002/jgrd.50320 [DOI] [Google Scholar]
- Wu, T. , Lu, Y. , Fang, Y. , Xin, X. , Li, L. , Li, W. , Jie, W. , Zhang, J. , Liu, Y. , Zhang, L. , Zhang, F. , Zhang, Y. , Wu, F. , Li, J. , Chu, M. , Wang, Z. , Shi, X. , Liu, X. , Wei, M. , … Liu, X. (2019). The Beijing climate center climate system model (BCC‐CSM): The main progress from CMIP5 to CMIP6. Geoscientific Model Development, 12(4), 1573–1600. 10.5194/gmd-12-1573-2019 [DOI] [Google Scholar]
- Wu, T. , Song, L. , Li, W. , Wang, Z. , Zhang, H. , Xin, X. , Zhang, Y. , Zhang, L. , Li, J. , Wu, F. , Liu, Y. , Zhang, F. , Shi, X. , Chu, M. , Zhang, J. , Fang, Y. , Wang, F. , Lu, Y. , Liu, X. , … Zhou, M. (2014). An overview of BCC climate system model development and application for climate change studies. Journal of Meteorological Research, 28(1), 34–56. 10.1007/s13351-014-3041-7 [DOI] [Google Scholar]
- Wu, Y. , Zhou, L. , Xiao, S. , Liu, Y. , Zhu, X. , Li, S. , Wu, Y. , Yu, X. , & Liu, K. (2018). Six newly recorded invasive plants in Hunan province and analyses on their invasiveness. Journal of Natural Science of Hunan Normal University, 41(3), 25–29, 41. [Google Scholar]
- Xu, H. , Song, Y. , Fan, X. , Yang, S. , & Wu, Y. (2013). Invasion risk and suitability analysis of three kinds of Acnida weeds (Subgen. Acnida L.) in China. Plant Quarantine, 27(4), 20–23. 10.19662/j.cnki.issn1005-2755.2013.04.006 [DOI] [Google Scholar]
- Yang, J. , Fu, J. , Liao, F. , & Liu, Y. (2015). Analysis of Amaranthus intercepted by quarantine and inspection institution in recent years. Plant Quarantine, 29(3), 93–96. 10.19662/j.cnki.issn1005-2755.2015.03.023 [DOI] [Google Scholar]
- Yates, K. L. , Bouchet, P. J. , Caley, M. J. , Mengesen, K. , Randin, C. F. , Parnell, S. , Fielding, A. H. , Bamford, A. J. , Ban, S. , Barbosa, A. M. , Dormann, C. F. , Elith, J. , Embling, C. B. , Ervin, G. N. , Fisher, R. , Gould, S. , Graf, R. F. , Gregr, E. J. , Halpin, P. N. , … Sequeira, A. M. M. (2018). Outstanding challenges in the transferability of ecological models. Trends in Ecology & Evolution, 33(10), 790–802. 10.1016/j.tree.2018.08.001 [DOI] [PubMed] [Google Scholar]
- Zhang, L. , Liu, S. , Sun, P. , & Wang, T. (2011). Comparative evaluation of multiple models of the effects of climate change on the potential distribution of Pinus massoniana . Chinese Journal of Plant Ecology, 35(11), 1091–1105. 10.3724/SP.J.1258.2011.01091 [DOI] [Google Scholar]
- Zhang, M. (2020). Study on ecological effects of two amaranth invasive plants on the functional traits of native plants . Nankai University. 10.27254/d.cnki.gnkau.2020.000074 [DOI]
- Zhao, G. (2018). Analysis of intercepted pests in plant products imported from Lianyungang port and risk analysis of important pests . Yangzhou University.
- Zhao, G. , Cui, X. , Sun, J. , Li, T. , Wang, Q. , Ye, X. , & Fan, B. (2021). Analysis of the distribution pattern of Chinese Ziziphus jujuba under climate change based on optimized biomod2 and MaxEnt models. Ecological Indicators, 132, 108256. 10.1016/j.ecolind.2021.108256 [DOI] [Google Scholar]
- Zhao, Y. , Deng, X. , Xiang, W. , Chen, L. , & Ouyang, S. (2021). Predicting potential suitable habitats of Chinese fir under current and future climatic scenarios based on Maxent model. Ecological Informatics, 64, 101393. 10.1016/j.ecoinf.2021.101393 [DOI] [Google Scholar]
- Zhou, S. , Zhou, W. , Lin, G. , & Qiao, H. (2013). The impact of future climate change on China's food security. Journal of Nanjing Agricultural University (Social Sciences Edition), 13(1), 56–65. [Google Scholar]
- Zhu, G. , Liu, G. , Bu, W. , & Gao, Y. (2013). Ecological niche modeling and its applications in biodiversity conservation. Biodiversity Science, 21(1), 90–98. 10.3724/SP.J.1003.2013.09106 [DOI] [Google Scholar]
- Ziska, L. H. , Blementhal, D. M. , Runion, G. B. , Hunt, E. R. , & Diaz‐Soltero, H. (2011). Invasive species and climate change: An agronomic perspective. Climatic Change, 105(1–2), 13–42. 10.1007/s10584-010-9879-5 [DOI] [Google Scholar]
- Ziska, L. H. , Faulkner, S. , & Lydon, J. (2004). Changes in biomass and root: Shoot ratio of field‐grown Canada thistle (Cirsium arvense), a noxious, invasive weed, with elevated CO2: Implications for control with glyphosate. Weed Science, 52(4), 584–588. 10.1614/WS-03-161R [DOI] [Google Scholar]
Associated Data
This section collects any data citations, data availability statements, or supplementary materials included in this article.
Data Availability Statement
Datasets used in this study are available online in Dryad at https://doi.org/10.5061/dryad.zpc866tc4.