

Abstract
Recent years have seen an increasing need for higher broadband connections, fueled by novel applications including fifth generation wireless networks (5G). The European Commission is working on achieving specific milestones regarding the development of next generation networks. Many EU countries have opted to adopt a gradual migration path towards the Fiber-to-the-Home (FTTH) technology in view of the high costs of implementation. The Fiber-to-the-Cabinet (FTTC) architecture, combined with very-high-bit-rate digital subscriber line 2 (VDSL2) and vectoring noise cancellation techniques may therefore provide a viable short-term basis solution. Techno-economic modeling and assessment is vital at the initial stages of the development of a telecommunication network investment project involving high capital expenditures for the infrastructure. The present work provides a techno-economic model in order to assess the prospects of such a network upgrade project from a financial perspective, following a three-way migration path. The three stages are: the implementation of the FTTC architecture with VDSL2 vectoring technology, the upgrade to FTTC with G.Fast and finally the migration to FTTH. The analysis is implemented over a suburb of the city of Athens, Greece. Different scenarios are evaluated, predicting profits even from the first years following the investment. The analysis includes the estimation of the degree of market penetration, analytical cost calculations for the implementation and operation of the network and the evaluation of crucial financial indicators, regarding the prospects of the investment in vectoring services. The study can serve as a complete road-map and can be applied in similar upgrade scenarios. The most important outcome of the analysis is that the profits resulted from each upgrade will finance the next step.
Keywords: Broadband, Telecommunications, VDSL2, Vectoring, Technoeconomic analysis, FTTC
Introduction
According to the data published in 2019 by the European Commission [1], nearly 223 million EU households (99.9%) had access to at least one of next generation access (NGA) network technologies (excluding satellite) by the end of 2018. The estimated number of the EU households that enjoy benefits of the NGA networks count to a level of about 179.5 million. Between Q4 2020 and Q1 2021, the share of fiber-to-the-home (FTTH) connections in the total fixed broadband subscriptions went up by 0.8% and stood at 56.4%. Copper-based connections still dominate in Africa, while cable is the prevalent technology in the Americas and FTTH has the largest market share in Asia. At a European level, the penetration for FTTH is currently at 20% while the combined penetration of FTTH and fiber-to-the-building (FTTB) have reached 48.5%. Latest studies predict that in 2026, FTTH/FTTB penetration will reach 197 million for EU39 corresponding to (65.3%). It is therefore clear, that although the long-term tendency is to replace copper-related technologies, these will continue to be part of the access infrastructure for the next few years. Depending on regional policies and area characteristics, transitional fiber-to-the-cabinet (FTTC) architectures have therefore been adopted. In many countries, these decisions are dictated by policy-related deadlines for achieving deployment at higher broadband speeds and the high cost of fiber installation at the customer premises. Investing in gradual FTTC upgrades enable postponing FTTH installation until payback periods for existing infrastructure are reached. We therefore need to consider the evolution stages of the FTTC network to a purely FTTH network in greater detail to obtain realistic road-map.
Vectored DSL constitutes a mature FTTC technology that can achieve a downstream bit-rate of 100 Mb/s at a distance of 500 m taking into advantage existing copper infrastructure [2]. With the use of VDSL2, 35b profile vectoring can be applied on a FTTB architecture (100m from the user’s premises) and the downstream bit-rate can exceed 200 Mb/s [3]. Although VDSL2 has advantages on the quality of the provided services, its performance can be limited due to Far-End Crosstalk (FEXT). FEXT derives from the large number of lines (few hundred) that can coexist in the same cable. Noise cancellation techniques can help reducing the FEXT and enable data rates that can reach the theoretical maximum of the line capacity [4]. In order to apply the vectoring technology, an anti-signal is generated to cancel the crosstalk [5]. It is important to point out that migration to vectoring involves all lines in the same cable to be controlled by a single service provider [6]. This is in contradiction to the current regulatory framework, which aims at promoting provider competition. Fixed access network sharing (FANS) [7] and single-operator vectoring (SOV) can be used to render VDSL compliant with such mandates. In Greece, the national regulatory authority, decided to adopt the SOV implementation model [8], in an attempt to avoid unfair competition between the incumbent provider (55% of market) and the three alternative providers.
G.fast [9] is a relatively newer FTTC technology, that delivers user data rates up to 1 Gbps over copper twisted pairs, implemented with a Fiber-to-the distribution point architecture (FTTdp). FTTdp consists of distribution point units (DPUs) installed closer to the user premises (typically in mini cabinets or curb boxes) being connected via fiber to the central office. This enables bit rates of the order of 500 Mbps over a distance of 250 m. As an upgrade to VDSL, G.fast should co-exist with legacy DSL systems including vectored VDSL. In [10] it shown that deployment of spectral-compatible band plans is an effective means to improve vectored VDSL2 performance with small impact on G.fast. Moreover, the work of [11] investigates the performance of G.fast coexisting with VDSL2 suggesting a scenario where FTTC locations can be upgraded to also serve G.fast. Higher data rates are delivered to subscribers located close to the cabinet, while subscribers with longer lines or with legacy equipment are served with the legacy service. On September 2017, British Telecom (BT) announced a pilot deployment pilot of G.fast across the UK [12], where the service would be delivered over the existing access FTTC infrastructure. Similarities between UK and Greek access networks in terms of existing FTTC architecture and length of the copper cables (shorter than 300m in both cases, allowing G.fast upgrade), it can be concluded that G.fast is probably the best short term option for upgrading VDSL2 vectoring technology.
On a longer term basis, access networks will converge to FTTH which involves installing optical fiber cables up to the subscriber’s premises. Passive optical networks (PON) is based on a point-to-multipoint architecture where a single optical fiber reaches a fiber optic splitter to provide connection to multiple customers. Two typical PON technologies are envisioned: Ethernet PON (EPON) and Gigabit PON (GPON). Both deliver Ethernet to the end-user but the main difference is that GPON is purposely built as a point-to-multipoint protocol whereas EPON relies on Ethernet to achieve this functionality [13]. PON-based FTTH can deliver large symmetric access rates to the end-user which can even reach 10Gbit/s within the 10G-PON standard [14]. With the last migration step, the provider will be able to offer high QoS and maximize the overall QoE by eliminating interference and cross-talk while increasing the efficiency of the service.
In order to make the comparison easier, a summary of the key parameters of each technology is following (Table 1). VDSL 17a technology uses a signal bandwidth of up to 17Mhz with up to 4096 DTM carriers of 4.3 Khz each and a symbol rate of 4000 bps. This can provide speeds of over 100 Mbps (500m) and is related to line length and copper quality. VDSL2 35b uses a higher bandwidth of up to 35 Mhz with 8292 DMT carriers of 4.3 Khz each and a symbol rate of 4000 bps. This provides speeds of up to 200 Mbps downstream (100m). G.Fast is available with a bandwidth of up to 106Mhz (the specification allows for up to 212 Mhz) and provides speeds of up to 500 Mbps (250 m) with shorter rate adaptation times than VDSL2. Also, G.Fast uses a higher symbol rate (48 Kbps) than VDSL2 and provides lower latency. FTTH deployment support speeds up to 10 Gb/s with last-mile latency in GPON FTTH channels below 1.5 ms, even for links up to 20 km . Fiber carries much higher-frequency signals and is less susceptible to interference than cooper, so it is not vulnerable to crosstalk.
Table 1.
Access technology comparison
| Technology | Speed | Distance | Channel | Notes |
|---|---|---|---|---|
| VDSL 17a | 100 Mbps | 500 m | 17.6 MHz | |
| VDSL2 35b (FTTC implemented) | 200 Mbps | 100 m | 35 MHz | Noise cancellation techniques reduce FEXT |
| G.fast (FTTC implemented) | 500 Mbps | 250 m | 1st version 106 MHz and 2nd version 212 MHz | Coexistence with legacy VDSL |
| 1 Gbps | 70 m | |||
| FTTH | 10 Gbps | 20 Km | 1310/1490 nm | No Crosstalk |
In this work we carry out a techno-economic analysis of the FTTC migration path towards FTTH. Our case-study considers a scenario based on a suburb area of Athens. We outline a methodology which includes all the financial aspects of this migration. Regarding the proposed framework, its methodological contribution primarily lies on the usage of the technoeconomic approach in conjunction with the three phases migration method, described in the following Sections. Even if there are previous studies focused on the three phase method, our research introduces the technoeconomic aspect using technoeconomic models. Moreover, inspection of the results of this research reveals that the three phases migration method offers high speed services to the subscribers at low implementation cost and in a relatively short time. In this context, even providers with lack of funds can make the first upgrade to the network and the offered services. In addition, the most important result of the analysis is that the profits made from each upgrade will finance the next migration step. A comparison between the three phase scenario and the direct FTTH is also presented in terms of implementation and operation cost.The proposed framework may be used for further studies in the field of telecommunication investments, adjusted to the each specific case.
The rest of the paper is organized as follows: in Sect. 2, we highlight the contribution of our work taking into account existing literature. In Sect. 3, we present the techno-economic framework that will be used in our analysis and show the main results. In Sect. 4, we discuss the effect of parameter changes using sensitivity analysis and Monte-Carlo simulations. Some concluding remarks are presented in Sect. 5.
Related work
Several works from existing literature discuss the economic prospects of hybrid optical/wireless networks for providing broadband services to the less populated areas. In [15] a cost effective optical/wireless architecture is proposed, offering broadband services to the rural areas with small density of inhabitants. In this context, a techno-economic analysis of the hybrid architecture was presented, focusing on network costs, divided into two categories. The first category referred to the implementation of the FTTH network costs, whereas the second referred to the implementation of long term evolution (LTE) and wireless local area network (WLAN) costs. In addition, a comparison between FTTC and hybrid alternatives was made, pointing out that fiber cable length essentially determines the cost-effectiveness of the FTTC. In [16], a methodology for analyzing the total cost of Ownership (TCO) of a number of backhaul options based on fiber, microwave and copper technologies, was presented. The proposed strategy was applied in a Greenfield scenario, comparing the estimated TCO values of four backhaul network architectures and in a Brownfield scenario, comparing the TCO values of six backhaul network migration options. Moreover, [17] suggested a techno-economic framework, examining not only the TCO but also the business viability of a heterogeneous network deployment. Two technology options for the transport network were considered based on either microwave or fiber systems, assuming both a homogeneous (i.e., purely macrocells) and a heterogeneous deployment. The results indicated a considerable increase in the backhaul TCO in heterogeneous deployments compared to the homogeneous scenario. In addition, the fiber backhaul proved the most cost-efficient and profitable technology for heterogeneous wireless deployments in areas with high density of users. According to the paper’s general conclusions, a low TCO level may not improve profitability, therefore it is recommended to choose a technology or a deployment option that requires a low upfront investment and generates income as early as possible. In [18], a generalized optimization framework aimed to cost-optimally plan 5G fixed wireless access and its optical x-haul network was proposed. The optimal deployment cost performance was examined, taking into consideration various network conditions and deployment scenarios. In [19], an economic analysis of different access network technologies and architectures was presented, where all the essential elements of a general economic framework were identified and specific issues related to the techno-economic evaluation of next generation access networks were examined. In [20] a flexible, generic model for techno-economic evaluation of an FTTH network was introduced, proposing a logical, modular model that allowed for calculating the different parts of the cost, such as infrastructure equipment. Different solutions considering equipment type and placement for a broad range of population densities were compared. The results of the analysis indicated the impact of trade-offs in equipment placement and distance to the central office. In [21] a techno-economic study of an FTTC/VDSL and purely FTTH deployments was performed. The financial issues and challenges associated with the incumbent’s decision to invest in dense urban and urban areas were examined, applying Discounted Cash Flow (DCF) analysis and Real Options Analysis (ROA). Calculation of the cost of the deployment of a PON FTTH network in terms of NPV, IRR and payback period was performed in [22]. The analysis considered several options for high data rate provisions depending on population density.
Most of the above papers focus on hybrid optical/wireless networks, presenting alternative technologies that can be used as a last-mile solution, providing cost effective high-speed broadband access to areas where fixed broadband is limited. The current technoeconomic scenario and its evaluation is an extension of the work initially developed in [23], where a technoeconomic analysis was performed, focusing on VDSL2 vectoring technology with its subsequent G.Fast upgrade. The present work focuses on a similar scenario where traditional copper network infrastructure is already installed. Taking into consideration the need for extending beyond the payback period of the legacy network and the limited budget for an upfront investment, a migration path is investigated, based on three phases corresponding to the three access technologies discussed in Sect. 1. During the first phase, we opt for adopting a FTTC/vectoring VDSL2, to be upgraded later with G.fast technology. As soon as the investment becomes profitable the migration will enter its final phase, which is the provision of a purely FTTH network.
The technoeconomic analysis performed in this work includes time dependent indicators, such as CAPEX, OPEX, revenue and the time period for which the evaluation is considered [24]. The current analysis adds to existing literature, since it evaluates the total investment in terms of income and revenue. The methodological contribution of the proposed model primarily lies on the usage of the technoeconomic approach in conjunction with the 3-phase migration method. Even if there are previous studies focused on the 3-phase method, our research introduces the technoeconomic aspect using technoeconomic models. The proposed framework may be used for further studies in the field of telecommunication investments, adjusted to the each specific case.
In addition, we compare the CAPEX of the three-stage scenario with the CAPEX needed when FTTH is installed in a single stage, without considering intermediate vectoring and G.fast stages. The results indicate that a single-stage implementation could lead to large CAPEX which maybe difficult to cope with at a national or regional scale. In such circumstances the proposed three-stage approach could alleviate some of the economic burden for the provider. The reliability of the results is also verified by carrying out a sensitivity analysis. Different service bundles are offered to customers, whereas the prices are defined based on the pricing policy followed by the local providers of the market. In order to achieve more accurate results, extensive demand forecasting is applied based on price service and historical data from previous technology generations.
Technoeconomic analysis
The current technoeconomic analysis consists of the following steps [25]:
Evaluation of the proposed scenarios, based on the network topology, the technologies, etc.
Demand forecasting for the deployed services.
Modelling costs, revenues and transforming them into annual cash flows and discounted cash flows, for a predefined time period.
Investment analysis by calculating the fundamental financial indices, such as payback period, Net Present Value (NPV), Return on Investment (RoI) and Internal Rate of Return (IRR) for each scenario.
Sensitivity analysis in order to identify the impact of input parameters over the project performance.
The proposed techno-economic approach can be applied to various fields of the technology market, with small modifications customized to each specific case.
Demand forecasting
A major component to the evaluation of the project is the estimated demand for the offered services. Demand forecasting is usually achieved using diffusion models. The latter are mathematical functions of time, used to estimate the parameters of the diffusion process of a product or service life-cycle. They produce S-shaped curves corresponding to future demand at an aggregate level, rather than at an individual user level. The main advantage of the aggregate diffusion models is that they are able to provide accurate forecasts without relying on the underlying specific parameters that drive the process. Diffusion models have been successfully used to forecast telecommunications services [26].
The aggregated S-type diffusion models can be derived from the following differential Eq. (1):
| 1 |
Where Y(t) represents the total penetration at time t, S is the saturation level of the market for the technology under evaluation (the maximum expected adoption level) and r is the coefficient of diffusion, which describes the diffusion speed and correlates the diffusion rate with the actual and the maximum penetration. As observed in Eq. (1), the diffusion speed is proportional to both the population that has already adopted the service, denoted by Y(t), and the remaining market potential, represented by the quantity .
Among the most popular models are the linear logistic [27] and the Gompertz models [28].
The former is described by the following equation:
| 2 |
while the latter by:
| 3 |
A more accurate approach is suggested in [29] showing that price affects the diffusion of mobiles and fixed telephony in six large regions. The use of the price-adjusted logistic model essentially modifies the market potential by introducing a multiplicative factor on reflecting the price. Subsequently, Eqs. (2 and 3) are transformed into:
| 4 |
| 5 |
where corresponds to the price at time t.
The next step in the forecasting process is to determine the values of parameters that best describe the specific dataset. This is achieved by employing historical data describing the diffusion of the specific or similar technologies and use them as an input to a statistical software able to perform Nonlinear Least Squares (NLS) regression. The result of this process will provide the values of the parameters of the evaluated model and will consequently be used to provide the needed forecasts. Not all the aggregate models are able to accurately describe all historical datasets, since the latter are a result of the specific social and economic characteristics of the considered market. For this reason, forecasting should be better based on the application of more than one diffusion model, in order to provide a range, which diffusion is expected to lie within.
Forecasts for the diffusion of the vectoring network can be based on the assumption that, since vectoring technology is the evolution of VDSL, demand can be based on historical data available from non-vectored VDSL which currently upgrades legacy ADSL service. Analysis of market penetration for the years 2005–2012 [30] for ADSL and 2012–2017 [31] for VDSL in Greece, leads to some insights regarding the expected adoption scheme: during the first year that both ADSL and VDSL were commercially introduced, only a small percentage of subscribers adopted the new service, the second year saw a significant growth, while the third year tripling the number of subscribers, followed by a steady annual increase observed in the year to come. We assume that the demand for vectoring will proceed in the same manner. Figure 1, shows the demand forecasting from 2020, when vectoring is introduced extended until 2040. According to the original data, the percentage of ADSL subscribers that adopted VDSL was 6.84% in 2012, 10.36% in 2013, 13.83% in 2014, 16.40% in 2015 and 17.76% in 2016. Assuming that the same penetration is expected for vectoring these values used as input in NLS to obtain the penetration from 2024 onward.
Fig. 1.

Forecast for vectoring, G.fast and FTTH penetration
By year 2020, the total number of subscribers available in the study area is 2.800 and an annual increase of 5% subscribers is calculated matching the broadband annual subscription growth [32]. Four years after the introduction of vectoring the second upgrade of NGA network takes place with the commercial launch of G.fast service. The time of G.fast introduction was taken to coincide with the break-even point of vectoring calculated in our subsequent analysis (see Sect. 3.3). For G.fast technology, the same inputs with VDSL2 vectoring are used shifted ahead in 2024, since we expect that the user tendency to adopt new technologies will not vary significantly over time. Figure 1, shows the gradual increase of VDSL2 vectoring subscribers for both models until the year 2024 where the logistic model is differentiated and a gradual decrease in demand begins. The transition of some vectoring users to the new technology enhances the presented downward trend. In contrast, the Gompertz model does not seem to be affected to such an extent by the introduction of G.fast and its declining period coincides with the commercial release of FTTH. From year 2024 onwards, when FTTH is introduced, the repeated downward trend is transmitted to G.fast users for the logistic model, while for the Gompertz model the subscribers number remain stable for the rest years of the analysis. In general, the figure illustrates the different results obtained by the two models which originates in the assumptions used for their construction. Application of more than one diffusion models, in the context of a technoeconomic analysis, is a common approach and results in a range of values within which the diffusion is expected to lie on.
Billing
The vectoring broadband bundles provide faster internet access to the customers with downstream speeds up to 100 Mbps and 10 Mbps upstream data rates. These bundles are combined with various options for domestic and mobile calls [31], resulting into three different bundles for access technologies:
Economy (E), which provides only unlimited broadband services.
Unlimited (U), which combines unlimited broadband services and unlimited domestic calls to Greek landlines.
Unlimited Plus (U+), which is similar to U, including 360 minutes calls to mobile phones.
A major factor affecting the demand of a product is price. In order to achieve realistic results, the same pricing policy is applied, based on the data of Greek market and the offered bundles.
In 2016, prices for the corresponding legacy VDSL economy (E), double play (U) and double play (U+) at 30 Mbps were at a level of 33.2€/month, 36.2€/month and 40.2€/month, respectively (service prices without the 24% of VAT). the price for VDSL at 50 Mbps was 40.2€/month and 44.2€/month for the U and U+ bundles, while no E option was offered for this access rate which represent the flagship of the operator. Furthermore, comparing the prices of VDSL2 bundles when firstly appeared, a correlation emerges in pricing policy. More specifically, the economic bundle of a service has a similar price with the U+ bundle of a slower speed service, while the price difference between U and U+ of the same speed service usually defined at 4–5€. Based on these figures, a pricing of 45€/month and 49€/month are assumed for the U and U+ 100 Mbps VDSL vectoring bundles in 2020, respectively. The pricing for vectoring starting from 2020 is estimated based on the similar billing policies of the legacy ADSL and VDSL packages during the time period from 2012 to 2017. The actual price variations in the service bundles depend on the specific strategy of each operator and can vary from year to year. In the present case, it is assumed that the price reduction follows a simple geometric distribution , where the index k is the average reduction rate for each year. The value of k for VDSL vectoring can be inferred from the price evolution of similar technologies, in our case legacy VDSL. Based on the available pricing data for the corresponding legacy VDSL bundles in Greece, it was derived that prices within 2012 and 2017 correspond to an average annual reduction k of 3.77% and 3.43% for U and U+, respectively. Applying the geometric formula, we can ascertain that the price reduction of U and U+ at the end of the 10 year period will be % and % and for a 20 year period the reduction is estimated to reach % and % respectively.
Following the bundle policy of British Telecom, we introduce two different G.fast services with 400 Mbps/50Mbps and 200 Mbps/30 Mbps for downstream and upstream data rates respectively. When G.fast becomes available at 2024, the prices of the VDSL2 vectoring packages would be reduced by 5€. Furthermore, G.fast would replace VDSL2 U+ vectoring as the most expensive package. In order to maintain the price difference, G.fast pricing policy is estimated to follow the diminishing value of VDSL2 vectoring, incremented steadily by 6€ and 10€ for the 2 available G.fast packages respectively (G.fast 200 and G.fast 400). When FTTH is implemented in 2030 only one bundle would be available to customers with 800 Mbps downstream and 100 Mbps upstream. The price of the service will be steadily 6€more expensive than of the G.fast 400. That time G.fast 400 will be priced at 36.23€with the price of FTTH 42.24€. From the pricing strategies introduced above it is evident that the leading service from each technology has a similar pricing range of €.
As already mentioned, the Greek national authorities decided to adopt the SOV implementation model. In this model, each provider is responsible for implementing the FttC architecture in a specific demarcated area. The CAPEX and OPEX quantities for the network implementation and operation may vary depending on the chosen equipment and the suppliers but in general there are no major deviations as there have been set specifications for the chosen equipment by national network authority. The bundles and their price depend exclusively on each provider, under the condition that the price will remain the same regardless of whether users are in their region or not. By this way, competition is applied in national level. In order to demonstrate SOV in the techno-economic analysis, it is assumed that the incumbent provider would have the 55% of the total subscribers of the area while the remaining 45% will be owned to the other alternative providers and they would be served as wholesale subscribers. According to the Greek market, the wholesale prices vary, depending on the speed of the broadband service and are the same for all providers. Thus, for the existing available services the prices are 10.84€ for the 100 Mbps, 13.29€ for the 200 Mbps and 17.88€ for the 400 Mbps (the prices are without taxes 24%). These prices are for the first year and it is estimated to also follow the diminishing value of VDSL2 vectoring. With the price reduction, in 2030 wholesale G.fast 400 is expected to cost 14.19€and the wholesale price for FTTH to be 17.88€. The following example illustrates how SOV model works. If an alternative provider, X, offers vectoring 100 Mbps at the price of 45€and a subscriber of X is located in the area serviced by Z provider, then 10.84€will be paid to the area incumbent provider Z, for renting the line and the rest 34.16€will be the actual earning for X. Therefore, for provider X the 10.84€are considered as OPEX and, in contrast, for provider Z are considered as income.
Implementation cost
The investments required for the development of a NGA network based on the FTTC architecture are divided into CAPEX and OPEX. CAPEX refers to the funds used to acquire or upgrade physical assets, such as property, buildings and equipment, as well as the installation cost. OPEX are the expenses that a business incurs through its usual business operations, including rent, equipment, inventory costs, marketing, payroll, electrical consumption and maintenance of the infrastructure. The calculation of the cost is based on the actual region of Egaleo (a suburb of Athens, Greece), which was chosen for the needs of the present technoeconomic analysis. The complicated town planning and the local grove largely affect the optical fiber route (see Fig. 2). As a result, a detour needs to be made for the connection between the cabinets and the distribution center, which increases the final distance of the optical fiber network by several hundred meters. This is a useful case study, being one of the worst case scenarios, as it will raise the implementation cost and that’s why this specific region was preferred. The particular examined area is 188,000 m and there are 9 cabinets. In the map presented in Fig. 2, the exact location of the nine cabinets is marked along with the route of the optical fiber network from the distribution center to the cabinets and the overall covered area inside the blue lines. In 2030 the last update of the migration path will be implemented for the FTTH. Optical fiber network will be installed for all the street that are within the blue line margins. The total cost is estimated to be 6.900€.
Fig. 2.

Map of the Egaleo area
CAPEX estimation
Three-phase scenario CAPEX accounts for the cost for equipment purchase and the installation cost and are summarized in Table 2. The installation of the fiber optic network is estimated at 30€/meter. For the successful interconnection between the distribution center and the nine cabinets (the area is served by nine old copper cabinets, which will be replaced by an equivalent number of new optical cabinets) the total cost is 66,075€for a distance of about 2Km of optical fiber. In addition, the calculated cost for the purchase and the installation of the nine cabinets is 152,127€ including all the necessary equipment inside the cabinet, like DSLAM, batteries, optical distribution frame (ODF), copper line termination and cooling system. In the distribution center, the equipment cost is estimated at 15,940€, including the cost of telecom equipment, such as the optical consolidation rack, the optical line termination, switches and the cooling system. Finally, the operator will provide the subscribers with vectoring routers and this leads to an extra cost of 7,500€, in order to meet the estimated demand for the first 2 years. By the third year, depending on the demand, a new router batch purchase will be required. Taking into consideration the aforementioned analysis, the total cost for the deployment of the NGA network is 241,642€. When calculating costs, wherever technical work is required such as installing the fiber optic network and installing cabinets, prices also include the labor cost. Regarding the CAPEX of G.fast implementation there is an additional cost for purchasing and installing the new equipment. The advantage of the FTTC architecture is that the new equipment will be placed inside the cabinet and there is already available fiber optic network to support it. The implementation cost of active G.fast equipment (DSLAM, service boards, SFP) for the 9 cabinets, the distribution center and the G.fast routers is calculated at 150,990€including the labor cost when needed and is going to be installed during the 4th year of the VDSL2 vectoring operation. The last migration phase is going to be completed with the FTTH implementation by 2030. In FTTH architecture ducts and optical network installation have the highest cost. The main advantage of the gradual upgrade from FTTC to FTTH is that the infrastructure connecting the distribution center and the cabinet is already implemented.As a result, the cost of the optical network is split in two stages and in difficult economic periods the total cost of the investment becomes affordable. The CAPEX for the third phase (optical network from cabinet to subscriber) is estimated at 316,479€. The calculations are summarized in Tables 2 and 3 and Fig. 3. As far as the product lifetime is concerned, there is variation between the different network equipment. Table 4 shows the asset lifetimes of the network elements needed for the implementation of all 3 technologies [33].
Table 2.
Cost calculation (CAPEX)
| CAPEX | |||||||||
|---|---|---|---|---|---|---|---|---|---|
| Equipment | Units | Cost / Unit (€) | Total cost (€) | ||||||
| VDSL | G.Fast | FTTH | VDSL | G.Fast | FttH | VDSL | G.Fast | FTTH | |
| Duct and fiber | 2105(m) | – | 6.900 | 33 | – | 30 | 66,075 | – | 227,798 |
| Cabinets | 9 | – | – | 1500 | – | – | 13,500 | – | – |
| DSLAM & control boards | 9 | 9 | – | 6350 | 8900 | – | 57,150 | 80,100 | – |
| SFP | 18 | 54 | 288 | 100 | 100 | 100 | 1800 | 5400 | 28,800 |
| Fiber patch cord | 18 | 54 | – | 5 | 5 | – | 90 | 270 | – |
| ODF | 9 | – | 27 | 30 | – | 30 | 270 | – | 810 |
| Filter reglet | 135 | 90 | – | 25 | 25 | – | 3375 | 2250 | – |
| Batteries | 36 | – | – | 100 | – | – | 3600 | – | – |
| Cabin installation | 9 | 9 | 9 | 7100 | 3000 | 4000 | 63,900 | 27,000 | 36,000 |
| Power supply | 9 | – | – | 350 | – | – | 3150 | – | – |
| Technical design | 9 | – | – | 688 | – | – | 6192 | – | – |
| OLT | 1 | 1 | 1 | 4000 | 9500 | 6000 | 4000 | 9500 | 6000 |
| Switch | 1 | 1 | 1 | 5200 | 5200 | 5200 | 5200 | 5200 | 5200 |
| OCR | 1 | – | 1 | 500 | – | 1460 | 500 | – | 1460 |
| DC patchcord | 18 | 54 | 576 | 5 | 5 | 5 | 90 | 270 | 2880 |
| Air condition | 1 | – | – | 1150 | – | – | 1150 | – | – |
| DC installation | 1 | 1 | – | 4100 | 3000 | – | 4,100 | 3000 | 4000 |
| Subscriber router | 300 | 450 | – | 25 | 40 | – | 7500 | 18,000 | – |
| Fiber spiltter 1:16 | – | – | 360 | – | – | 10 | – | – | 3600 |
| Cumulative cost | 241,642 | 150,990 | 316,478 | ||||||
Table 3.
Cost calculation (OPEX)
| Equipment | Annual operation cost (€) | |||||
|---|---|---|---|---|---|---|
| VDSL | G.Fast | FTTH | ||||
| OPEX | ||||||
| Cabinets | 13,230 | 6930 | – | |||
| Distribution center | 5145 | 2364 | 2364 | |||
| Year | Existing Copper cable (€) | Duct and fiber (€) | Cabinets (€) | DSLAM equipment* (€) | Distribution center**(€) | Batteries, cooling system (€) |
| Maintenance cost | ||||||
| 2020 | 872.87 | 365.19 | 533.71 | 1085.75 | 485.73 | – |
| 2021 | 872.87 | 719.64 | 1053.59 | 2088.42 | 952.92 | – |
| 2022 | 872.87 | 709,29 | 1040.01 | 2011.30 | 935.74 | 4250 |
| 2023 | 872.87 | 699.30 | 1026.69 | 1939.74 | 919.77 | – |
| 2024 | 872.87 | 689.68 | 1013.64 | 2858.71 | 1385.45 | 4250 |
| 2025 | 872.87 | 680.41 | 1000.86 | 3648.97 | 1817.81 | – |
| 2026 | 872.87 | 671.49 | 988.37 | 3470.01 | 1773.66 | 4250 |
| 2027 | 872.87 | 662.93 | 976.16 | 3305.97 | 1733.21 | – |
| 2028 | 872.87 | 652.72 | 964.27 | 3155.76 | 1696.18 | 4250 |
| 2029 | 872.87 | 646.86 | 952.69 | 3018.29 | 1662.33 | – |
| 2030 | 872.87 | 639.35 | 941.46 | 2892.96 | 1631.43 | 4250 |
| 2031 | 872.87 | 1349.70 | 930.59 | 2778.69 | 2410.59 | – |
| 2032 | 872.87 | 1994.35 | 920.12 | 2674.86 | 3085.12 | 4250 |
| 2033 | 872.87 | 1926.50 | 910.08 | 2580.82 | 2969 | – |
| 2034 | 872.87 | 1863.52 | 900.50 | 2496.01 | 2869.17 | 4250 |
| 2035 | 872.87 | 1805.33 | 891.40 | 2419.90 | 2782.31 | – |
| 2036 | 872.87 | 1751.95 | 882.84 | 2352.01 | 2707.55 | 4250 |
| 2037 | 872.87 | 1703.47 | 874.84 | 2291.88 | 2643.68 | – |
| 2038 | 872.87 | 1660.08 | 867.43 | 2239.05 | 2589.70 | 4250 |
| 2039 | 872.87 | 1621.98 | 860.63 | 2193.06 | 2544.72 | – |
| 2040 | 872.87 | 1589.38 | 854.47 | 2153.427 | 2503.25 | 4250 |
DC distribution center, OCR optical consolitation rack, ODF optical distribution frame, OLT optical line termination, SFP small form-factor pluggable
*Including DSLAM, control-service board,fiber patch cord, SFP, ODF, filtered reglets
**Including OCR rack, OLT, OLT cards, switch, patch-cord
Fig. 3.
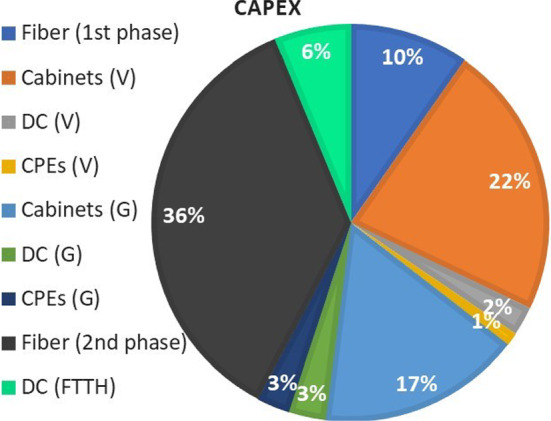
CAPEX individual costs for VDSL vectoring (V) and G.fast (G) and FTTH
Table 4.
Asset lifetimes by equipment type
| Equipment type | Asset lifetimes (Years) |
|---|---|
| Ducts and dark fiber | 40 |
| Street cabinet | 20 |
| Electronic equipment* | 5 |
| ODF | 10 |
| Batteries | 2 |
| Reglet | 20 |
| Rack and frames | 10 |
| Air condition | 10 |
| Subscriber router | 10 |
| Optical fiber interconnections | 5 |
*Including DSLAM, control boards, service boards, SFP, OLT, Switch
Single-phase FTTH scenario In this section, the implementation cost for a single-phase FTTH network investment is also estimated for the same geographical area, as an attempt to better highlight the economic prospects of the three-phase scenario. As mentioned above, the main reason this paper considers the transition though a three-phase FTTH scenario is the high implementation cost of FTTH. In the context of the CAPEX calculation, the same data as in the three-phase scenario were used in order the results to be comparable. For this reason, FTTH network architecture was implemented with specifications to provide 600 Mbps bandwidth for each subscriber, in order to match the bandwidth offered in the last migration phase. We also consider the same number of buildings/subscribers as well as the same distances/routes for the optical fiber network. The Table 5 shows the cost of a single-phase FTTH implementation which is 584,465€ and is much higher compared to the cost of each phase of the tree-phase scenario. Considering that the area is relatively small, it is clear that at a national scale, the cost of investment for a provider can be prohibitive compared to the three phase scenario option which leads to a smoother migration towards FTTH.
Table 5.
CAPEX for direct FTTH
| FTTH network | Cost(€) |
|---|---|
| Ducts and dark fiber | 332,533 |
| Street cabinet | 83,592 |
| Distribution center | 48,340 |
| CPEs | 120,000 |
| Total cost | 584,465 |
OPEX
Three-phase scenario. For a FTTC network, the OPEX mostly depends on the electrical consumption and the maintenance of basic equipment and more specifically, DSLAMs, batteries and cooling system for the cabinets as well as optical line termination (OLT) equipment, switch and air conditioner for the distribution center. For a realistic estimation of the electrical consumption, the cooling system is considered to work at the maximum level during summer period, at 70% during spring, at its 50% for 3 months during autumn and at 20% during the winter. In a similar way, the DSLAM and other devices consumption is estimated, assuming they work for 6 h per day at maximum consumption, 10 h approximately at 50% and 30% for the rest of the day. As a result, the annual operational cost for the nine cabinets is expected to reach 13,230€and the OPEX for the central office 5,145€. An average cost of 0.16€for 1 kWh is assumed. On a daily basis, the cooling system of a single cabinet is expected to operate for 5 h during winter, 12 h during autumn, 17 h in the spring and 24 h at summer period. With an average power consumption of 0.800 kW the total daily consumption is 4 kWh, 9.6 kWh, 13.6 kWh and 19.2 kWh, respectively for the four different seasons while the daily cost is 0.64€, 1.53€, 2.17€and 3.07€. Summing up, for total cost for the winter period the cost is expected to be 58€, 138€in autumn, 195€in the spring and 276€in the summer. The annual cooling cost for a single cabinet is therefore calculated at 667€. In the same way, the annual energy consumption of the DSLAM and the power supply for the nine cabinets in addition to the OLT, switch and air conditioner for the distribution center are estimated. In the distribution center, there is also a monthly additional rental cost of 47€per rack and two of them are required for vectoring needs. When G.fast equipment is installed in all cabinets and the distribution center the OPEX are expected to be increased. The energy consumption of the new equipment will be added to the existing one. The energy consumption of G.fast equipment is calculated with the same methodology and as a result the annual cost is expected to reach 770€per cabinet. In the distribution center the annual energy consumption cost is calculated at 1,800€for the OLT and the switch while it will be used one more rack for the G.fast equipment with annual rental cost of 564€ as shown in Table 3. FTTH does not affect the OPEX of the cabinets because there is no active equipment installed. On the distribution center one more rack is needed for the FTTH equipment with additional cost of 564€/year. The annual energy consumption for the new equipment (aggregation and terminal switch) is calculated to be 1800€.
Over time, network equipment maintenance costs will typically decrease as shown in Table 3. In order to evaluate the annual equipment maintenance costs, we first estimate the decreasing equipment value, for each year after purchase [25]. Using these values, the annual maintenance cost of every equipment can be calculated [34], excluding the maintenance cost of the batteries and the cooling system. A precautionary maintenance cost is considered for the latter, after the third year and subsequently every 2 years, with a total cost of 4250€. The percentage of OPEX costs per equipment are presented in Fig. 4.
Fig. 4.
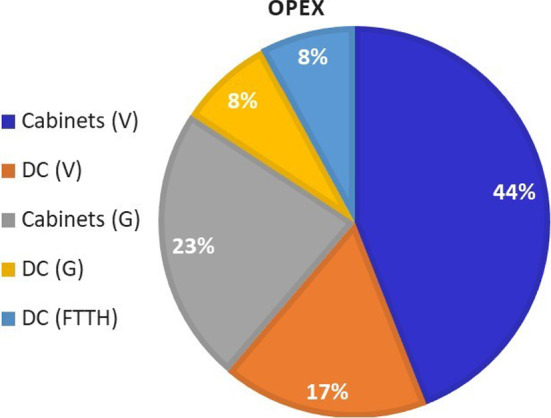
OPEX Costs for VDSL vectoring (V), G.fast (G) and FTTH
Single-phase FTTH scenario In this section we calculate the OPEX for a direct upgrade to FTTH scenario. Contrary to the CAPEX, where the implementation cost of the FTTH network is much higher than the 3W scenario, here the data are inversely proportional. An FTTH network has lower operating costs since the optical network is passive and the equipment in the intermediate cabinets does not require power to operate. Maintenance costs remain the same for the rest equipment, as well as the operating cost regarding distribution center. Calculating all the operating costs with the same methodology as in the 3W scenario, it results that the total annual operating costs are 6945€.
Investment analysis
In Figs. 5a, b, a comparison between the CAPEX, OPEX and revenues is presented for the Gompertz and logistic models respectively. In this point, it should be mentioned that the number of subscribers who choose VDSL2 vectoring is equally divided between the 2 available bundles U and U+. By the same way, the subscriptions of G.fast are split for G.fast 200 and G.fast 400 services. By the end of 2023 (before the G.fast introduction), the number of VDSL2 vectoring subscribers is estimated to 479 subscriptions for logistic model and 483 for Gompertz model. Correspondingly, by the end of 2030 the total G.fast subscriptions is estimated at 640 for logistic and 764 for Gompertz model. After year 2030 with the availability of the FTTH service, for the logistic scenario the vectoring subscribers start to gradually decrease in contrast to the Gompertz in which they continue to increase. At the last year of the technoeconomic analysis, which runs until year 2040, FTTH subscribers stand at 791 for logistic and 982 for Gompertz. Both figures clearly illustrate that the venture can quickly outweigh its expenses, indicating a favorable investment opportunity.
Fig. 5.

OPEX, CAPEX, revenues and earnings for a the Gompertz and b Logistic scenarios over the first 10 years of the investment
Based on these values, measurements of investment profitability, such as the NPV and the IRR can be calculated. By setting the annual discount rate to 5%, the calculated NPV for the first 20 years of operation is:
613.438,46€, for the logistic model.
706.042,86€, for the Gompertz model.
while the IRR for the same period is:
28,91%, for the logistic model.
30,44%, for the Gompertz model.
In both scenarios, the break-even point calculated in Fig. 7 is expected to occur in the first quarter of the fourth operational year. As expected, during the first 2 years the balance is negative due to the slow diffusion, while during the third year, where a larger increase of subscribers is expected, the investment will start showing signs of profitability. Following this, the investment is largely attributable during the fourth year and the profit level is half the initial invested capital. In the following years, the investment continues to generate revenues and, finally, during the last year of the analysis, the total recorded profit is expected to be 5.014.970,9€and 6.511.675,7€for both scenarios. Based on the fact that both NPV and IRR are positive for both scenarios, the investment is considered highly profitable. The presented indicators show that from the fourth year of operation the telecom provider will record constantly increasing profits. The analysis shows that the profits gained from the first two phases are critical, in order to support the funding of the third and final phase.
Fig. 7.

Break even point after price sensitivity analysis
Sensitivity analysis
In this section, the reliability of the results is discussed, by carrying out a sensitivity analysis. Since price is a very important parameter that affects the final outcome of the technoeconomic analysis the sensitivity analysis is performed over the price for the FTTH scenario. In order to further validate the reliability of the results, Monte Carlo simulations are performed by simultaneously changing the price over the years. The different values of price are perturbed from to (1+, for then year, where the perturbations are assumed zero mean, identically distributed, independent random variables uniformly distributed inside [-s s]. In an attempt to investigate the stability of the results we perturb the price and the results are presented in the figure below for the break even point of the FTTH scenario.
As shown in Fig. 6, even with perturbed values of price the computations are not significantly affected and interestingly enough the break even point is calculated almost at the same time as before. The sensitivity analysis presented in this section provides an indication of the reliability of the technoeconomic results against changes that may occur in price.
Fig. 6.

Break even point
Conclusions
A technoeconomic evaluation of a three-way migration upgrade path was presented in this paper, starting from the vectoring VDSL2 technology and gradually leading to the FTTH. The proposed migration consists of a three stages implementation: initially the deployment of an FTTC architecture with VDSL2 vectoring technology, gradually upgraded with G.Fast technology and finally, migration to FTTH. The first 4 years of the analysis started with the use of VDSL2 vectoring technology, followed by the second migration step towards the G.Fast that has been proven to coexist successfully under the same infrastructure using noise canceling techniques. The last step is the expansion to FTTH in year 2030.
The proposed framework, includes a detailed demand forecasting estimation for the three technologies in question. This, in turn, is used as an input for the calculation of CAPEX, OPEX, cash flows based on specific tariff policies and crucial financial indices that describe the investment, such as NPV, ROI, IRR and the payback period. Results show that investments in VDSL/G.fast vectoring networks as an intermediate migration step can be quite profitable at the initial stages, even if a pessimistic demand level and a less favorable area are assumed. The analysis shows that the profits deriving from the first two phases can cover the cost of FTTH (the third and final phase), which constitutes the main goal of the project. We also compared the CAPEX and OPEX of the three-stage scenario with that of single stage FTTH and showed that the latter corresponds to large CAPEX which could burden the provider at a national scale. In such circumstances therefore it is preferable to adopt a three-stage approach.
Even if there are previous studies focused on the 3-phase method, our research introduces the technoeconomic aspect using technoeconomic models. The proposed framework may be used for further studies in the field of telecommunication investments, adjusted to the each specific case.
Taking into consideration the effects of COVID-19 outbreak which, among others, foresees working from home and distance learning, it seems to be a suitable period for a provider to invest in optical networks as the demand for high broadband speeds constantly increases and it is note expected to decrease. In addition to the above, the present study incorporates the way particularities of the area can change the route of the fiber optical network, affecting the total cost and the return on investments.
As far as VDSL2 vectoring with subsequent upgrade to G.fast is concerned, the time the service will be commercially available is imminent. With the vectoring solution, telecom providers bring new value to existing copper and manage to reach tomorrow’s speeds to today’s networks. However, with the high annual growth rate in demand for speed a FTTH architecture should be the final target, regardless which will be the chosen migration path. Currently, most service providers cannot afford the implementation cost of FTTH networks. To this extent, the most advantageous solution -in terms of low cost- investment and spectacular growth is the step-by-step upgrade combining different technologies and making a hybrid optical network. G.fast will be an option in cases where twisted-pair is available and fiber installation is not practical reducing each time the cost of implementation, while on the same time users will enjoy high quality services [35]. What remains to be seen in the years to come is whether the providers that have implemented FTTC networks will proceed to the implementation of FTTH, or they will try to use other alternatives to improve the network speed of the subscribers. This is another topic that requires further research, both from a technical and from an economic standpoint.
Biographies
Aggelos Skoufis
received the B.Sc. in Electronics from Piraeus University of Applied Sciences and M.Sc. in Telecommunication Networks and Telematic Services from Harokopio University. He is a doctoral candidate in technoeconomics of NGA networks in Harokopeion University. He has a strong working experience in fixed access networks, having worked for more than 10+ years in Greek ISPs as network engineer and now works as Test Engineer in Nokia R &D 5G FWA products. His current research interests include performance analysis of wireless and UAV-enabled communication systems.
Georgios Chatzithanasis
is a Ph.D. candidate in the department of Informatics and Telematics of Harokopion University of Athens. He also holds a master’s degree in “Information Systems in Business Management” from the same University. The research subject of his doctoral dissertation is the techno-economic evaluation of technology. Research interest is now focused on bundling for technologies like Cloud Computing and developing an intelligent algorithm for brokering.
Georgia Dede
is Senior Information Security Consultant at Net -company-Intrasoft involved with Research (Horizon 2020) projects and Consulting Projects for EU Institutions. She is also adjunct lecturer and post-doctoral resea-rcher in the area of decision making and operational research in IoT applications and services at the Department of Informatics and Telematics of the Harokopio University. She has worked as a Network and Information Cybersecurity Officer at ENISA (European Union Agency for Cybersecurity). She has participated in EU and national projects. She has published papers in scientific journals, books and conferences, and is also a reviewer in scientific journals.
Evangelia Filiopoulou
holds an Informatics and Telecommunications degree (University of Athens), an M.Sc. degree in Techno-Economical Systems Engineering (National Technical University of Athens) and a Ph.d. degree in the area of Cloud Computing Technoeconomics and Management (Harokopio University). She has been a highschool teacher of Computer Science for 17 years and for the last three years she has been working as a Research Associate in the department of Informatics and Telematics in Harokopio University. Her research interests include technoeconomics analysis, diffusion, pricing, adoption, implementation and resource management of the Internet of Things services and their effect in market trade.
Thomas Kamalakis
(galaxy.hua.gr/~thkam) was born in Athens in 1975. He obtained his B.Sc. in Informatics and M.Sc. in Telecommunication with distinction, from the University of Athens in 1997 and 1999 respectively. In 2004 he completed his Ph.D. thesis in the design and modelling of Arrayed Waveguide Grating devices. He was a research associate for the Optical Communications Laboratory of the University of Athens from 2004 to 2007 and an assistant lecturer in Electronics for the University of Peloponnese at the same period. In 2008 he joined the Department of Informatics and Telematics at Harokopio University of Athens where he is currently a full professor. He has over 100 publications in peer reviewed journal and international conferences. His research interests include integrated optics, nanophotonics, optical detection and free space optics
Christos Michalakelis
is an Associate Professor at the Department of Informatics and Telematics, Harokopio University of Athens. His research interests and field of expertise focus on technoeconomics engineering, costing, pricing and brokering services in the area of ICT, mainly cloud computing and the Internet of Things (IoT). He has worked for many years with the Greek Ministry of Education, as an IT manager. He has participated into a number of projects regarding the design and implementation of database systems, as well as in several technoeconomic and socioeconomic activities for telecommunications, networks and services. He has published more than 100 papers to international journals and conferences. He is co-founder of “Study in Greece” (http://www.studyingreece.edu.gr), the official portal and initiative of Greece (Hellas), for the promotion and support of studies and educational activities in Greece for international students, acting as a cultural an educational bridge between Greece and other countries.
Funding
The authors have not disclosed any funding.
Declarations
Conflict of interest
The authors have not disclosed any competing interests.
Footnotes
Publisher's Note
Springer Nature remains neutral with regard to jurisdictional claims in published maps and institutional affiliations.
Contributor Information
Aggelos Skoufis, Email: skoufis@hua.gr.
Georgios Chatzithanasis, Email: geo.hatz@hua.gr.
Georgia Dede, Email: gdede@hua.gr.
Evangelia Filiopoulou, Email: evangelf@hua.gr.
Thomas Kamalakis, Email: thkam@hua.gr.
Christos Michalakelis, Email: michalak@hua.gr.
References
- 1.European Commission. Mobile and Fixed Broadband Prices in Europe 2019. (2019).
- 2.Zidane R, Huberman S, Leung C, Le-Ngoc Tho. Vectored DSL: Benefits and challenges for service providers. IEEE Communications Magazine. 2013;51(2):152–157. doi: 10.1109/MCOM.2013.6461200. [DOI] [Google Scholar]
- 3.Norhan, N., Nuroddin, A. C. M., & Asrokin, A. (2017). VDSL2 capacity performance evaluation: Simulation versus measurement. In: Proceedings—2017 IEEE conference on systems, process and control, ICSPC 2017, 2018-January(December), pp. 140–145.
- 4.Guenach, M., Meas, J., Timmers, M., Lamparter, O., Bischoff, J. C., & Peeters, M. (2011). VectoringF in DSL systems: Practices and challenges. In: GLOBECOM—IEEE global telecommunications conference.
- 5.Plückebaum, T., Jay, S. & Neumann, K.-H. (2014). Benefits and regulatory challenges of VDSL Vectoring ( and VULA ). SSRN eLibrary.
- 6.Oksman V, Schenk H, Clausen A, Cioffi J, Mohseni M, Ginis G, Nuzman C, Maes J, Peeters M, Fisher K, Eriksson PE. The ITU-T’s new G.vector standard proliferates 100 Mb/s DSL. IEEE Communications Magazine. 2010;48(10):140–148. doi: 10.1109/MCOM.2010.5594689. [DOI] [Google Scholar]
- 7.Cornaglia B, Young G, Marchetta Antonio. Fixed access network sharing. Optical Fiber Technology. 2015;26:2–11. doi: 10.1016/j.yofte.2015.07.008. [DOI] [Google Scholar]
- 8.Hellenic Telecommunications and Post Commission (HTPC). Market analysis. https://www.eett.gr/opencms/opencms/EETT/Electronic_Communications/TelecomMarket/MarketData.html (2015).
- 9.Hincapie, D., Leibiger, M., & Oswald, E. (2018). Roll-out of giga-bit copper: Impact-analysis of deploying g. fast in FTTC access networks. In Broadband coverage in Germany; 12th ITG-symposium, VDE, pp. 1–6
- 10.Hincapie, D., & Maierbacher G. (2016). Impact-analysis for coexisting G.Fast and vectored VDSL2. In 2015 IEEE conference on standards for communications and networking, CSCN 2015, pp. 155–161.
- 11.Strobel, R., & Utschick, W. (2015). Coexistence of g.fast and VDSL in FTTDP and FTTC deployments. In 2015 23rd European signal processing conference (EUSIPCO), pp. 1103–1107.
- 12.British Telecom. GEA-NGA2 G.fast Pilot Service and Interface Description. https://www.btplc.com/sinet/sins/pdf/STIN520v2p0.pdf (2017).
- 13.Obite F, Jaja ET, Ijeomah G, Jahun KI. The evolution of ethernet passive optical network (EPON) and future trends. Optik. 2018;167:103–120. doi: 10.1016/j.ijleo.2018.03.119. [DOI] [Google Scholar]
- 14.D &O COMMITTEE of FTTH. (2018). FTTH Handbook. FTTH Council Europe,5, 1–161.
- 15.Brešković, D. (2014). Techno-economic comparison of FTTC/VDSL and hybrid optical/wireless networks. In 2014 22nd international conference on software, telecommunications and computer networks (SoftCOM), pp. 349–355
- 16.Farias F, Fiorani M, Tombaz S, Mahloo M, Wosinska L, Costa JCWA, Monti P. Cost- and energy-efficient backhaul options for heterogeneous mobile network deployments. Photonic Network Communications. 2016;32(3):422–437. doi: 10.1007/s11107-016-0676-6. [DOI] [Google Scholar]
- 17.Yaghoubi F, Mahloo M, Wosinska L, Monti P, De Farias FS, Costa JCWA, Chen J. A techno-economic framework for 5G transport networks. IEEE Wireless Communications. 2018;25(5):56–63. doi: 10.1109/MWC.2018.1700233. [DOI] [Google Scholar]
- 18.Ranaweera C, Monti P, Skubic B, Wong E, Furdek M, Wosinska L, Machuca CM, Nirmalathas A, Lim C. Optical transport network design for 5G fixed wireless access. Journal of Lightwave Technology. 2019;37(16):3893–3901. doi: 10.1109/JLT.2019.2921378. [DOI] [Google Scholar]
- 19.Kantor, M., Wajda, K., Lannoo, B., Casier, K., Verbrugge, S., Pickavet, M., Wosinska, L., Chen, J., & Mitcsenkov, A. (2010). General framework for techno-economic analysis of next generation access networks. In 2010 12th international conference on transparent optical networks, ICTON 2010.
- 20.Van der Wee, M., Casier, K., Bauters, K., Verbrugge, S., Colle, D., & Pickavet, M. (2012). A modular and hierarchically structured techno-economic model for FTTH deployments comparison of technology and equipment placement as function of population density and number of flexibility points. In 2012 16th international conference on optical network design and modelling (ONDM), IEEE, pp. 1–6.
- 21.Rokkas T, Katsianis D, Varoutas D. Techno-economic evaluation of FTTC/VDSL and FTTH roll-out scenarios: Discounted cash flows and real option valuation. Journal of Optical Communications and Networking. 2010;2(9):760–772. doi: 10.1364/JOCN.2.000760. [DOI] [Google Scholar]
- 22.Rokkas, T. (2015) Techno-economic analysis of pon architectures for FTTH deployments: Comparison between gpon, xgpon and ng-pon2 for a greenfield operator. In 2015 Conference of telecommunication, media and internet techno-economics (CTTE), IEEE, pp. 1–8. IEEE.
- 23.Skoufis A, Georgios C, Georgia D, Thomas K, Christos M. Technoeconomic analysis of a vdsl2/g.fast vectoring network: A case study from Greece. NETNOMICS: Economic Research and Electronic Networking. 2020;21(1):83–101. doi: 10.1007/s11066-020-09142-8. [DOI] [Google Scholar]
- 24.Zhao, R., Zhou, L., Machuca, C. M. (2010) Dynamic migration planning towards FTTH. In Proceedings of 2010 14th international telecommunications network strategy and planning symposium, networks 2010.
- 25.Paper, H., Stepstechno, R. Economic Evaluation, O F Network, and Deployment planning. White paper: Practical steps in Techno—economic evaluation of network, pp. 1–45.
- 26.Michalakelis C, Varoutas D, Sphicopoulos Thomas. Diffusion models of mobile telephony in Greece. Telecommunications Policy. 2008;32(3):234–245. doi: 10.1016/j.telpol.2008.01.004. [DOI] [Google Scholar]
- 27.Michalakelis C, Sphicopoulos T. A population dependent diffusion model with a stochastic extension. International Journal of Forecasting. 2012;28(3):587–606. doi: 10.1016/j.ijforecast.2012.03.002. [DOI] [Google Scholar]
- 28.Gompertz B. On the nature of the function expressive of the law of human mortality, and on a new mode of determining the value of life contingencies. Philosophical Transactions of the Royal Society of London. 1825;115:513–583. doi: 10.1098/rstl.1825.0026. [DOI] [PMC free article] [PubMed] [Google Scholar]
- 29.Meade N, Islam Towhidul. Forecasting in telecommunications and ICT-A review. International Journal of Forecasting. 2015;31(4):1105–1126. doi: 10.1016/j.ijforecast.2014.09.003. [DOI] [Google Scholar]
- 30.Hellenic Telecommunications and Post Commission (HTPC). (2015). HTPC’s Annual Reviews in Greek Electronic Communications and Postal Services Markets (2005–2015). http://www.eett.gr/opencms/opencms/EETT_EN/Journalists/MarketAnalysis/MarketReview/.
- 31.Hellenic Telecommunications Organization (OTE). (2016). OTE’s Annual reports (2012–2016). https://www.cosmote.gr/fixed/en/corporate/ir/publications/annual-reports.
- 32.Hellenic Telecommunications and Post Commission (HTPC). (2020). Market analysis. https://www.eett.gr/opencms/opencms/EETT/Electronic_Communications/TelecomMarket/MarketData.html.
- 33.Cartesian. Wholesale Local Access Market Review: NGA Cost Modelling, 2016.
- 34.Monath T, Elnegaard NK, Cadro P, Katsianis D, Varoutas D. Economics of fixed broadband access network strategies. IEEE Communications Magazine. 2003;41(9):132–139. doi: 10.1109/MCOM.2003.1232248. [DOI] [Google Scholar]
- 35.Z Adamy. (2020) Changing the conversation: G.fast, the fiber extension. https://www.lightwaveonline.com/fttx/fttn-c/article/14184851/changing-the-conversation-gfast-the-fiber-extension.