

Abstract
Background:
Exposure to acute noise can cause an increase in biological stress reactions, which provides biological plausibility for a potential association between sustained noise exposure and stress-related health effects. However, the certainty in the evidence for an association between exposures to noise on short- and long-term biomarkers of stress has not been widely explored. The objective of this review was to evaluate the strength of evidence between noise exposure and changes in the biological parameters known to contribute to the development of stress-related adverse cardiovascular responses.
Materials and Methods:
This systematic review comprises English language comparative studies available in PubMed, Cochrane Central, EMBASE, and CINAHL databases from January 1, 1980 to December 29, 2021. Where possible, random-effects meta-analyses were used to examine the effect of noise exposure from various sources on stress-related cardiovascular biomarkers. The risk of bias of individual studies was assessed using the risk of bias of nonrandomized studies of exposures instrument. The certainty of the body of evidence for each outcome was assessed using the Grading of Recommendations Assessment, Development, and Evaluation approach.
Results:
The search identified 133 primary studies reporting on blood pressure, hypertension, heart rate, cardiac arrhythmia, vascular resistance, and cardiac output. Meta-analyses of blood pressure, hypertension, and heart rate suggested there may be signals of increased risk in response to a higher noise threshold or incrementally higher levels of noise. Across all outcomes, the certainty of the evidence was very low due to concerns with the risk of bias, inconsistency across exposure sources, populations, and studies and imprecision in the estimates of effects.
Conclusions:
This review identifies that exposure to higher levels of noise may increase the risk of some short- and long-term cardiovascular events; however, the certainty of the evidence was very low. This likely represents the inability to compare across the totality of the evidence for each outcome, underscoring the value of continued research in this area. Findings from this review may be used to inform policies of noise reduction or mitigation interventions.
Keywords: Cardiovascular, environmental noise, Grading of Recommendations, Assessment, Development, and Evaluation, hemodynamics, sound, stress
INTRODUCTION
Exposure to acute noise can cause biological stress reactions, including those marked by changes in the hypothalamic–pituitary–adrenal axis, immune system, and others that have been studied in the context of allostasis and allostatic load.[1,2] Stress reactions may combine with other factors to increase stress-related adverse health effects[1]; however, certainty in the association between noise exposure and its influence on short- and long-term biomarkers of stress (e.g., vital signs) has not been widely characterized.
Previous reviews have reported on the characteristics of cardiovascular and metabolic outcomes as a response to increases in noise exposure[3,4,5,6,7,8]; however, they do not benefit from the most up-to-date evidence-based methods for characterizing or assessing the certainty of the evidence of exposure studies. A recent comprehensive review conducted by van Kempen et al. assessed the certainty of evidence (CoE) using a modified Grading of Recommendations, Assessment, Development, and Evaluation (GRADE) approach for the outcomes of blood pressure, hypertension, obesity, ischemic heart disease, stroke, and diabetes.[3] The review authors recognized the limitations in the available evidence due to concerns with the risk of bias and generalizability from predominately cross-sectional studies. Further, Teixeira et al. conducted systematic reviews exploring the prevalence of occupational exposure to noise, as well as the effect of occupational noise on ischemic heart disease, stroke, and hypertension.[7,8] However, these reviews also recognized that the body of evidence was of low certainty due to concerns with the risk of bias and imprecision, as well as the need for further studies investigating the relationship between occupational noise exposure and cardiovascular diseases. Additionally, Dzhambov and Dimitrova conducted a review assessing the association between road traffic noise and children’s blood pressure and found a weak association, partly due to methodological issues in the primary studies, warranting further studies.[6]
In the general noise stress model, the underlying theory is that chronic exposure to noise may lead to extra-aural health effects, including cardiovascular disease, by acting as a nonspecific stressor and/or through sustained sleep disruption.[9,10,11] To that end, several studies have evaluated the statistical association between noise and chronic health conditions using self-report, medical records, or measured outcomes (e.g., blood pressure, hormones, catecholamines). What is lacking in this field of research is a thorough assessment of the strength of the association between noise and the underlying biological risk factors that are known to promote the development of chronic health effects in humans that are often evaluated in relation to environmental noise exposure. In the current analysis, noise exposure from both occupational and nonoccupational sources was considered. The objective of this systematic review was to update the available evidence through December 29, 2021 to evaluate the strength of evidence for an association between noise exposure and changes in the biological parameters known to contribute to the development of stress-related cardiovascular responses.
METHODS
A systematic review and meta-analysis of exposure to noise on biological markers of stress including measures of the cardiovascular system was performed using the Preferred Reporting Items for Systematic Reviews and Meta-Analyses (PRISMA) checklist for the development of this review [see Supplemental Material, Table S1].[12] The protocol is registered in PROSPERO (CRD42020209353).
Literature search
An information specialist conducted searches in PubMed MEDLINE, EMBASE, Cochrane CENTRAL, and CINAHL from January 1, 1980 to December 29, 2021 for peer-reviewed studies reporting on human exposure to noise on a short- or long-term biological markers of stress published in English [see Table S2 for search strategies].
Reference lists of eligible systematic reviews and primary studies were searched for additional references not identified by the search strategy. Results of the literature search and article screening are presented in a PRISMA flow diagram.
Study eligibility
Studies published in English and conducted in humans that provided at least one comparison of noise levels reporting on stress reactions were considered eligible. We included studies reporting on the following outcomes: blood pressure, hypertension, heart rate, cardiac arrhythmia, vascular resistance, and cardiac output. Hypertension was included as an outcome for this review as it has been recognized to be a risk factor for other cardiovascular diseases, including stroke and ischemic heart disease. Eligible measures of noise exposure included A-weighted noise metrics. Specific A-weighted noise metrics include: dB(A), Lden, Lnight, LAeq16, LAeq8h, Ldn, Lmax, and sound exposure level.
| Population | Exposure | Comparator | Outcomes |
| General population, including persons participating in laboratory studies of noise exposure | Incremental increase in noise exposure as measured in dBA noise metrics | Noise exposure (i.e., sound pressure level) as measured in dBA. Noise exposure can come from aircraft, road traffic, rail, wind turbine, or industrial/occupational noise exposure | Blood pressure, hypertension, heart rate, cardiac arrhythmia, vascular resistance, and cardiac output |
Study screening
Two raters reviewed titles and abstracts independently and in duplicate. Studies meeting eligibility at the initial screening stage progressed to full-text review, which was also conducted independently and in duplicate. We used the screening software program Covidence (Covidence systematic review software, Veritas Health Innovation, Melbourne, Australia; available at www.covidence.org). Disagreements were resolved by discussion between reviewers and if the agreement was not achieved, a third reviewer was consulted. If multiple publications of the same study population were identified, the most recent or comprehensive dataset was used.
Data collection
Two reviewers independently extracted study characteristics into a standardized and pilot-tested data extraction form in Microsoft Excel [Table S3]. Extracted information included details on information about publication, study design, study population, source and ascertainment of exposure, ascertainment of outcome, statistical analysis, study results for relevant outcomes, and funding information. Discrepancies were resolved by discussion between reviewers and if agreement was not achieved, a third reviewer was involved.
Data analysis
When appropriate, data were synthesized quantitatively and pooled in a random-effects meta-analysis. Separate random-effects meta-analyses were conducted for each outcome. When possible, studies were grouped based on the continuous measures of noise exposure reported (per 10 dBA increases in noise). If continuous measures were not presented in the original study, study-specific dose-response trends (per 10 dBA increases in noise) were created when three or more categories were available for a study according to the methods outlined by Greenland and Longnecker for dichotomous outcomes,[13] or the methods outlined by Crippa and Orsini for continuous outcomes.[14] To create study-specific dose-response trends, the “dosresmeta” package in R was used. If continuous measures were not available or could not be created, studies by the same noise exposure categories were grouped and analyzed in a separate random-effects meta-analysis using the DerSimonian method.[15] For studies reporting on road traffic, aircraft, or railway noise, noise metrics were converted to Lden, where needed, using the recommended method.[16] Details about individual study estimates used, including the transformations applied and created dose-response trends, can be found in the Supplemental Material.
When study results were too heterogeneous to be pooled, due to differences in populations, measurement of exposure, measurement of outcome or reporting of outcomes, or only one study was available for a given outcome, findings were described narratively. When pooling dichotomous outcomes, the odds ratios, risk ratios, and rate ratios were assumed to all approximate each other.[17] All meta-analyses were performed using the metafor package in R (version 4.0.3).[18,19]
It was determined a priori to analyze studies reporting exposure to noise from different sources (e.g., rail vs road traffic) and different study designs (e.g., cross-sectional vs trials) separately. Heterogeneity between studies was assessed by visual inspection of forest plots, using the chi-square test (using P < 0.1 as a threshold for clinical significance), and using the I2 statistic. Publications were visually assessed for bias by inspecting funnel plot symmetry if a minimum of 10 studies were included in the meta-analysis for each outcome, as there is less accuracy with fewer than 10 studies.[20]
Risk of bias
Two reviewers assessed the risk of bias for each study independently and in duplicate using the Cochrane Risk of Bias tool for randomized controlled trials (RCTs) or a preliminary version of the Risk of Bias Instrument for Non-randomized Studies of Exposures (ROBINS-E) for nonrandomized (i.e., observational) studies [Table S4].[21,22] Discrepancies between assessments were resolved by consensus or consultation with a third reviewer.
For the risk of bias assessment using ROBINS-E, the following confounders were identified as critical for adjustment in the analysis: age, sex, and smoking status. All publications or records for a single primary study were considered when making the risk of bias judgments.
Grading of Recommendations, Assessment, Development, and Evaluation evidence assessment
The overall certainty of the evidence was assessed across each health outcome by the noise exposure source. Following the GRADE approach, reviewers assessed the CoE by considering the five domains for rating down, namely, risk of bias, inconsistency, indirectness, imprecision, and publication bias, and three domains for rating up, namely, large or very large magnitude of effect, dose-response gradient, and opposing residual confounding.[23] The body of evidence was started from RCTs at high initial certainty and nonrandomized studies at low CoE within the GRADE approach.
RESULTS
Literature Search
The search identified 11,482 records, of which 133 primary studies reporting on cardiovascular outcomes were included [Figure 1]. The effects of noise exposure on the following outcomes are presented: blood pressure, hypertension, heart rate, cardiac arrhythmia, vascular resistance, and cardiac output [Table 1]. Characteristics of eligible studies, risk of bias assessments, and estimates extracted from the studies (with transformations) are presented in Tables S5–S23.
Figure 1.
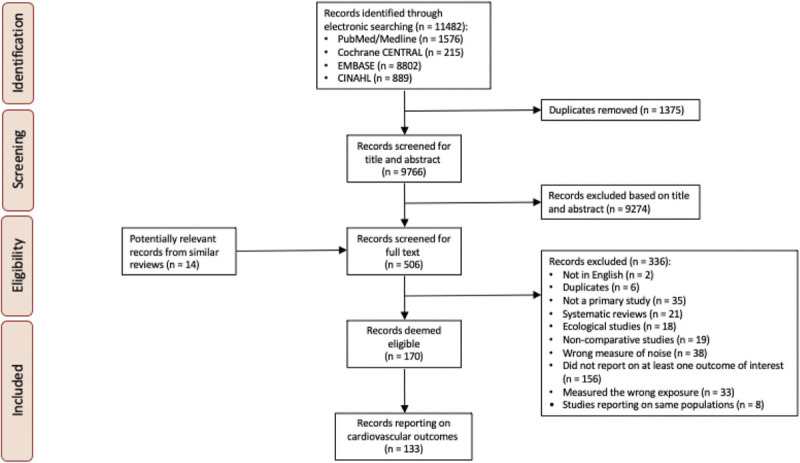
PRISMA flow diagram. PRISMA, Preferred Reporting Items for Systematic Reviews and Meta-Analyses
Table 1.
Characteristics of included studies
| Studies % (n) | |
|---|---|
| Total studies | 133 |
| Population | |
| Neonates | 1.5 (2) |
| Children (1–18 years) | 8.3 (11) |
| Adults (18–64 years) | 90.2 (120) |
| Seniors (65+ years) | 0.8 (1) |
| Noise source* | |
| Aircraft | 12.8 (17) |
| Road traffic | 25.6 (34) |
| Rail | 6.0 (8) |
| Wind turbine | 0.8 (1) |
| Industrial/occupational | 46.6 (62) |
| Mixed | 2.3 (3) |
| Ambient | 6.0 (8) |
| Lab simulated | 12.8 (17) |
| Cardiovascular outcomes* | |
| Blood pressure | 58.6 (78) |
| Hypertension | 49.6 (66) |
| Heart rate | 30.8 (41) |
| Cardiac arrhythmia | 1.5 (2) |
| Vascular resistance | 1.5 (2) |
| Cardiac output | 0.8 (1) |
*May add up to more than 100% because some studies reported on more than one noise source/outcome.
Blood pressure
A total of 78 studies were identified that reported on the impact of noise exposure on blood pressure [Table S5],[24,25,26,27,28,29,30,31,32,33,34,35,36,37,38,39,40,41,42,43,44,45,46,47,48,49,50,51,52,53,54,55,56,57,58,59,60,61,62,63,64,65,66,67,68,69,70,71,72,73,74,75,76,77,78,79,80,81,82,83,84,85,86,87,88,89,90,91,92,93,94,95,96,97,98,99,100,101] including two studies evaluating children from ages 3 to 7 years. Some studies could not be pooled into the meta-analysis due to differences in population, measurement of exposures, measurement of outcomes, and reporting of outcomes.[31,34,38,41,43,50,51,55,56,57,61,62,63,65,66,67,69,70,72,74,77,81,83,86,91,93,94,95,98,99,100] Concerns with risk of bias due to confounding, exposure assessment, selection of participants, missing data, and measurement of outcomes were identified [Table S6]. As shown in Table 2, there was very low CoE for the effects of increased noise exposure on blood pressure.
Table 2.
Summary of findings for noise exposure and blood pressure
| Outcomes | Relative or absolute effects(95% CI) | No of participants(studies) | Certainty of the evidence(GRADE) |
|---|---|---|---|
| Blood pressure – cross-sectional assessed with: exposure to road traffic noise | SBP for adults: MD per 10 dBA increase: 0.01, 95% CI: –0.18, 0.19 [39,45,49,101] DBP for adults: MD per 10 dBA increase: -0.31, 95% CI: –0.46, 0.15[39,45,49,101] SBP for preschool: <60 dBA vs ≥60 dBA: MD: 4.58, 95% CI: 3.43, 5.73[30,75] DBP for preschool: <60 dBA vs ≥60 dBA: MD: 1.05, 95% CI: -3.28, 5.37[30,75] SBP for 8–14 year olds: MD per 10 dBA increase: –0.02, 95% CI: –0.43, 0.40[28,40,71] DBP for 8–14 year olds: MD per 10 dBA increase: -0.19, 95% CI: –0.81, 0.43[28,40,71] | 104,586(9 observational studies) | ⊕○○○VERY LOW *,† |
| Blood pressure – cohort/case control assessed with: exposure to road traffic noise | SBP for adolescents: MD per 10 dBA increase: –0.13, 95% CI: –0.60, 0.35[32,42] SBP for children: MD per 10 dBA increase: –0.11, 95% CI: –0.21, 0[32,92] DBP for children: MD per 10 dBA increase: –0.04, 95% CI: –0.14, 0.05[32,92] | 5752(3 observational studies) | ⊕○○○VERY LOW †,‡ |
| Blood pressure – cross-sectional assessed with: exposure to air traffic noise | SBP: <60 dBA vs ≥60 dBA: MD: 0.63, 95% CI: –1.87, 3.13[33,76,96] DBP: <60 dBA vs ≥60 dBA: MD 0.58, 95% CI: –0.90, 2.05[33,76,96] | 750(3 observational studies) | ⊕○○○VERY LOW †,$ |
| Blood pressure – cohort assessed with: exposure to air traffic noise | [92]: beta of estimated change per 1 dBA for pooled cohortsAt school Leq 7–23 h: SBP 0.08, 95% CI: –0.02, 0.18; DBP 0.05, 95% CI: –0.04, 0.14At home Leq 7–23 h: SBP 0.1, 95% CI: 0–0.2; DBP 0.08, 95% CI: –0.01, 0.17At home Leq 23–7 h: SBP 0.09, 95% CI: 0, 0.18; DBP: 0.07, 95% CI: –0.01, 0.14 | 853(1 observational study) | ⊕○○○VERY LOW †,|| |
| Blood pressure – cross-sectional assessed with: exposure to occupational noise | SBP: MD per 10 dBA increase: 0.14, 95% CI: 0, 0.28[36,53,60,85] DBP: MD per 10 dBA increase: 0.23, 95% CI: 0, 0.45[36,53,60,85] SBP: <85 dBA vs ≥85 dBA: MD: 5.26, 95% CI: 2.23, 8.29[24,27,54,64,68,73,82,84] DBP: <85 dBA vs ≥85 dBA: MD: 3.31, 95% CI: 0.70, 5.92[24,27,54,64,68,73,82,84] SBP: <70 dBA vs ≥70 dBA: MD: 11.78, 95% CI: 7.13, 16.42[47,48,78] DBP: <70 dBA vs ≥70 dBA: MD: 9.32, 95% CI: 7.83, 10.81[47,48,78] | 17,216(15 observational studies) | ⊕○○○VERY LOW †,¶ |
| Blood pressure – cohort/case control assessed with: exposure to occupational noise | SBP: MD per 10 dBA increase: –0.06, 95% CI: –0.92, 0.81[25,37] DBP: MD per 10 dBA increase: 0.27, 95% CI: –0.42, 0.96[26,58,59] SBP: <85 dBA vs ≥85 dBA: MD: 5.38, 95% CI: –0.39, 11.16[26,58,59] DBP: <85 dBA vs ≥85 dBA: MD: 3.80, 95% CI: –1.96, 9.56[26,58,59] SBP: <80 dBA vs ≥80 dBA: MD: 2.02, 95% CI: 0.62, 3.42[42,44,87,88,89,90,97] DBP: <80 dBA vs ≥80 dBA: MD: 3.13, 95% CI: 1.81, 4.46[42,44,87,88,89,90,97] | 6,980(12 observational studies) | ⊕○○○VERY LOW †,# |
| Blood pressure – cross-sectional assessed with: exposure to railway noise | [39]:Beta of association per 10 dB(A):Railway (night): SBP 0.84, 95% CI: 0.22, 1.46; DBP 0.44, 95% CI: 0.06, 0.81Railway (day): SBP 0.6, 95% CI: 0.07,1.13; DBP 0.21, 95% CI: –0.11, 0.53 | 6,450(1 observational study) | ⊕○○○VERY LOW †,** |
| Blood pressure – cohort assessed with: exposure to railway noise | [32]: beta per 6.9 dBAAge 12: SBP –0.15, 95% CI: –0.77, 0.46; DBP: 0.01, 95% CI: –0.42. 0.44Age 16: SBP –0.9, 95% CI: –0.85, 0.67; DBP: 0.08, 95% CI: –0.46, 0.62[45]: beta for association of BP with 10 microgram/m^3 increase in annual average home outdoor NO2<55 dB nighttime traffic noise: SBP –0.4, 95% CI: –2.05, 1.6; DBP –0.05, 95% CI: –1.6, 0.9>55 dB nighttime traffic noise: SBP 1.95, 95% CI: 0.5, 3; DBP 0.1, 95% CI: –0.4, 0.5 | 6,002(2 observational studies) | ⊕○○○VERY LOW †,†† |
| Blood pressure – cohort assessed with: exposure to ambient noise | [29]: Social (room conversation) vs Ambient (background sound): SBP MD: 3.70, 95% CI: –6.56, 13.96; DBP MD: 1.10, 95% CI: –4.53, 6.73Social (hall conversation) vs Ambient (background sound): SBP MD: 1.40, 95% CI: –8.89, 11.6; DBP MD: –1.60, 95% CI: –7.23, 4.03Ambient (environmental sound) vs Ambient (background sound): SBP MD: 1.60, 95% CI: –9.62, 12.82; DBP MD: –0.60, 95% CI: –5.81, 4.61[35]: Increase in SBP (mmHg) per 5 dBA increase: 1.43, 95% CI: 1.19, 1.67Increase in DBP (mmHg) per 5 dBA increase: 1.40, 95% CI: 1.20, 1.60 | 75(2 observational studies) | ⊕○○○VERY LOW †,††,‡‡ |
| Blood pressure – clinical trial assessed with: exposure to lab-simulated noise | Noise 30 vs control: MD: 3.29 mmHg higher, 95% CI: –0.14, 6.72[52,80] Noise 60 vs control: MD: 2.67, 95% CI: –1.61, 6.94[52,79,80] | 210(3 observational studies) | ⊕○○○VERY LOW †,††,‡‡ |
CI: confidence interval; GRADE, Grading of Recommendations, Assessment, Development, and Evaluation; SBP: systolic blood pressure; DBP: diastolic blood pressure; MD: mean difference. GRADE Working Group grades of evidence. High certainty: We are very confident that the true effect lies close to that of the estimate of the effect. Moderate certainty: We are moderately confident in the effect estimate: The true effect is likely to be close to the estimate of the effect, but there is a possibility that it is substantially different.Low certainty: Our confidence in the effect estimate is limited: The true effect may be substantially different from the estimate of the effect. Very low certainty: We have very little confidence in the effect estimate: The true effect is likely to be substantially different from the estimate of the effect. *Critical concern with confounding. Moderate concern with measurement of exposure. Serious concern with missing data and measurement of outcome. †Concerns with imprecision because the 95% CI cannot exclude the potential for meaningful benefit or harm.‡Moderate concern with measurement of exposure and measurement of outcome. Critical concern with missing data. $Critical concern with confounding. Moderate concerns with measurement of exposure, missing data, and measurement of outcome. ||Moderate concern with measurement of exposure and missing data. ¶Critical concern with confounding. Serious concern with measurement of exposure, missing data, and measurement of outcome. Moderate concern with selection of participants. #Critical concern with confounding, measurement of exposure, and missing data. Serious concern with measurement of outcome. **Moderate concern with measurement of exposure and measurement of outcome. ††Moderate concern with measurement of exposure and missing data. Serious concern with measurement of outcome. ‡‡Critical concern with confounding. Concerns for imprecision because the small sample included does not meet the optimal information size and suggests the fragility of the estimate. $$Critical concern with confounding. Moderate concern with missing data. Serious concern with measurement of outcome.
Twelve studies were found that examined the relationship between road traffic noise and blood pressure.[28,30,32,39,40,42,46,49,71,75,92,101] Among cross-sectional studies (n = 4) in adults, it was observed that a 10-dBA increase in road traffic noise may have little to no effect on blood pressure measured by systolic and diastolic values (mean difference [MD]: 0.01, 95% confidence interval [CI]: –0.18, 0.19 and MD: –0.31, 95% CI: –0.46, 0.15; for systolic and diastolic blood pressure, respectively; very low CoE) [Figure 2]. The studies reporting on children ages 3 to 7 years (n = 2) suggested a possible increase in systolic blood pressure for every 10-dBA increase in road traffic noise (MD: 4.58, 95% CI: 3.43, 5.73; very low CoE); however, they reported little to no effect on diastolic blood pressure in response to noise exposure (MD: 1.05, 95% CI: –3.28, 5.37; very low CoE) [Figure 3]. Studies reporting on children 8 to 14 years old (n = 3) suggested a 10-dBA increase in road traffic noise may have little to no effect on systolic blood pressure but may increase diastolic blood pressure (MD: –0.02, 95% CI: –0.43, 0.40; MD: –0.19, 95% CI: –0.81, 0.43; for systolic and diastolic blood pressure, respectively; very low CoE) [Figure 3].
Figure 2.

Forest plot of road traffic noise and mean difference in blood pressure (in mmHg) for cross-sectional studies (per 10 dBA increase in noise exposure). Note: pooled effect estimate presented as mean difference (MD) with lower and upper 95% confidence limits.
Figure 3.

Forest plot of road traffic noise and mean difference in blood pressure (in mmHg) for cross-sectional studies among children/teenagers (<60 vs. ≥60 dBA or per 10 dBA increase). Note: pooled effect estimate presented as mean difference (MD) with lower and upper 95% confidence limits.
Among cohort and case-control studies (n = 3), it was observed that for adolescents (16 years old) and children (9–12 years old), a 10-dBA increase in road traffic noise may have little to no effect on systolic blood pressure (MD: –0.13, 95% CI: –0.60, 0.35; very low CoE and MD: –0.11, 95% CI: –0.21, 0; MD: –0.04; 95% CI: –0.14, 0.05; for systolic and diastolic blood pressure, respectively; very low CoE) [Figure 4].
Figure 4.

Forest plot of road traffic noise and mean difference in blood pressure (in mmHg) for cohort/case-control studies among children/teenagers (<60 vs. ≥60 dBA or per 10 dBA increase). Note: pooled effect estimate presented as mean difference (MD) with lower and upper 95% confidence limits.
Four studies were identified that examined air traffic noise and blood pressure.[33,76,92,96] One cohort study reported that increased air traffic noise may have little to no effect on blood pressure; however, the certainty of the evidence was very low. Among cross-sectional studies (n = 3), an increase in air traffic noise may have little to no effect on blood pressure (MD: 0.63, 95% CI: –1.87, 3.13; MD: 0.58, 95% CI: –0.90, 2.05; for systolic and diastolic blood pressure, respectively; very low CoE) [Figure 5].
Figure 5.
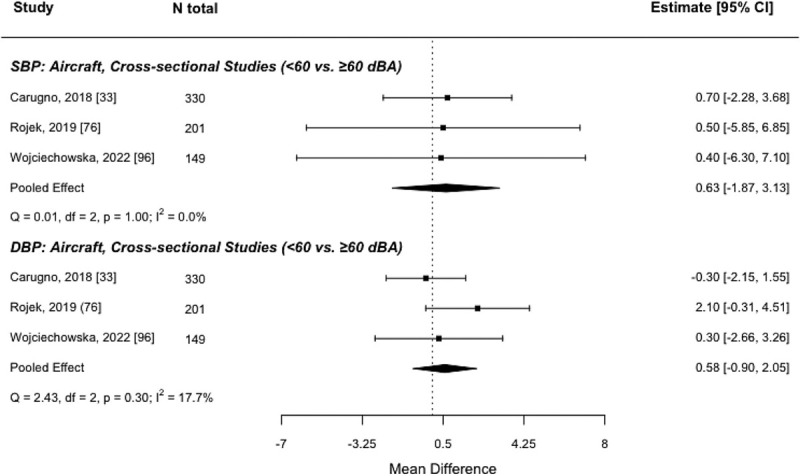
Forest plot of aircraft noise and mean difference in blood pressure (in mmHg) for cross-sectional studies (<60 vs. ≥60 dBA). Note: pooled effect estimate presented as mean difference (MD) with lower and upper 95% confidence limits.
There were 27 studies identified that examined the relationship between occupational noise and blood pressure.[24,25,26,27,36,37,42,44,47,48,53,54,58,59,60,64,68,73,78,82,84,85,87,88,89,90,97] Among cross-sectional studies (n = 15), for studies that reported on exposure continuously, a 10-dBA increase in occupational noise was found to have little to no effect on blood pressure (MD: 0.14, 95% CI: 0, 0.28; MD: 0.23, 95% CI: 0, 0.45; for systolic and diastolic blood pressure, respectively; very low CoE) [Figure 6A]. For studies that reported occupational noise in categories, it was found that higher levels of occupational noise (≥85 dBA vs <85 dBA) may increase systolic blood pressure and diastolic blood pressure (MD: 5.26, 95% CI: 2.23, 8.29; MD: 3.31, 95% CI: 0.70, 5.92; for systolic and diastolic blood pressure, respectively; very low CoE). For a lower threshold of noise (≥70 dBA vs <70 dBA), it was found that higher levels of occupational noise may increase systolic and diastolic blood pressure (MD: 11.78, 95% CI: 7.13, 16.42; MD 9.32, 95% CI: 7.83, 10.81; for systolic and diastolic blood pressure, respectively; very low CoE) [Figure 6B].
Figure 6.

Forest plots of occupational noise and mean difference in blood pressure (in mmHg) for cross-sectional studies, for A) continuous measures (per 10 dBA increase) and B) categorized measures (<85 vs. ≥85 dBA or <70 vs. ≥70 dBA). Note: pooled effect estimate presented as mean difference (MD) with lower and upper 95% confidence limits.
Among cohort and case-control studies (n = 12), for studies that reported on exposure continuously, it was found that a 10-dBA increase in occupational noise may have little to no effect on blood pressure (MD: –0.06, 95% CI: –0.92, 0.81; MD: 0.27, 95% CI: –0.42, 0.96; systolic and diastolic blood pressure, respectively; very low CoE) [Figure 7A]. For studies that reported occupational noise in categories, it was found that higher levels of occupational noise (≥85 dBA vs <85 dBA) had little to no effect on blood pressure (MD: 5.38, 95% CI: –0.39, 11.16; MD: 3.80, 95% CI: –1.96, 9.56; systolic and diastolic blood pressure, respectively; very low CoE). However, higher levels of occupational noise over ≥80 dBA (vs <80 dBA) may increase both systolic and diastolic blood pressure (MD: 2.02, 95% CI: 0.62, 3.42; MD: 3.13, 95% CI: 1.81, 4.46; for systolic and diastolic blood pressure, respectively; very low CoE) [Figure 7B].
Figure 7.

Forest plots of occupational noise and mean difference in blood pressure (in mmHg) for cohort/case-control studies, for A) continuous measures (per 10 dBA increase) and B) categorized measures (<85 vs. ≥85 dBA or <80 vs. ≥80 dBA). Note: pooled effect estimate presented as mean difference (MD) with lower and upper 95% confidence limits.
Three studies examined railway noise and blood pressure.[32,39,45] Among both cross-sectional (n = 1) and cohort (n = 2) studies, it was found that an increase in railway noise may have little to no effect on blood pressure; however, the evidence was very uncertain [Table 2].
Two studies examined the relationship between ambient noise and blood pressure.[29,35] Among these cohort studies, it was found that an increase in ambient noise may increase blood pressure; however, the certainty in the evidence was very low [Table 2].
Three studies examined the relationship between lab-simulated noise and blood pressure.[52,79,80] Among these clinical trials, it was found that an increase in lab-simulated noise may have little to no effect on blood pressure (MD: 3.29, 95% CI: –0.14, 6.72; MD: 2.67, 95% CI: –1.61, 6.94; noise 30 vs control and noise 60 vs control, respectively; very low CoE) [Figure 8].
Figure 8.
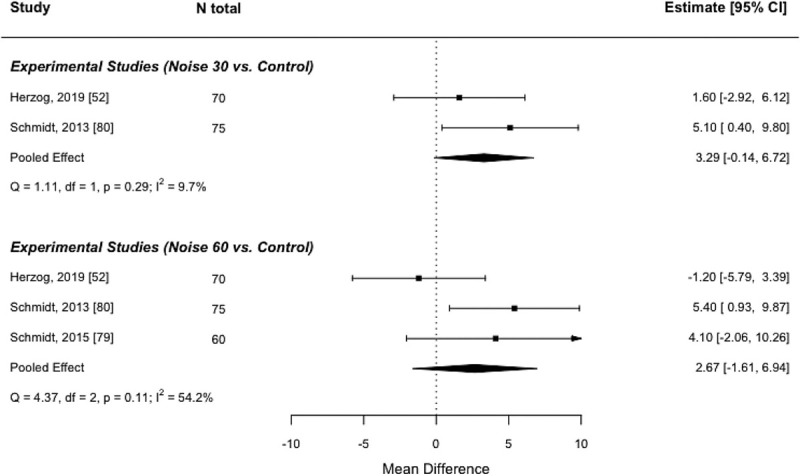
Forest plot of lab-simulated noise and mean difference in blood pressure (in mmHg) for experimental studies (control vs. Noise 30 or Noise 60). Notes: pooled effect estimate presented as mean difference (MD) with lower and upper 95% confidence limits; Noise 30: playback of 30 aircraft noise events, Noise 60: playback of 60 aircraft noise events.
Hypertension
A total of 65 studies were identified that reported on the impact of noise exposure on hypertension [Table S8][26,27,30,33,34,36,37,38,42,46,49,54,55,60,61,63,64,68,70,72,77,78,88,89,90,93,97,100,102,103,104,105,106,107,108,109,110,111,112,113,114,115,116,117,118,119,120,121,122,123,124,125,126,127,128,129,130,131,132,133,134,135,136]; however some of them could not be pooled into the meta-analysis due to differences in population, measurement of exposures, measurement of outcomes, and reporting of outcomes.[30,33,38,42,54,55,63,64,70,72,77,78,88,89,90,93,97,100,105,106,109,114,118,119,124,127,129,130,136] There was variability in how hypertension was assessed, including patient recall based on previous diagnoses, medical diagnosis by physicians, and the use of antihypertension medications. Concerns with the risk of bias due to confounding, exposure assessment, selection of participants, missing data, and measurement of outcomes were identified [Table S9]. As shown in Table 3, there was very low CoE for the effects of increased noise exposure on hypertension.
Table 3.
Summary of findings for noise exposure and hypertension
| Outcomes | Relative or absolute effects(95% CI) | No. of participants(studies) | Certainty of the evidence(GRADE) |
|---|---|---|---|
| Hypertension – cross-sectional assessed with: exposure to road traffic noise | RR* 1.09 (1.03–1.14) | 89,668(8 observational studies) | ⊕○○○VERY LOW † |
| Hypertension – cohort/case-control assessed with: exposure to road traffic noise | RR* 1.01(0.99 to 1.03) | 1,201,170(5 observational studies) | ⊕○○○VERY LOW ‡,$ |
| Hypertension – cross-sectional assessed with: exposure to air traffic noise | RR* 1.03(1.00 to 1.06) | 10,607(2 observational studies) | ⊕○○○VERY LOW $,|| |
| Hypertension – cohort/case-control assessed with: exposure to air traffic noise | RR* 1.10(0.95 to 1.27) | 498,442(3 observational studies) | ⊕○○○VERY LOW $,¶ |
| Hypertension – cross-sectional assessed with: exposure to occupational noise | <85 dBA vs ≥85 dBA: RR: 1.74, 95% CI: 1.14, 2.65[27,68,110,116,120,123,125,132] RR per 10 dBA increase: 1.64, 95% CI: 1.15, 2.36[36,60,111,122,125] | 35,746(12 observational studies) | ⊕○○○VERY LOW # |
| Hypertension – cohort/case-control assessed with: exposure to occupational noise | <85 dBA vs ≥85 dBA: RR 1.35, 95% CI: 1.02, 1.80[26,121,134] RR per 10 dBA increase: 1.31, 95% CI: 1.15, 1.48[34,37,115] | 17,694(6 observational studies) | ⊕○○○VERY LOW ** |
| Hypertension – cohort/case-control assessed with: exposure to railway noise | RR* 0.98(0.90 to 1.06) | 498,022(2 observational studies) | ⊕○○○VERY LOW $,¶ |
| Hypertension – cross-sectional assessed with: exposure to wind turbine noise | [126]: OR association between A-weighted sound pressure levels and high blood pressure:Study 1 (2000): 1.03, 95% CI: 0.90-1.17Study 2 (2005): 1.05, 95% CI: 0.97–1.13Study 3 (2007): 1.01, 95% CI: 0.96–1.06 | 1755(1 observational study) | ⊕○○○VERY LOW †† |
CI: confidence Interval; GRADE, Grading of Recommendations, Assessment, Development, and Evaluation; RR: risk ratio; OR: odds ratio. GRADE Working Group grades of evidence. High certainty: We are very confident that the true effect lies close to that of the estimate of the effect. Moderate certainty: We are moderately confident in the effect estimate: The true effect is likely to be close to the estimate of the effect, but there is a possibility that it is substantially different. Low certainty: Our confidence in the effect estimate is limited: The true effect may be substantially different from the estimate of the effect. Very low certainty: We have very little confidence in the effect estimate: The true effect is likely to be substantially different from the estimate of the effect. *Change per 10 dBA (95% CI). †Moderate concerns with confounding and measurement of exposure. Critical concerns with missing data and measurement of outcome. ‡Moderate concerns with confounding and measurement of exposure. Serious concerns with missing data and measurement of outcome. $Concerns with imprecision because the 95% CI cannot exclude the potential for harm. ||Moderate concerns with measurement of exposure and missing data. Serious concern with measurement of outcome. ¶Moderate concerns with confounding, measurement of exposure, and selection of participants. Serious concerns with missing data and measurement of outcome. #Serious concerns with confounding, missing data, and measurement of outcome. Critical concern with exposure assessment. **Critical concern with measurement of exposure and outcome. Moderate concern with missing data. ††Serious concerns with confounding and measurement of outcome. Moderate concern with exposure assessment.
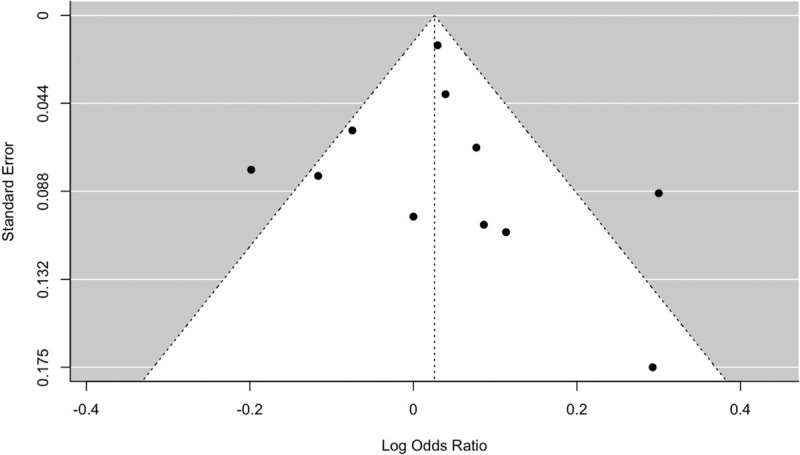
Thirteen studies were found that examined the relationship between road traffic noise and the risk of hypertension.[46,49,61,102,103,107,108,112,117,128,131,133,135] Among cross-sectional studies (n = 8), it was found that every 10-dBA increase in road traffic noise may increase the risk of hypertension may increase the risk of hypertension by 9% (RR: 1.09, 95% CI: 1.03, 1.14; very low CoE) [Figures 9 and 10]; however, there was very low CoE. Results of the funnel plot did not suggest publication bias [Figure 10]. Among cohort and case-control studies (n = 5), heterogeneity was high (I2 = 82%), and it was found that road traffic noise may have little to no effect on hypertension, but the evidence was very uncertain (RR: 1.01, 95% CI: 0.99, 1.03; very low CoE) [Figure 9].
Figure 9.

Forest plot of road noise and risk of hypertension (per 10 dBA increase). Note: pooled effect estimate presented as a relative risk (RR) with lower and upper 95% confidence limits.
Figure 10.
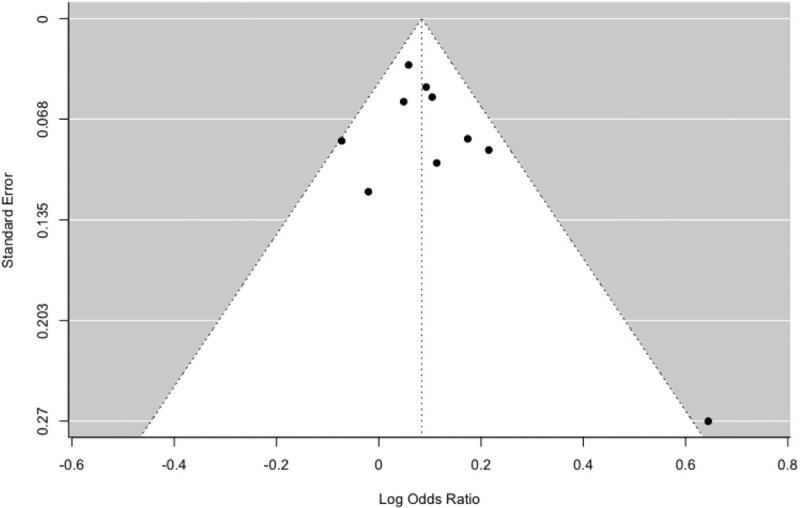
Funnel plot of road noise and risk of hypertension for cross-sectional studies.
Five studies examined air traffic noise and the risk of hypertension.[104,112,113,128,135] Among cross-sectional studies (n = 2), no strong evidence that air traffic noise was associated with hypertension was found (RR: 1.03, 95% CI: 1.00, 1.06; very low CoE) [Figures 11 and 12]. Results of the funnel plot did not suggest publication bias [Figure 12]. Among cohort and case-control studies (n = 3), although heterogeneity was high (I2 = 90%), it was found that every 10-dBA increase in air traffic noise may increase the risk of hypertension by 10% (RR: 1.10, 95% CI: 0.95, 1.27; very low CoE) [Figure 11].
Figure 11.
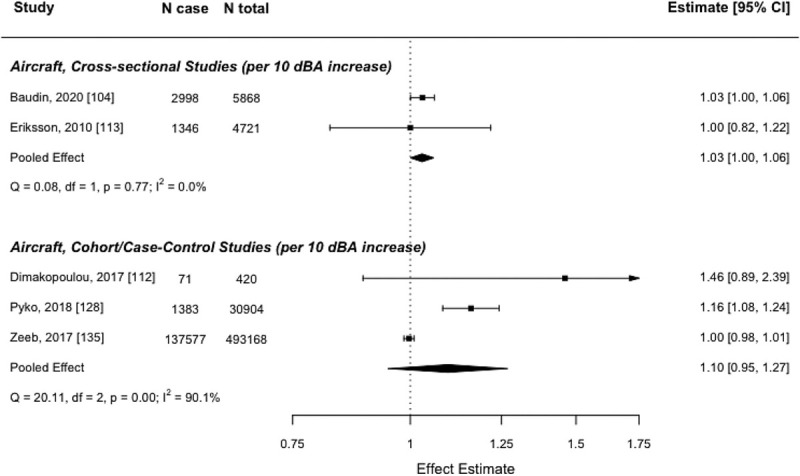
Forest plot of aircraft noise and risk of hypertension (per 10 dBA increase). Note: pooled effect estimate presented as a relative risk (RR) with lower and upper 95% confidence limits.
Figure 12.
Funnel plot of aircraft noise and risk of hypertension for cross-sectional studies.
Eighteen studies were found that examined the relationship between occupational noise and the risk of hypertension.[26,27,34,36,37,60,68,110,111,115,116,120,121,122,123,125,132,134] While the evidence was uncertain among cross-sectional studies (n = 12), due to the risk of bias and substantial heterogeneity (I2 between 87% and 93%), it was found that an increase in occupational noise may increase the risk of hypertension (RR: 1.64, 95% CI: 1.15, 2.36; RR: 1.74, 95% CI: 1.14, 2.65; for continuous and categorical measures, respectively) [Figure 13]. Similarly, among cohort studies (n = 6), it was found that an increase in occupational noise may increase the risk of hypertension (RR: 1.31, 95% CI: 1.15, 1.48; RR: 1.35, 95% CI: 1.02, 1.80; for continuous and categorical measures, respectively; very low CoE) [Figure 13].
Figure 13.
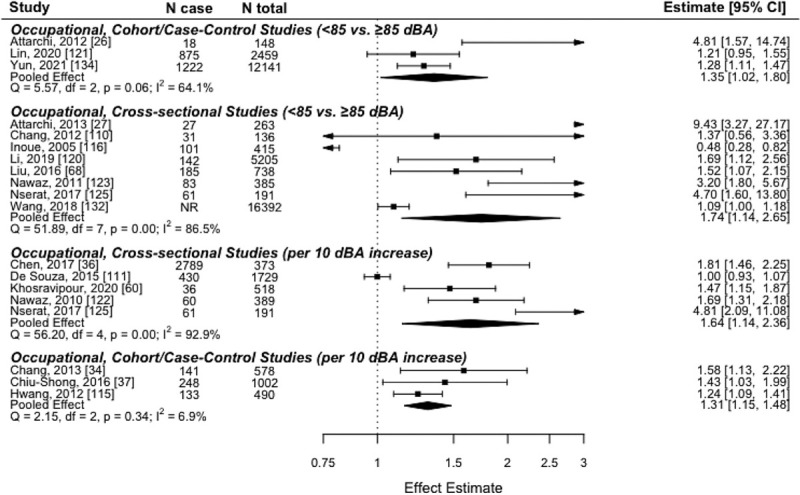
Forest plot of occupational noise and risk of hypertension (<85 vs ≥85 dBA or per 10 dBA increase). RR, relative risk. *Pooled effect estimate presented as RR with lower and upper 95% confidence limits.
Only two studies reported railway noise in relation to hypertension and found that every 10-dBA increase in railway noise may have little to no effect on the risk of hypertension (RR: 0.98, 95% CI: 0.90, 1.06; very low CoE) [Figure 14].[128,135] One study reported on the relationship between wind turbine noise and hypertension, using studies conducted at three separate time points, and reported little to no effect (OR1: 1.03, 95% CI: 0.90, 1.17; OR2: 1.05, 95% CI: 0.97, 1.13; OR3: 1.01, 95% CI: 0.96, 1.06); however, the certainty in the evidence was very low.[126]
Figure 14.

Forest plot of railway noise and risk of hypertension (per 10 dBA increase). RR, relative risk. *Pooled effect estimate presented as RR with lower and upper 95% confidence limits.
Heart rate
A total of 43 studies were identified that reported on the impact of noise exposure on heart rate [Table S11][29,30,31,44,48,50,52,57,59,62,67,69,70,74,75,76,77,79,80,82,86,87,92,99,101,137,138,139,140,141,142,143,144,145,146,147,148,149,150,151,152,153,154]; however, some of them could not be pooled into the meta-analysis due to differences in population, measurement of exposures, measurement of outcomes, and reporting of outcomes.[31,50,67,69,70,74,86,99,140,141,142,145,146,147,149,151,152,153,154] Concerns with the risk of bias due to confounding, exposure assessment, missing data, and measurement of outcomes were identified [Tables S12 and S13]. As shown in Table 4, there was very low CoE for the effects of increased noise exposure on heart rate.
Table 4.
Summary of findings for noise exposure and heart rate
| Outcomes | Relative or absolute effects(95% CI) | No. of participants(studies) | Certainty of the evidence(GRADE) |
|---|---|---|---|
| Heart rate – cross-sectional assessed with: exposure to road traffic noise | [30]: Quiet residence, noisy kindergarten vs quiet residence, quiet kindergarten: MD: -1.58 bpm, 95% CI: –5.00, 1.84Noisy residence, quiet kindergarten vs quiet residence, quiet kindergarten: MD: 2.44 bpm, 95% CI: –1.17, 6.05Noisy residence, noisy kindergarten vs quiet residence, quiet kindergarten: MD: 1.91 bpm, 95% CI: –1.36, 5.18[75]:Noisy (61–69 dBA) vs quiet (≤60 dBA): MD –2.14 bpm, 95% CI: –2.21, –2.07Very noisy (≥70 dBA) vs quiet (≤60 dBA): MD –3.91 bpm, 95% CI: –4.00, –3.82[101]: association between Lden and blood pressureLden <55 dBA: referenceLden 55–60 dBA: 0.66, 95% CI: 0.49, 0.83Lden > 60 dBA: 1.19, 95% CI: 0.95, 1.44 | 90,206(3 observational studies) | ⊕○○○VERY LOW *,† |
| Heart rate – cohort assessed with: exposure to road traffic noise | [92]:Beta of estimated change in SBP per dBA: –0.02, 95% CI: –0.13, 0.08 | 853(1 observational study) | ⊕○○○VERY LOW †,‡ |
| Heart rate – cross-sectional assessed with: exposure to air traffic noise | [57]: 150 m vs 75 m areasBoys: MD: 4.60, 95% CI: 2.25, 6.95Girls: MD: 1.20, 95% CI: –1.14, 3.54[76]:Exposed (>60 dBA) vs unexposed (<55 dBA): MD: 2.80, 95% CI: 0.42, 5.18 | 634(2 observational studies) | ⊕○○○VERY LOW †,$,|| |
| Heart rate – cohort assessed with: exposure to air traffic noise | [92]: Beta of estimated change in HR per dBA for pooled cohorts:At school Leq 7-23h: 0.05, 95% CI: –0.06, 0.15At home Leq 7-23h: 0.02, 95% CI: –0.08, 0.13At home Leq 23-7h: 0.03, 95% CI: –0.07, 0.12 | 853(1 observational study) | ⊕○○○VERY LOW †,‡ |
| Heart rate – cross-sectional assessed with: exposure to occupational noise | [138]:increase in heart rate per 1 dBA: 0.17, 95% CI: NR[48]:High noise >70 dBA vs low noise <50 dBA: MD: 7.23, 95% CI: 4.41, 10.05[62]:Engine room crew (1–4 y service) vs Engine room crew (5–9 y service): MD: 5.10, 95% CI: 3.59, 6.61 Engine room crew (1–4 y service) vs Engine room crew (10–14 y service): MD: 8.50, 95% CI: 7.24, 9.76Engine room crew (1–4 y service) vs Engine room crew (15–19 y service): MD: 5.80, 95% CI: 4.38, 7.22 Engine room crew (1–4 y service) vs Engine room crew (20+ y service): MD: 8.30, 95% CI: 7.12, 9.48Deck crew (1–4 y service) vs Deck crew (5–9 y service): MD: –3.10, 95% CI: –4.19, –2.01 Deck crew (1–4 y service) vs Deck crew (10–14 y service): MD: 6.60, 95% CI: 5.52, 7.68 Deck crew (1–4 y service) vs Deck crew (15–19 y service): MD: 2.40, 95% CI: 1.17, 3.63Deck crew (1–4 y service) vs Deck crew (20+y service): MD: 5.70, 95% CI: 4.90, 6.50[82]:Exposed (88–107 dBA) vs unexposed: MD: 3.29, 95% CI: 2.88, 3.70[143]:beta per 1 dBA increase in Leq: 0.5 dBA, 95% CI: 0.04, 0.09[77]:<10 yrs exposed vs <10 yrs controls: MD: 10.50, 95% CI: 2.89, 18.1110–20 yrs exposed vs 10–20 yrs: controls: MD: 10.10, 95% CI: 4.22, 15.98>20 yrs exposed vs >20 yrs control: MD: 7.80, 95% CI: 3.62, 11.98 | 553(6 observational studies) | ⊕○○○VERY LOW ¶ |
| Heart rate – cohort assessed with: exposure to occupational noise | MD 8.91 bpm higher (95% CI 1.71 higher to 16.1 higher) | 913(4 observational studies) | ⊕○○○VERY LOW # |
| Heart rate – case-control assessed with: exposure to railway noise | [139]: area under curve of heart rate; 36 trains/night vs 20 trains/night Low vibration 36 trains (real) vs low vibration 20 trains (real): MD: 35.50, 95% CI: –26.44, 97.44 Low vibration 36 trains (fake) vs low vibration 20 trains (fake): MD: 4.80, 95% CI: –35.39, 44.99High vibration 36 trains (real) vs high vibration 20 trains (real) : MD: 32.90, 95% CI: –14.13, 79.93 High vibration 36 trains (fake) vs high vibration 20 trains (fake): MD: 9.60, 95% CI: –22.60, 41.80 | 24(1 observational study) | ⊕○○○VERY LOW †,||,** |
| Heart rate – cross-sectional assessed with: exposure to ambient noise | [143]:With each 1 dBA increase in Leq SD increased: 0.5bpm, 95% CI: 0.04, 0.9 | 22(1 observational study) | ⊕○○○VERY LOW ||,†† |
| Heart rate – cohort assessed with: exposure to ambient noise | [29]:Social (room conversation) vs Social (hall conversation): MD: 3.20, 95% CI: –9.59, 15.99 Ambient (environmental sounds) vs Ambient (background sound): MD: 4.00, 95% CI: –8.68, 16.68[144]:Leq ≥ 65 dBA vs Leq < 65 dBA: MD: 5.70, 95% CI: 5.31, 6.09 | 130(2 observational studies) | ⊕○○○VERY LOW †,||,‡‡ |
| Heart rate – cohort assessed with: exposure to lab-simulated noise | [137]:Music (85 dBA in fetus) vs control: MD: 6.86, 95% CI: –2.82, 16.54 Voice (74 dBA in fetus) vs control: MD: 5.72, 95% CI: –3.71, 15.16 | 20(1 observational study) | ⊕○○○VERY LOW †,||,$$ |
| Heart rate – clinical trial assessed with: exposure to lab-simulated noise | Noise 60 vs control: MD: 0.42, 95% CI: –0.92, 1.76[52,79,80,148] Noise 60 vs control: MD: 0.08, 95% CI: –1.74, 1.89[52,79] | 275(4 observational studies) | ⊕○○○VERY LOW †,||,|||| |
CI: confidence interval; GRADE, Grading of Recommendations, Assessment, Development, and Evaluation; MD: mean difference; NR: not reported; SPL: sound pressure level. GRADE Working Group grades of evidence. High certainty: We are very confident that the true effect lies close to that of the estimate of the effect. Moderate certainty: We are moderately confident in the effect estimate: The true effect is likely to be close to the estimate of the effect, but there is a possibility that it is substantially different. Low certainty: Our confidence in the effect estimate is limited: The true effect may be substantially different from the estimate of the effect. Very low certainty: We have very little confidence in the effect estimate: The true effect is likely to be substantially different from the estimate of the effect. Explanations *Critical concern with confounding. Moderate concern with measurement of exposure. Serious concerns with missing data and measurement of outcome. †Concerns with imprecision because the 95% CI cannot exclude the potential for harm. ‡Moderate concerns with measurement of exposure and missing data. $Critical concerns with confounding, measurement of exposure, missing data and measurement of outcome. ||Concerns for imprecision since a small sample included does not meet the optimal information size and suggests fragility of the estimate. ¶Critical concern with confounding and measurement of outcome. Moderate concern with exposure assessment. Serious concern with missing data. #Critical concern with confounding. Moderate concerns with measurement of exposure, missing data and measurement of outcome. **Critical concern with confounding. Moderate concern with missing data. ††Moderate concern with measurement of exposure and missing data. Serious concern with measurement of outcome. ‡‡Critical concern with confounding. Concerns for imprecision because the small sample included does not meet the optimal information size and suggests the fragility of the estimate. ||||Critical concern with confounding. Moderate concern with missing data. Serious concern with measurement of outcome.
Across the studies, it was found that exposure to higher levels of road traffic, railway, air traffic, ambient, or laboratory-simulated noise may have little to no effect on heart rate [Figure 15], but the evidence was very uncertain. Among cohort studies (n = 4), it was found that exposure to higher levels of occupational noise may increase heart rate (MD: 8.91 bpm, 95% CI: 1.71, 16.10; very low CoE) [Figure 15].
Figure 15.

Forest plot of various noise exposures and mean difference in heart rate (in bpm). MD, a mean difference. *Pooled effect estimate presented as MD with lower and upper 95% confidence limits.
Cardiac arrhythmia
Two studies were identified that reported on the impact of noise exposure on cardiac arrhythmia (Tables S15 and S16).[155,156] As shown in Table 5, there was very low CoE for the effects of increased noise exposure on cardiac arrhythmia, owing to concerns with risk of bias and imprecision.
Table 5.
Summary of findings for noise exposure and cardiac arrhythmia
| Outcomes | Relative or absolute effects(95% CI) | No. of participants(studies) | Certainty of the evidence(GRADE) | ||
|---|---|---|---|---|---|
| Cardiac arrhythmia – cohort assessed with: exposure to road traffic noise | [155]: HR for atrial fibrillation 23-y mean, Lden <48 dBA: ref 23-y mean, Lden 48–58 dBA: 0.96, 95% CI: 0.85, 1.09 23-y mean, Lden >58 dBA: 0.99, 95% CI: 0.86, 1.15 23-y mean, Lden per 10 dBA: 1.0, 95% CI: 0.93, 1.06 23-y mean, Lden >53 per 10 dBA: 1.0, 95% CI: 0.88, 1.23 23-y mean, Lden >58 per 10 dBA: 1.01, 95% CI: 0.81, 1.26[156]: IRR for atrial fibrillation Lden max – 10-year average, per 10 dBA: 1.00, 95% CI: 0.99, 1.01 | 3,628,496(2 observational studies) | ⊕○○○VERY LOW *,† | ||
| Cardiac arrhythmia – cohort assessed with: exposure to railway noise | [156]: IRR for atrial fibrillation Lden max – 10-year average, per 10 dBA: 1.01, 95% CI: 1.00, 1.02 | 3,604,968(1 observational study) | ⊕○○○VERY LOW *,† | ||
| Cardiac arrhythmia – cohort assessed with: exposure to aircraft noise | [156]: IRR for atrial fibrillation Aircraft, <45 dBA: reference Aircraft, 45–49 dBA: 1.01, 95% CI: 0.98, 1.04 Aircraft, 50–54 dBA: 1.02, 95% CI: 0.99, 1.04 Aircraft, 55–59 dBA: 1.06, 95% CI: 0.00, 1.12 Aircraft, ≥60 dBA: 1.04, 95% CI: 0.93, 1.15 | 3,604,968(1 observational study) | ⊕○○○VERY LOW *,† | ||
CI: confidence interval; GRADE, Grading of Recommendations, Assessment, Development, and Evaluation; IRR: incidence rate ratio. GRADE Working Group grades of evidence. High certainty: We are very confident that the true effect lies close to that of the estimate of the effect. Moderate certainty: We are moderately confident in the effect estimate: The true effect is likely to be close to the estimate of the effect, but there is a possibility that it is substantially different. Low certainty: Our confidence in the effect estimate is limited: The true effect may be substantially different from the estimate of the effect. Very low certainty: We have very little confidence in the effect estimate: The true effect is likely to be substantially different from the estimate of the effect. Explanations: *Moderate concern with confounding and missing data. †Concerns with imprecision because the 95% CI cannot exclude the potential for meaningful benefit or harm.
Exposure to the road, railway, or aircraft noise may have little to no effect on the risk of atrial fibrillation; however, the evidence was very uncertain.
Vascular resistance
Two studies were identified that reported on the impact of noise exposure on vascular resistance, as measured by plethysmography and by peripheral vascular resistance from mean blood pressure and cardiac output (Tables S18 and S19).[147,151] As shown in Table 6, there was very low CoE for the effects of increased noise exposure on vascular resistance, owing to concerns with the risk of bias and imprecision.
Table 6.
Summary of findings for noise exposure and vascular resistance
| Outcomes | Relative or absolute effects (95% CI) | No. of participants (studies) | Certainty of the evidence (GRADE) |
|---|---|---|---|
| Vascular resistance – clinical trial assessed with: exposure to lab-simulated noise | [147]:90 dBA (steady) vs 80 dBA (steady): MD: –160.0 dyne-sec/cm5, 95% CI: –210.53, –109.47 100 dBA (steady) vs 80 dBA (steady): MD: –67.0 dyne × sec/cm^5, 95% CI: –115.50, –18.50 90 dBA (intermittent) vs 80 dBA (intermittent): MD: 43.0 dyne × sec/cm^5, 95% CI: 8.33, 77.67 100 dBA (intermittent) vs 80 dBA (intermittent): MD: 20.0 dyne × sec/cm^5, 95% CI: –13.12, 53.12 | 22 (1 observational study) | ⊕○○○VERY LOW *,† |
| Vascular resistance – cohort assessed with: exposure to lab-simulated noise | [151]:Railway (junior) noise vs control: MD: 30.31, 95% CI: 9.18, 51.44 Railway (senior) noise vs control: MD: 31.34, 95% CI: 15.31, 47.37 Quiet (junior) noise vs control: MD: 30.10, 95% CI: 15.92, 44.28 Quiet (senior) noise vs control: MD: 20.84, 95% CI: 0.33, 41.35 | 40 (1 observational study) | ⊕○○○ VERY LOW †,‡,$ |
CI: confidence interval; GRADE, Grading of Recommendations, Assessment, Development, and Evaluation; MD: mean difference. GRADE Working Group grades of evidence. High certainty: We are very confident that the true effect lies close to that of the estimate of the effect. Moderate certainty: We are moderately confident in the effect estimate: The true effect is likely to be close to the estimate of the effect, but there is a possibility that it is substantially different. Low certainty: Our confidence in the effect estimate is limited: The true effect may be substantially different from the estimate of the effect. Very low certainty: We have very little confidence in the effect estimate: The true effect is likely to be substantially different from the estimate of the effect. Explanations *Serious concern with confounding and missing data. Moderate concern with measurement of outcome. †Concerns with imprecision since the 95% CI cannot exclude the potential for meaningful benefit or harm. The small sample included does not meet the optimal information size and suggests fragility of the estimate. ‡Serious concern with confounding. $Junior refers to young subjects (26.2 years ± 3.6) and senior refers to middle-aged subjects (56.2 years ± 4.2).
Exposure to levels of steady-state laboratory-simulated road traffic noise higher than 80 dBA may decrease peripheral vascular resistance; however, the evidence was very uncertain. The exposure to higher levels of steady-state laboratory-simulated railway noise may increase peripheral vascular resistance compared with lower levels of lab-simulated noise; however, the evidence was very uncertain.
Cardiac output
One study reported on cardiac output in relation to noise exposure, as measured by the product of heart rate and stroke volume, estimated using lead II electrocardiogram configuration and transthoracic admittance plethysmography [Tables S21 and S22].[147] In this observational study, exposure to levels of steady-state laboratory-simulated road traffic noise higher than 80 dBA was associated with a significant increase in cardiac output; however, the certainty in the evidence was very low due to concerns with risk of bias and imprecision [Table 7].[147]
Table 7.
Summary of findings for noise exposure and cardiac output
| Outcomes | Relative or absolute effects (95% CI) | No. of participants (studies) | Certainty of the evidence (GRADE) |
|---|---|---|---|
| Cardiac output – Clinical trial assessed with: lab-simulated road traffic noise | [147]:90 dBA (steady) vs 80 dBA (steady): MD: 0.60 L/min, 95% CI: 0.37, 0.83 100 dBA (steady) vs 80 dBA (steady): MD: 0.20 L/min, 95% CI: 0.08, 0.32 90 dBA (intermittent) vs 80 dBA (intermittent): MD: –0.20 L/min, 95% CI: –0.41, 0.01 100 dBA (intermittent) vs 80 dBA (intermittent): MD: 0.30 L/min, 95% CI: –0.04, 0.64 | 22 (1 observational study) | ⊕○○○VERY LOW *,† |
CI: confidence interval; GRADE, Grading of Recommendations, Assessment, Development, and Evaluation; MD: mean difference. GRADE Working Group grades of evidence. High certainty: We are very confident that the true effect lies close to that of the estimate of the effect. Moderate certainty: We are moderately confident in the effect estimate: The true effect is likely to be close to the estimate of the effect, but there is a possibility that it is substantially different. Low certainty: Our confidence in the effect estimate is limited: The true effect may be substantially different from the estimate of the effect. Very low certainty: We have very little confidence in the effect estimate: The true effect is likely to be substantially different from the estimate of the effect. Explanations: *Serious concerns with confounding and missing data. Moderate concern with measurement of outcome. †Concerns with imprecision since the 95% CI for the intermittent comparisons cannot exclude the potential for no meaningful difference or the potential for harm. The small sample included does not meet the optimal information size and suggests fragility of the estimate.
DISCUSSION
Statement of the principal findings
This systematic review identified a large body of evidence reporting on short- and long-term cardiovascular biomarkers that are relevant to the biological stress response and the potential mechanisms through which noise may result in adverse chronic health effects. The certainty in the evidence for an effect of increased noise on these outcomes was very low due to concerns with risk of bias, inconsistency across exposure sources, populations, and studies, imprecision in the effects of estimates, and the inability to compare across the totality of the evidence for each outcome. However, this review highlights a need for further research to explore the effect of noise on adverse cardiovascular outcomes, including examining how differences in the type of exposure (e.g., source, duration, level) and the particular outcomes of interest may influence the relationship.
There may be signals of increased response to a higher noise threshold or incrementally higher levels of noise for outcomes of cardiac output, vascular response, hypertension, blood pressure, and heart rate. However, the CoE was very low across different exposure sources and noise levels, which makes it difficult to draw firm conclusions about the relationship between higher levels of noise and adverse health effects.
Strengths and limitations of the study
This systematic review was based on a comprehensive literature search and followed rigorous and transparent methods for analyzing and assessing the certainty of the evidence. A granular risk of bias instrument, developed for the assessment of studies of exposures, was used to assess individual studies. However, even after using this instrument, the studies differed greatly in how they defined and measured exposure to noise, which likely introduced exposure misclassification into the meta-analysis while grouping studies. While we assessed the influence of different exposures in our risk of bias assessment and separately analyzed by type of noise exposure, heterogeneity was still high in most analyses. Similarly, for the outcome of hypertension, substantial heterogeneity reduced our certainty of pooled estimates and in some cases limited our ability to create a pooled estimate using meta-analytic techniques. This reduced our ability to statistically explore the role of risk of bias through subsequent sensitivity analyses to determine the extent of the bias introduced by concerns with confounding and other domains. Similarly, there were no subgroup analyses performed as stated a priori in the protocol, as sufficient studies were not available. We recognize the inability to assess publication bias, due to insufficient studies, as a limitation of our review. We also recognize that results may have differed if we had separated by setting (e.g., blood pressure in children at school versus home, type of occupational setting, etc.). Additionally, this review does not include all potential adverse outcomes of exposure to noise as it was not intended to be an exhaustive review of all potential adverse outcomes.
Relation to other studies
Similar to the review by van Kempen et al., owing to a large number of cross-sectional studies, as well as concerns with risk of bias, this review also identified low to very low evidence for the outcomes of interest.[3] A difference between our review and the review by van Kempen et al. is that this review also focuses on short-term biomarkers, such as heart rate and vascular resistance, whereas the review by van Kempen focused on long-term cardiovascular effects, including ischemic heart disease, stroke, diabetes, and obesity.
A review by Teixera et al., exploring the effect of occupational exposure to noise on ischemic heart disease, stroke, and hypertension, found low certainty of evidence for the effect, whereas this review rated the evidence as very low certainty.[8] This may be due to the use of different approaches to rate the certainty of evidence, as this review used the GRADE approach and Teixera et al. used the Navigation Guide approach. While both methods assess the body of evidence using the GRADE domains, the initial CoE level applied to the body of evidence from observational studies assessed within Navigation Guide starts at Moderate, whereas in GRADE the initial certainty starts at Low.[157] Furthermore, the review by Teixera et al. reported that based on three cohort studies, workers exposed to ≥85 dBA had a 7% higher risk of acquiring hypertension (RR = 1.07, 95% CI: 0.90–1.28).[8] This review reported a 31% increased risk of hypertension for every 10-dBA increase in occupational noise, and this discrepancy may be due to the differences in the populations, as well as the measurement of the exposure and outcome.
Exploration into the quantification of residual confounding in reviews of environmental and occupational health is ongoing, recognizing that while small relative effect sizes are not uncommon within this field, at the population level, contextually, they may have a large effect.[158,159] Instead of the conventional GRADE thresholds of large or very large effects for reviews of interventions (relative risk of >2 or >5) to determine the magnitude of effect needed to increase certainty in the effect estimate, advances in these methods propose calculating an e-value, a measure related to the evidence for causality in observational studies, and exploring the size of residual confounding (i.e., confounding that remains after controlling for confounders) in the analysis to determine if it could still bias the effect estimate.[159,160]
Meaning of the study: possible explanations and implications for stakeholders
Findings from this review may be used to explore the effects of noise exposure on cardiovascular outcomes as well as direct further research in areas with limited evidence on the relationship between noise exposure and cardiovascular outcomes (e.g., wind turbines). Findings from this review may also be used to inform guidelines and policy decisions.
Unanswered questions and future research
Findings from some of the more robust outcomes, such as hypertension, may inform whether noise abatement or mitigation interventions would meaningfully improve health outcomes for this population. However, for many noise sources (e.g., wind turbines or rail), additional research is needed to understand the effects of exposure. Even though many studies were identified for some noise exposures (e.g., occupational), additional research is needed to investigate how noise is associated with cardiovascular outcomes (e.g., in terms of duration, intensity, timing of exposure), especially in nonoccupational settings. Concerns with included studies were largely due to the lack of adjustments for critical confounders, as well as differences in the measurement of the noise exposure and outcome. Measurement of noise exposure and sources of exposure varied across studies and many outcomes such as blood pressure require multiple measurements at different time points to confirm the outcome measure.
The mammalian stress responses are hardwired systems that have evolved over millennia to promote adaptation and survival.[1] Their variation in response to an internal or external challenge is typically protective and only expected to induce pathology if sustained at levels outside the normal physiological range or when dysregulated. While there remains a high level of uncertainty in the evidence linking noise exposure to cardiovascular diseases, this review clearly demonstrates that the strength of evidence is weak for all outcomes evaluated. Other factors exert a far greater influence on cardiovascular health, not all of which can be readily accounted for, which contributes to inconsistency in study findings and presents a challenge to designing studies that aim to evaluate the contribution from noise alone. Nevertheless, it remains conceivable that repeated exposure to noise may, when combined with other stressors and/or personality characteristics, poor coping strategies, absent social support, previous experience, poor diet, and genetic predisposition, increase Type 2 allostatic load,[2] where overload would be suggested by pathology in several of the biomarkers evaluated here and others not included (e.g., immune responses). Future research in this area would benefit greatly from standardization in research methodology, which at a minimum would include adequate control for personal and situational variables that may confound an association between exposure to noise and changes in biomarkers that may contribute to pathological outcomes. It is reasonable to speculate that this would be more likely, but not definite, if the noise was repeatedly experienced as highly annoying and an established cause of an ongoing sleep disturbance, as both responses suggest an inability to cope with noise.
CONFLICTS OF INTEREST
There are no conflicts of interest.
ACKNOWLEDGMENTS
We thank Skye Bickett for constructing the search strategies.
This review was funded by Health Canada under contract no. 4500414567 with Rebecca Morgan.
REFERENCES
- 1.Anisman H. Stress and Your Health: From Vulnerability to Resilience. West Sussex: Wiley; 2015. [Google Scholar]
- 2.McEwen BS, Wingfield JC. The concept of allostasis in biology and biomedicine. Horm Behav. 2003;43:2–15. doi: 10.1016/s0018-506x(02)00024-7. [DOI] [PubMed] [Google Scholar]
- 3.van Kempen E, Casas M, Pershagen G, Foraster M. WHO environmental noise guidelines for the European region: a systematic review on environmental noise and cardiovascular and etabolic effects: a summary. Int J Environ Res Public Health. 2018;15:379. doi: 10.3390/ijerph15020379. [DOI] [PMC free article] [PubMed] [Google Scholar]
- 4.An R, Wang J, Ashrafi SA, Yang Y, Guan C. Chronic noise exposure and adiposity: a systematic review and meta-analysis. Am J Prev Med. 2018;55:403–11. doi: 10.1016/j.amepre.2018.04.040. [DOI] [PubMed] [Google Scholar]
- 5.Wenning F, Chao W, Li Z, et al. Association between exposure to noise and risk of hypertension: a meta-analysis of observational epidemiological studies. J Hypertens. 2017;35:2358–66. doi: 10.1097/HJH.0000000000001504. [DOI] [PubMed] [Google Scholar]
- 6.Dzhambov AM, Dimitrova DD. Children’s blood pressure and its association with road traffic noise exposure - A systematic review with meta-analysis. Environ Res. 2017;152:244–55. doi: 10.1016/j.envres.2016.10.024. [DOI] [PubMed] [Google Scholar]
- 7.Teixeira LR, Pega F, de Abreu W, et al. The prevalence of occupational exposure to noise: a systematic review and meta-analysis from the WHO/ILO Joint Estimates of the Work-related Burden of Disease and Injury. Environ Int. 2021;154:106380. doi: 10.1016/j.envint.2021.106380. [DOI] [PMC free article] [PubMed] [Google Scholar]
- 8.Teixeira LR, Pega F, Dzhambov AM, et al. The effect of occupational exposure to noise on ischaemic heart disease, stroke and hypertension: a systematic review and meta-analysis from the WHO/ILO Joint Estimates of the Work-Related Burden of Disease and Injury. Environ Int. 2021;154:106387. doi: 10.1016/j.envint.2021.106387. [DOI] [PMC free article] [PubMed] [Google Scholar]
- 9.Babisch W. The Noise/stress concept, risk assessment and research needs. Noise Health. 2002;4:1–11. [PubMed] [Google Scholar]
- 10.Münzel T, Schmidt FP, Steven S, Herzog J, Daiber A, Sørensen M. Environmental noise and the cardiovascular system. J Am Coll Cardiol. 2018;71:688–97. doi: 10.1016/j.jacc.2017.12.015. [DOI] [PubMed] [Google Scholar]
- 11.Münzel T, Kröller-Schön S, Oelze M, et al. Adverse cardiovascular effects of traffic noise with a focus on nighttime noise and the new WHO noise guidelines. Annu Rev Public Health. 2019;41:309–28. doi: 10.1146/annurev-publhealth-081519-062400. [DOI] [PubMed] [Google Scholar]
- 12.Moher D, Liberati A, Tetzlaff J, Altman DG. Preferred reporting items for systematic reviews and meta-analyses: the PRISMA statement. BMJ. 2009;339 [PMC free article] [PubMed] [Google Scholar]
- 13.Greenland S, Longnecker MP. Methods for trend estimation from summarized dose-response data, with applications to meta-analysis. Am J Epidemiol. 1992;135:1301–9. doi: 10.1093/oxfordjournals.aje.a116237. [DOI] [PubMed] [Google Scholar]
- 14.Crippa A, Orsini N. Dose-response meta-analysis of differences in means. BMC Med Res Methodol. 2016;16:91. doi: 10.1186/s12874-016-0189-0. [DOI] [PMC free article] [PubMed] [Google Scholar]
- 15.DerSimonian R, Laird N. Meta-analysis in clinical trials. Control Clin Trials. 1986;7:177–88. doi: 10.1016/0197-2456(86)90046-2. [DOI] [PubMed] [Google Scholar]
- 16.Brink M, Schäffer B, Pieren R, Wunderli JM. Conversion between noise exposure indicators Leq(24h), L(Day), L(Evening), L(Night), L(dn) and L(den): principles and practical guidance. Int J Hyg Environ Health. 2018;221:54–63. doi: 10.1016/j.ijheh.2017.10.003. [DOI] [PubMed] [Google Scholar]
- 17.Rothman K GS, Lash TL. Modern Epidemiology. 3rd. Philadelphia, PA: Lippincott Williams & Wilkins; 2008. [Google Scholar]
- 18.Viechtbauer W. Conducting meta-analyses in R with the metafor package. J Stat Softw. 2010;36:1–48. [Google Scholar]
- 19.Team RC. R: A language and environment for statistical computing. Vienna, Austria: R Foundation for Statistical Computing; 2020. [Google Scholar]
- 20.Boutron I PM, Higgins JPT, Altman DG, Lundh A, Hróbjartsson A.
- 21.Higgins JP, Altman DG, Gøtzsche PC, et al. The Cochrane Collaboration’s tool for assessing risk of bias in randomised trials. BMJ. 2011;343:d5928. doi: 10.1136/bmj.d5928. [DOI] [PMC free article] [PubMed] [Google Scholar]
- 22.Morgan RL, Thayer KA, Santesso N, et al. A risk of bias instrument for non-randomized studies of exposures: a users’ guide to its application in the context of GRADE. Environ Int. 2019;122:168–84. doi: 10.1016/j.envint.2018.11.004. [DOI] [PMC free article] [PubMed] [Google Scholar]
- 23.Guyatt G, Oxman AD, Akl EA, et al. GRADE guidelines: 1. Introduction-GRADE evidence profiles and summary of findings tables. J Clin Epidemiol. 2011;64:383–94. doi: 10.1016/j.jclinepi.2010.04.026. [DOI] [PubMed] [Google Scholar]
- 24.Alimohammadi I, Kanrash FA, Vosoughi S, et al. Relationship between noise annoyance and high blood pressure in workers exposed to chronic noise among the workers of an automotive industry. Indian J Occup Environ Med. 2020;24:153–6. doi: 10.4103/ijoem.IJOEM_259_19. [DOI] [PMC free article] [PubMed] [Google Scholar]
- 25.Aro S. Occupational stress, health-related behavior, and blood pressure: a 5-year follow-up. Prev Med. 1984;13:333–48. doi: 10.1016/0091-7435(84)90025-2. [DOI] [PubMed] [Google Scholar]
- 26.Attarchi M, Dehghan F, Safakhah F, Nojomi M, Mohammadi S. Effect of exposure to occupational noise and shift working on blood pressure in rubber manufacturing company workers. Ind Health. 2012;50:205–13. doi: 10.2486/indhealth.ms1321. [DOI] [PubMed] [Google Scholar]
- 27.Attarchi M, Golabadi M, Labbafinejad Y, Mohammadi S. Combined effects of exposure to occupational noise and mixed organic solvents on blood pressure in car manufacturing company workers. Am J Ind Med. 2013;56:243–51. doi: 10.1002/ajim.22086. [DOI] [PubMed] [Google Scholar]
- 28.Babisch W, Neuhauser H, Thamm M, Seiwert M. Blood pressure of 8–14 year old children in relation to traffic noise at home - results of the German Environmental Survey for Children (GerES IV) Sci Total Environ. 2009;407:5839–43. doi: 10.1016/j.scitotenv.2009.08.016. [DOI] [PubMed] [Google Scholar]
- 29.Baker CF, Garvin BJ, Kennedy CW, Polivka BJ. The effect of environmental sound and communication on CCU patients’ heart rate and blood pressure. Res Nurs Health. 1993;16:415–21. doi: 10.1002/nur.4770160605. [DOI] [PubMed] [Google Scholar]
- 30.Belojevic G, Jakovljevic B, Stojanov V, Paunovic K, Ilic J. Urban road-traffic noise and blood pressure and heart rate in preschool children. Environ Int. 2008;34:226–31. doi: 10.1016/j.envint.2007.08.003. [DOI] [PubMed] [Google Scholar]
- 31.Bergomi M, Rovesti S, Vivoli G. Biological response to noise and other physical stressors in places of entertainment. Public Health Rev. 1991;19:263–75. [PubMed] [Google Scholar]
- 32.Bloemsma LD, Gehring U, Klompmaker JO, et al. Green space, air pollution, traffic noise and cardiometabolic health in adolescents: the PIAMA birth cohort. Environ Int. 2019;131:104991. doi: 10.1016/j.envint.2019.104991. [DOI] [PubMed] [Google Scholar]
- 33.Carugno M, Imbrogno P, Zucchi A, et al. Effects of aircraft noise on annoyance, sleep disorders, and blood pressure among adult residents near the Orio al Serio International Airport (BGY), Italy. Med Lav. 2018;109:253–63. doi: 10.23749/mdl.v109i4.7271. [DOI] [PMC free article] [PubMed] [Google Scholar]
- 34.Chang T-Y, Hwang B-F, Liu C-S, et al. Occupational noise exposure and incident hypertension in men: a prospective cohort study. Am J Epidemiol. 2013;177:818–25. doi: 10.1093/aje/kws300. [DOI] [PubMed] [Google Scholar]
- 35.Chang TY, Lai YA, Hsieh HH, Lai JS, Liu CS. Effects of environmental noise exposure on ambulatory blood pressure in young adults. Environ Res. 2009;109:900–5. doi: 10.1016/j.envres.2009.05.008. [DOI] [PubMed] [Google Scholar]
- 36.Chen S, Ni Y, Zhang L, et al. Noise exposure in occupational setting associated with elevated blood pressure in China. BMC Public Health. 2017;17:107. doi: 10.1186/s12889-017-4050-0. [DOI] [PMC free article] [PubMed] [Google Scholar]
- 37.Chiu-Shong L, Li-Hao Y, Tzu-Yi Y, Bo-Ying B, Ta-Yuan C. Occupational noise frequencies and the incidence of hypertension in a retrospective cohort study. Am J Epidemiol. 2016;184:120–8. doi: 10.1093/aje/kwv333. [DOI] [PubMed] [Google Scholar]
- 38.D’Souza J, Weuve J, Brook RD, Evans DA, Kaufman JD, Adar SD. Long-term exposures to urban noise and blood pressure levels and control among older adults. Hypertension. 2021;78:1801–08. doi: 10.1161/HYPERTENSIONAHA.121.17708. [DOI] [PMC free article] [PubMed] [Google Scholar]
- 39.Dratva J, Phuleria HC, Foraster M, et al. Transportation noise and blood pressure in a population-based sample of adults. Environ Health Perspect. 2012;120:50–5. doi: 10.1289/ehp.1103448. [DOI] [PMC free article] [PubMed] [Google Scholar]
- 40.Dzhambov AM, Lercher P, Markevych I, Browning M, Rüdisser J. Natural and built environments and blood pressure of Alpine school children. Environ Res. 2022;204:111925. doi: 10.1016/j.envres.2021.111925. [DOI] [PubMed] [Google Scholar]
- 41.Dzhambov AM, Tokmakova MP, Gatseva PD, et al. Community noise exposure and its effect on blood pressure and renal function in patients with hypertension and cardiovascular disease. Folia Med. 2017;59:344–56. doi: 10.1515/folmed-2017-0045. [DOI] [PubMed] [Google Scholar]
- 42.Enoksson Wallas A, Eriksson C, Edstedt Bonamy A-K, et al. Traffic noise and other determinants of blood pressure in adolescence. Int J Hyg Environ Health. 2019;222:824–30. doi: 10.1016/j.ijheh.2019.04.012. [DOI] [PubMed] [Google Scholar]
- 43.Evrard AS, Lefèvre M, Champelovier P, Lambert J, Laumon B. Does aircraft noise exposure increase the risk of hypertension in the population living near airports in France? Occup Environ Med. 2017;74:123–9. doi: 10.1136/oemed-2016-103648. [DOI] [PubMed] [Google Scholar]
- 44.Fogari R, Zoppi A, Corradi L, et al. Transient but not sustained blood pressure increments by occupational noise. An ambulatory blood pressure measurement study. J Hypertens. 2001;19:1021–7. doi: 10.1097/00004872-200106000-00005. [DOI] [PubMed] [Google Scholar]
- 45.Foraster M, Basagaña X, Aguilera I, et al. Association of long-term exposure to traffic-related air pollution with blood pressure and hypertension in an adult population-based cohort in Spain (the REGICOR study) Environ Health Perspect. 2014;122:404–11. doi: 10.1289/ehp.1306497. [DOI] [PMC free article] [PubMed] [Google Scholar]
- 46.Foraster M, Künzli N, Aguilera I, et al. High blood pressure and long-term exposure to indoor noise and air pollution from road traffic. Environ Health Perspect. 2014;122:1193–200. doi: 10.1289/ehp.1307156. [DOI] [PMC free article] [PubMed] [Google Scholar]
- 47.Gupta S, Gulati S, Gupta G. Metabolic syndrome in female workers from a textile mill: effect of noise. Asian J Pharm Clin Res. 2017;10:400–2. [Google Scholar]
- 48.Gupta S, Malhotra V, Tripathi Y, Dev P. Blood pressure variations in textile mill middle-aged male workers exposed to noise. Natl J Physiol Pharm Pharmacol. 2017;7:491–6. [Google Scholar]
- 49.Halonen JI, Dehbi HM, Hansell AL, et al. Associations of night-time road traffic noise with carotid intima-media thickness and blood pressure: the Whitehall II and SABRE study cohorts. Environ Int. 2017;98:54–61. doi: 10.1016/j.envint.2016.09.023. [DOI] [PubMed] [Google Scholar]
- 50.Hamid TAA, Latif DA, Bakeer AH, Ibrahim AA, Nasef KA. The effect of light and noise on physiological parameters in a sample of preterm neonates in the neonatal intensive care of Cairo University Teaching Hospital. Iran J. Neonatol. 2021;12:81–8. [Google Scholar]
- 51.Haralabidis AS, Dimakopoulou K, Velonaki V, et al. Can exposure to noise affect the 24 h blood pressure profile? Results from the HYENA study. J Epidemiol Community Health. 2011;65:535–41. doi: 10.1136/jech.2009.102954. [DOI] [PubMed] [Google Scholar]
- 52.Herzog JSF, Hahad O, Mahmoudpour SH, et al. Acute exposure to nocturnal train noise induces endothelial dysfunction and pro-thromboinflammatory changes of the plasma proteome in healthy subjects. Basic Res Cardiol. 2019;114:46. doi: 10.1007/s00395-019-0753-y. [DOI] [PMC free article] [PubMed] [Google Scholar]
- 53.Hessel PA, Sluis-Cremer GK. Occupational noise exposure and blood pressure: longitudinal and cross- sectional observations in a group of underground miners. Arch Environ Health. 1994;49:128–34. doi: 10.1080/00039896.1994.9937466. [DOI] [PubMed] [Google Scholar]
- 54.Hirai A, Takata M, Mikawa M, et al. Prolonged exposure to industrial noise causes hearing loss but not high blood pressure: a study of 2124 factory laborers in Japan. J Hypertens. 1991;9:1069–73. doi: 10.1097/00004872-199111000-00014. [DOI] [PubMed] [Google Scholar]
- 55.Idzior-Walus B. Coronary risk factors in men occupationally exposed to vibration and noise. Eur Heart J. 1987;8:1040–6. doi: 10.1093/oxfordjournals.eurheartj.a062168. [DOI] [PubMed] [Google Scholar]
- 56.Ising H, Michalak R. Stress effects of noise in a field experiment in comparison to reactions to short term noise exposure in the laboratory. Noise Health. 2004;6:1–7. [PubMed] [Google Scholar]
- 57.Ising H, Rebentisch E, Poustka F, Curio I. Annoyance and health risk caused by military low-altitude flight noise. Int Arch Occup Environ Health. 1990;62:357–63. doi: 10.1007/BF00381365. [DOI] [PubMed] [Google Scholar]
- 58.Ji HL, Kang W, Seung RY, Choy N, Choong RL. Cohort study for the effect of chronic noise exposure on blood pressure among male workers in Busan, Korea. Am J Ind Med. 2009;52:509–17. doi: 10.1002/ajim.20692. [DOI] [PubMed] [Google Scholar]
- 59.Kalantary S, Dehghani A, Yekaninejad MS, Omidi L, Rahimzadeh M. The effects of occupational noise on blood pressure and heart rate of workers in an automotive parts industry. ARYA Atheroscler. 2015;11:215–19. [PMC free article] [PubMed] [Google Scholar]
- 60.Khosravipour M, Khosravi F, Ashtarian H, Rezaei M, Moradi Z, Mohammadi Sarableh H. The effects of exposure to different noise frequency patterns on blood pressure components and hypertension. Int Arch Occup Environ Health. 2020;93:975–82. doi: 10.1007/s00420-020-01545-2. [DOI] [PubMed] [Google Scholar]
- 61.Kluizenaar Y, Gansevoort RT, Miedema HME, Jong PE. Hypertension and road traffic noise exposure. J Occup Environ Med. 2007;49:484–92. doi: 10.1097/JOM.0b013e318058a9ff. [DOI] [PubMed] [Google Scholar]
- 62.Korotkov J, Varenikov I, Volkov A, Zaborski L, Szczepański C. The noise and functional disturbances of the cardio-vascular system in seamen. Bull Inst Marit Trop Med Gdynia. 1985;36:29–35. [PubMed] [Google Scholar]
- 63.Kupcikova Z, Fecht D, Ramakrishnan R, Clark C, Cai YS. Road traffic noise and cardiovascular disease risk factors in UK Biobank. Eur Heart J. 2021;42:2072–84. doi: 10.1093/eurheartj/ehab121. [DOI] [PMC free article] [PubMed] [Google Scholar]
- 64.Lang T, Fouriaud C, Jacquinet-Salord MC. Length of occupational noise exposure and blood pressure. Int Arch Occup Environ Health. 1992;63:369–72. doi: 10.1007/BF00386929. [DOI] [PubMed] [Google Scholar]
- 65.Lercher P, Evans GW, Widmann U. The ecological context of soundscapes for children’s blood pressure. J Acoust Soc Am. 2013;134:773–81. doi: 10.1121/1.4807808. [DOI] [PMC free article] [PubMed] [Google Scholar]
- 66.Li S, Fong DYT, Wong JYH, et al. Indoor nocturnal noise is associated with body mass index and blood pressure: a cross-sectional study. BMC Public Health. 2021;21:815. doi: 10.1186/s12889-021-10845-2. [DOI] [PMC free article] [PubMed] [Google Scholar]
- 67.Lin CY, Tsai PJ, Lin KY, et al. Will daytime occupational noise exposures induce nighttime sleep disturbance? Sleep Med. 2018;50:87–96. doi: 10.1016/j.sleep.2018.05.025. [DOI] [PubMed] [Google Scholar]
- 68.Liu J, Xu M, Ding L, et al. Prevalence of hypertension and noise-induced hearing loss in Chinese coal miners. J Thorac Dis. 2016;8:422–9. doi: 10.21037/jtd.2016.02.59. [DOI] [PMC free article] [PubMed] [Google Scholar]
- 69.Michalak R, Ising H, Rebentisch E. Acute circulatory effects of military low-altitude flight noise. Int Arch Occup Environ Health. 1990;62:365–72. doi: 10.1007/BF00381366. [DOI] [PubMed] [Google Scholar]
- 70.Michaud DS, Marro L, McNamee JP. Self-reported occupational noise exposure and cardiovascular disease in Canada: results from the Canadian Health Measures Survey. J Acoust Soc Am. 2021;150:990–1000. doi: 10.1121/10.0005588. [DOI] [PubMed] [Google Scholar]
- 71.Paunovic K, Belojevic G, Jakovljevic B. Blood pressure of urban school children in relation to road-traffic noise, traffic density and presence of public transport. Noise Health. 2013;15:253–60. doi: 10.4103/1463-1741.113521. [DOI] [PubMed] [Google Scholar]
- 72.Petri D, Licitra G, Vigotti MA, Fredianelli L. Effects of exposure to road, railway, airport and recreational noise on blood pressure and hypertension. Int J Environ Res Public Health. 2021;18:9145. doi: 10.3390/ijerph18179145. [DOI] [PMC free article] [PubMed] [Google Scholar]
- 73.Powazka E, Pawlas K, Zahorska-Markiewicz B, Zejda JE. A cross-sectional study of occupational noise exposure and blood pressure in steelworkers. Noise Health. 2002;5:15–22. [PubMed] [Google Scholar]
- 74.Radun J, Maula H, Rajala V, Scheinin M, Hongisto V. Speech is Special: The stress effects of speech, noise, and silence during tasks requiring concentration. Indoor Air. 2020;31:264–74. doi: 10.1111/ina.12733. [DOI] [PubMed] [Google Scholar]
- 75.Regecová V, Kellerová E. Effects of urban noise pollution on blood pressure and heart rate in preschool children. J Hypertens. 1995;13:405–12. [PubMed] [Google Scholar]
- 76.Rojek M, Rajzer MW, Wojciechowska W, et al. Relationship among long-term aircraft noise exposure, blood pressure profile, and arterial stiffness. J Hypertens. 2019;37:1350–8. doi: 10.1097/HJH.0000000000002060. [DOI] [PubMed] [Google Scholar]
- 77.Saha S, Gandhi A, Das S, Kaur P, Singh SH. Effect of noise stress on some cardiovascular parameters and audiovisual reaction time. Indian J Physiol Pharmacol. 1996;40:35–40. [PubMed] [Google Scholar]
- 78.Sancini A, Caciari T, Rosati MV, et al. Can noise cause high blood pressure? Occupational risk in paper industry. Clin Ter. 2014;165:e304–11. [PubMed] [Google Scholar]
- 79.Schmidt F, Kolle K, Kreuder K, et al. Nighttime aircraft noise impairs endothelial function and increases blood pressure in patients with or at high risk for coronary artery disease. Clin Res Cardiol. 2015;104:23–30. doi: 10.1007/s00392-014-0751-x. [DOI] [PMC free article] [PubMed] [Google Scholar]
- 80.Schmidt FP, Basner M, Kröger G, et al. Effect of nighttime aircraft noise exposure on endothelial function and stress hormone release in healthy adults. Eur Heart J. 2013;34:3508–14a. doi: 10.1093/eurheartj/eht269. [DOI] [PMC free article] [PubMed] [Google Scholar]
- 81.Siagian M, Basuki B, Kusmana D. High intensity interior aircraft noise increases the risk of high diastolic blood pressure in Indonesian Air Force pilots. Med J Indones. 2009;18:276–82. [Google Scholar]
- 82.Singh AP, Rai RM, Bhatia MR, Nayar HS. Effect of chronic and acute exposure to noise on physiological functions in man. Int Arch Occup Environ Health. 1982;50:169–74. doi: 10.1007/BF00378078. [DOI] [PubMed] [Google Scholar]
- 83.Sobotova L, Jurkovicova J, Stefanikova Z, Sevcikova L, Aghova L. Community response to environmental noise and the impact on cardiovascular risk score. Sci Total Environ. 2010;408:1264–70. doi: 10.1016/j.scitotenv.2009.12.033. [DOI] [PubMed] [Google Scholar]
- 84.Talbott E, Helmkamp J, Matthews K. Occupational noise exposure, noise-induced hearing loss, and the epidemiology of high blood pressure. Am J Epidemiol. 1985;121:501–14. doi: 10.1093/oxfordjournals.aje.a114028. [DOI] [PubMed] [Google Scholar]
- 85.Talbott EO, Gibson LB, Burks A, Engberg R, McHugh KP. Evidence for a dose-response relationship between occupational noise and blood pressure. Arch Environ Health. 1999;54:71–8. doi: 10.1080/00039899909602239. [DOI] [PubMed] [Google Scholar]
- 86.Thiesse L, Rudzik F, Kraemer JF, et al. Transportation noise impairs cardiovascular function without altering sleep: the importance of autonomic arousals. Environ Res. 2020;182:109086. doi: 10.1016/j.envres.2019.109086. [DOI] [PubMed] [Google Scholar]
- 87.Tomei F, De Sio S, Tomao E, et al. Occupational exposure to noise and hypertension in pilots. Int J Environ Health Res. 2005;15:99–106. doi: 10.1080/09603120500061534. [DOI] [PubMed] [Google Scholar]
- 88.Tomei F, Fantini S, Tomao E, Baccolo TP, Rosati MV. Hypertension and chronic exposure to noise. Arch Environ Health. 2000;55:319–25. doi: 10.1080/00039890009604023. [DOI] [PubMed] [Google Scholar]
- 89.Tomei F, Tomao E, Papaleo B, Baccolo TP, Alfì P. Study of some cardiovascular parameters after chronic exposure to noise. Int J Cardiol. 1991;33:393–9. doi: 10.1016/0167-5273(91)90068-z. [DOI] [PubMed] [Google Scholar]
- 90.Tomei F, Tomao E, Papaleo B, Baccolo TP, Cirio AM, Alfi P. Epidemiological and clinical study of subjects occupationally exposed to noise. Int J Angiol. 1995;4:117–21. [Google Scholar]
- 91.Tomei G, Sancini A, Tomei F, et al. Prevalence of systemic arterial hypertension electrocardiogram abnormalities, and noise-induced hearing loss in agricultural workers. Arch Environ Occup Health. 2013;68:196–203. doi: 10.1080/19338244.2012.701245. [DOI] [PubMed] [Google Scholar]
- 92.van Kempen E, van Kamp I, Fischer P, et al. Noise exposure and children’s blood pressure and heart rate: the RANCH project. Occup Environ Med. 2006;63:632–9. doi: 10.1136/oem.2006.026831. [DOI] [PMC free article] [PubMed] [Google Scholar]
- 93.Vangelova KK, Deyanov CE. Blood pressure and serum lipids in industrial workers under intense noise and a hot environment. Rev Environ Health. 2007;22:303–11. doi: 10.1515/reveh.2007.22.4.303. [DOI] [PubMed] [Google Scholar]
- 94.Virkkunen H, Härmä M, Kauppinen T, Tenkanen L. Shift work, occupational noise and physical workload with ensuing development of blood pressure and their joint effect on the risk of coronary heart disease. Scand J Work Environ Health. 2007;33:425–34. doi: 10.5271/sjweh.1170. [DOI] [PubMed] [Google Scholar]
- 95.Warembourg C, Nieuwenhuijsen M, Ballester F, et al. Urban environment during early-life and blood pressure in young children. Environ Int. 2021;146:106174. doi: 10.1016/j.envint.2020.106174. [DOI] [PubMed] [Google Scholar]
- 96.Wojciechowska W, Januszewicz A, Drożdż T, et al. Blood pressure and arterial stiffness in association with aircraft noise exposure: long-term observation and potential effect of COVID-19 lockdown. Hypertension. 2022;79:325–34. doi: 10.1161/HYPERTENSIONAHA.121.17704. [DOI] [PMC free article] [PubMed] [Google Scholar]
- 97.Wu TN, Ko YC, Chang PY. Study of noise exposure and high blood pressure in shipyard workers. Am J Ind Med. 1987;12:431–8. doi: 10.1002/ajim.4700120408. [DOI] [PubMed] [Google Scholar]
- 98.Yousefi Rizi HA, Hassanzadeh A. Noise exposure as a risk factor of cardiovascular diseases in workers. J Educ Health Promot. 2013;2:14. doi: 10.4103/2277-9531.112683. [DOI] [PMC free article] [PubMed] [Google Scholar]
- 99.Zamanian Z, Rostami R, Hasanzadeh J, Hashemi H. Investigation of the effect of occupational noise exposure on blood pressure and heart rate of steel industry workers. J Environ Public Health. 2013;2013:256060. doi: 10.1155/2013/256060. [DOI] [PMC free article] [PubMed] [Google Scholar]
- 100.Zhou F, Shrestha A, Mai S, et al. Relationship between occupational noise exposure and hypertension: a cross-sectional study in steel factories. Am J Ind Med. 2019;62:961–8. doi: 10.1002/ajim.23034. [DOI] [PubMed] [Google Scholar]
- 101.Zijlema W, Cai Y, Doiron D, et al. Road traffic noise, blood pressure and heart rate: pooled analyses of harmonized data from 88,336 participants. Environ Res. 2016;151:804–13. doi: 10.1016/j.envres.2016.09.014. [DOI] [PubMed] [Google Scholar]
- 102.Babisch W, Wolf K, Petz M, Heinrich J, Cyrys J, Peters A. Associations between traffic noise, particulate air pollution, hypertension, and isolated systolic hypertension in adults: the KORA study. Environ Health Perspect. 2014;122:495–8. doi: 10.1289/ehp.1306981. [DOI] [PMC free article] [PubMed] [Google Scholar]
- 103.Babisch W. Wölke G, Heinrich J, Straff W. Road traffic noise and hypertension - accounting for the location of rooms. Environ Res. 2014;133:380–7. doi: 10.1016/j.envres.2014.05.007. [DOI] [PubMed] [Google Scholar]
- 104.Baudin C, Lefèvre M, Babisch W, et al. The role of aircraft noise annoyance and noise sensitivity in the association between aircraft noise levels and hypertension risk: results of a pooled analysis from seven European countries. Environ Res. 2020;191:110179. doi: 10.1016/j.envres.2020.110179. [DOI] [PubMed] [Google Scholar]
- 105.Belli S, Sani L, Scarficcia G, Sorrentino R. Arterial hypertension and noise: a cross-sectional study. Am J Ind Med. 1984;6:59–65. doi: 10.1002/ajim.4700060109. [DOI] [PubMed] [Google Scholar]
- 106.Belojević GA, Jakovljević BD, Stojanov VJ, Slepčević VŽ, Paunović KŽ. Nighttime road-traffic noise and arterial hypertension in an urban population. Hypertens Res. 2008;31:775–81. doi: 10.1291/hypres.31.775. [DOI] [PubMed] [Google Scholar]
- 107.Bluhm GL, Berglind N, Nordling E, Rosenlund M. Road traffic noise and hypertension. Occup Environ Med. 2007;64:122–6. doi: 10.1136/oem.2005.025866. [DOI] [PMC free article] [PubMed] [Google Scholar]
- 108.Bodin T, Albin M, Ardö J, Stroh E, Stergren PO, Björk J. Road traffic noise and hypertension: results from a cross-sectional public health survey in southern Sweden. Environ Health. 2009;8:38. doi: 10.1186/1476-069X-8-38. [DOI] [PMC free article] [PubMed] [Google Scholar]
- 109.Chang TY, Beelen R, Li SF, et al. Road traffic noise frequency and prevalent hypertension in Taichung, Taiwan: a cross-sectional study. Environ Health. 2014;13:37. doi: 10.1186/1476-069X-13-37. [DOI] [PMC free article] [PubMed] [Google Scholar]
- 110.Chang TY, Liu CS, Young LH, Wang VS, Jian SE, Bao BY. Noise frequency components and the prevalence of hypertension in workers. Sci Total Environ. 2012;416:89–96. doi: 10.1016/j.scitotenv.2011.11.071. [DOI] [PubMed] [Google Scholar]
- 111.de Souza TCF, Périssé ARS, Moura M. Noise exposure and hypertension: investigation of a silent relationship. BMC Public Health. 2015;15:328. doi: 10.1186/s12889-015-1671-z. [DOI] [PMC free article] [PubMed] [Google Scholar]
- 112.Dimakopoulou K, Koutentakis K, Papageorgiou I, et al. Is aircraft noise exposure associated with cardiovascular disease and hypertension? Results from a cohort study in Athens, Greece. Occup Environ Med. 2017;74:830–7. doi: 10.1136/oemed-2016-104180. [DOI] [PubMed] [Google Scholar]
- 113.Eriksson C, Bluhm G, Hilding A, Ostenson CG, Pershagen G. Aircraft noise and incidence of hypertension--gender specific effects. Environ Res. 2010;110:764–72. doi: 10.1016/j.envres.2010.09.001. [DOI] [PubMed] [Google Scholar]
- 114.Falian AB, Kusnoputranto H. Relationship analysis of noise to hypertension on workers at pharmaceutical products factory X in 2018, Depok City, West Java Province. Indian J Public Health Res Dev. 2018;9:358–64. [Google Scholar]
- 115.Hwang BF, Chang TY, Cheng KY, Liu CS. Gene-environment interaction between angiotensinogen and chronic exposure to occupational noise contribute to hypertension. Occup Environ Med. 2012;69:236–42. doi: 10.1136/oemed-2011-100060. [DOI] [PubMed] [Google Scholar]
- 116.Inoue M, Laskar MS, Harada N. Cross-sectional study on occupational noise and hypertension in the workplace. Arch Environ Occup Health. 2005;60:106–10. doi: 10.3200/AEOH.60.2.106-110. [DOI] [PubMed] [Google Scholar]
- 117.Jarup L, Babisch W, Houthuijs D, et al. Hypertension and exposure to noise near airports: the HYENA study. Environ Health Perspect. 2008;116:329–33. doi: 10.1289/ehp.10775. [DOI] [PMC free article] [PubMed] [Google Scholar]
- 118.Li AL, Peng Q, Shao YQ, Fang X, Zhang YY. The interaction on hypertension between family history and diabetes and other risk factors. Sci Rep. 2021;11:4716. doi: 10.1038/s41598-021-83589-z. [DOI] [PMC free article] [PubMed] [Google Scholar]
- 119.Li W, Yi G, Chen Z, et al. Association of occupational noise exposure, bilateral hearing loss with hypertension among Chinese workers. J Hypertens. 2021;39:643–50. doi: 10.1097/HJH.0000000000002696. [DOI] [PubMed] [Google Scholar]
- 120.Li X, Dong Q, Wang B, Song H, Wang S, Zhu B. The influence of occupational noise exposure on cardiovascular and hearing conditions among industrial workers. Sci Rep. 2019;9:11524. doi: 10.1038/s41598-019-47901-2. [DOI] [PMC free article] [PubMed] [Google Scholar]
- 121.Lin Y-T, Chen T-W, Chang Y-C, Chen M-L, Hwang B-F. Relationship between time-varying exposure to occupational noise and incident hypertension: a prospective cohort study. Int J Hyg Environ Health. 2020;226:113487. doi: 10.1016/j.ijheh.2020.113487. [DOI] [PubMed] [Google Scholar]
- 122.Nawaz SK, Hasnain S. Noise induced hypertension and prehypertension in Pakistan. Bosn J Basic Med Sci. 2010;10:239–44. doi: 10.17305/bjbms.2010.2694. [DOI] [PMC free article] [PubMed] [Google Scholar]
- 123.Nawaz SK, Hasnain S. Effect of ACE polymorphisms on the association between noise and hypertension in a Pakistani population. J Renin Angiotensin Aldosterone Syst. 2011;12:516–20. doi: 10.1177/1470320310395799. [DOI] [PubMed] [Google Scholar]
- 124.Neghab M, Maddahi M, Rajaeefard AR. Hearing impairment and hypertension associated with long term occupational exposure to noise. Iran Red Crescent Med J. 2009;11:160–5. [Google Scholar]
- 125.Nserat S, Al-Musa A, Khader YS, Slaih AA, Iblan I. Blood pressure of Jordanian workers chronically exposed to noise in industrial plants. Int J Occup Med Environ Health. 2017;8:217–23. doi: 10.15171/ijoem.2017.1134. [DOI] [PMC free article] [PubMed] [Google Scholar]
- 126.Pedersen E. Health aspects associated with wind turbine noise—results from three field studies. Noise Control Eng J. 2011;59:47–53. [Google Scholar]
- 127.Pereira G, Brito J, Oliveira Maria J, Oliveira P. Urban noise exposure and cardiometabolic diseases: an exploratory cross-sectional study in Lisbon. Port. J Public Health. 2021;39:95–102. [Google Scholar]
- 128.Pyko A, Lind T, Mitkovskaya N, et al. Transportation noise and incidence of hypertension. Int J Hyg Environ Health. 2018;221:1133–41. doi: 10.1016/j.ijheh.2018.06.005. [DOI] [PubMed] [Google Scholar]
- 129.Rosenlund M, Berglind N, Pershagen G, et al. Increased prevalence of hypertension in a population exposed to aircraft noise. Occup Environ Med. 2001;58:769–73. doi: 10.1136/oem.58.12.769. [DOI] [PMC free article] [PubMed] [Google Scholar]
- 130.Sbihi H, Davies HW, Demers PA. Hypertension in noise-exposed sawmill workers: a cohort study. Occup Environ Med. 2008;65:643–6. doi: 10.1136/oem.2007.035709. [DOI] [PubMed] [Google Scholar]
- 131.Shin S, Li B, Oiamo TH, et al. Association between road traffic noise and incidence of diabetes mellitus and hypertension in Toronto, Canada: a population-based cohort study. J Am Heart Assoc. 2020;9:1–12. doi: 10.1161/JAHA.119.013021. [DOI] [PMC free article] [PubMed] [Google Scholar]
- 132.Wang D, Zhou M, Li W, et al. Occupational noise exposure and hypertension: the Dongfeng-Tongji Cohort Study. J Am Soc Hypertens. 2018;12:71–9. doi: 10.1016/j.jash.2017.11.001. [DOI] [PubMed] [Google Scholar]
- 133.Yu Y, Paul K, Arah OA, et al. Air pollution, noise exposure, and metabolic syndrome - a cohort study in elderly Mexican-Americans in Sacramento area. Environ Int. 2020;134:105269. doi: 10.1016/j.envint.2019.105269. [DOI] [PMC free article] [PubMed] [Google Scholar]
- 134.Yun B, Sim J, Jeong I, et al. Does severe subacute noise exposure increase risk of new onset hypertension beyond conventional risk factors? A 30 000 person-years cohort study. J Hypertens. 2021;40:588–95. doi: 10.1097/HJH.0000000000003052. [DOI] [PMC free article] [PubMed] [Google Scholar]
- 135.Zeeb H, Hegewald J, Schubert M, et al. Traffic noise and hypertension – results from a large case-control study. Environ Res. 2017;157:110–7. doi: 10.1016/j.envres.2017.05.019. [DOI] [PubMed] [Google Scholar]
- 136.Zhao YM, Zhang SZ, Selvin S, Spear RC. A dose response relation for noise induced hypertension. Br J Ind Med. 1991;48:179–84. doi: 10.1136/oem.48.3.179. [DOI] [PMC free article] [PubMed] [Google Scholar]
- 137.Al-Qahtani NH. Foetal response to music and voice. Aust N Z J Obstet Gynaecol. 2005;45:414–7. doi: 10.1111/j.1479-828X.2005.00458.x. [DOI] [PubMed] [Google Scholar]
- 138.Burns KN, Sun K, Fobil JN, Neitzel RL. Heart rate, stress, and occupational noise exposure among electronic waste recycling workers. Int J Environ Res Public Health. 2016;13:140. doi: 10.3390/ijerph13010140. [DOI] [PMC free article] [PubMed] [Google Scholar]
- 139.Croy I, Smith MG, Waye KP. Effects of train noise and vibration on human heart rate during sleep: an experimental study. BMJ Open. 2013;3:e002655. doi: 10.1136/bmjopen-2013-002655. [DOI] [PMC free article] [PubMed] [Google Scholar]
- 140.El Aarbaoui T, Chaix B. The short-term association between exposure to noise and heart rate variability in daily locations and mobility contexts. J Expo Sci Environ Epidemiol. 2020;30:383–93. doi: 10.1038/s41370-019-0158-x. [DOI] [PubMed] [Google Scholar]
- 141.Follenius M, Brandenberger G, Lecornu C, Simeoni M, Reinhardt B. Plasma catecholamines and pituitary adrenal hormones in response to noise exposure. Eur J Appl Physiol Occup Physiol. 1980;43:253–61. doi: 10.1007/BF00421839. [DOI] [PubMed] [Google Scholar]
- 142.Gitanjali B, Ananth R. Effect of acute exposure to loud occupational noise during daytime on the nocturnal sleep architecture, heart rate, and cortisol secretion in healthy volunteers. J Occup Health. 2003;45:146–52. doi: 10.1539/joh.45.146. [DOI] [PubMed] [Google Scholar]
- 143.Green A, Jones AD, Sun K, Neitzel RL. The association between noise, cortisol and heart rate in a small-scale gold mining community-A pilot study. Int J Environ Res Public Health. 2015;12:9952–66. doi: 10.3390/ijerph120809952. [DOI] [PMC free article] [PubMed] [Google Scholar]
- 144.Kraus U, Schneider A, Breitner S, et al. Individual daytime noise exposure during routine activities and heart rate variability in adults: a repeated measures study. Environ Health Perspect. 2013;121:607–12. doi: 10.1289/ehp.1205606. [DOI] [PMC free article] [PubMed] [Google Scholar]
- 145.Morrison WE, Haas EC, Shaffner DH, et al. Noise, stress, and annoyance in a pediatric intensive care unit. Crit Care Med. 2003;31:113–9. doi: 10.1097/00003246-200301000-00018. [DOI] [PubMed] [Google Scholar]
- 146.Sadeq RM, Qamhieh ZN, Ashqer LR. Effect of noise pollution on arterial blood pressure and heart pulse rate of workers in the hospitals of Nablus City-West bank. J Med Sci (Faisalabad, Pakistan) 2013;13:13640. [Google Scholar]
- 147.Sawada Y. Hemodynamic effects of short-term noise exposure. Comparison of steady state and intermittent noise at several sound pressure levels. Jpn Circ J. 1993;57:862–72. doi: 10.1253/jcj.57.862. [DOI] [PubMed] [Google Scholar]
- 148.Schmidt FP, Herzog J, Schnorbus B, et al. The impact of aircraft noise on vascular and cardiac function in relation to noise event number: a randomized trial. Cardiovasc Res. 2021;117:1382–90. doi: 10.1093/cvr/cvaa204. [DOI] [PMC free article] [PubMed] [Google Scholar]
- 149.Shoushtarian M, Weder S, Innes-Brown H, McKay CM. Assessing hearing by measuring heartbeat: the effect of sound level. PLoS One. 2019;14:e0212940. doi: 10.1371/journal.pone.0212940. [DOI] [PMC free article] [PubMed] [Google Scholar]
- 150.Tascanov MB, Havlioglu S, Tanriverdi Z, Gungoren F, Altiparmak İ H. Effect of noise on the electrocardiographic parameters. Int Arch Occup Environ Health. 2021;94:1397–403. doi: 10.1007/s00420-021-01676-0. [DOI] [PubMed] [Google Scholar]
- 151.Tassi P, Rohmer O, Schimchowitsch S, et al. Living alongside railway tracks: long-term effects of nocturnal noise on sleep and cardiovascular reactivity as a function of age. Environ Int. 2010;36:683–9. doi: 10.1016/j.envint.2010.05.001. [DOI] [PubMed] [Google Scholar]
- 152.Veljovic F, Burak S, Begic E, Masic I. Noise effect on blood pressure and heart rate - regression analysis in service of prediction. Acta Inform Med. 2019;27:162–6. doi: 10.5455/aim.2019.27.162-166. [DOI] [PMC free article] [PubMed] [Google Scholar]
- 153.Veternik M, Tonhajzerova I, Misek J, Jakusova V, Hudeckova H, Jakus J. The impact of sound exposure on heart rate variability in adolescent students. Physiol Res. 2018;67:695–702. doi: 10.33549/physiolres.933882. [DOI] [PubMed] [Google Scholar]
- 154.Wharrad HJ, Davis AC. Behavioural and autonomic responses to sound in pre-term and full-term babies. Br J Audiol. 1997;31:315–29. doi: 10.3109/03005364000000026. [DOI] [PubMed] [Google Scholar]
- 155.Andersen ZJ, Cramer J, Jørgensen JT, et al. Long-term exposure to road traffic noise and air pollution, and incident atrial fibrillation in the Danish Nurse Cohort. Environ Health Perspect. 2021;129:87002. doi: 10.1289/EHP8090. [DOI] [PMC free article] [PubMed] [Google Scholar]
- 156.Thacher JD, Poulsen AH, Hvidtfeldt UA, et al. Long-term exposure to transportation noise and risk for atrial fibrillation: a Danish nationwide cohort study. Environ Res. 2021:112167. doi: 10.1016/j.envres.2021.112167. [DOI] [PubMed] [Google Scholar]
- 157.Rooney AA, Cooper GS, Jahnke GD, et al. How credible are the study results? Evaluating and applying internal validity tools to literature-based assessments of environmental health hazards. Environ Int. 2016;92–93:617–29. doi: 10.1016/j.envint.2016.01.005. [DOI] [PMC free article] [PubMed] [Google Scholar]
- 158.Shimonovich M, Pearce A, Thomson H, Keyes K, Katikireddi SV. Assessing causality in epidemiology: revisiting Bradford Hill to incorporate developments in causal thinking. Eur J Epidemiol. 2021;36:873–87. doi: 10.1007/s10654-020-00703-7. [DOI] [PMC free article] [PubMed] [Google Scholar]
- 159.Verbeek J, Hoving J, Boschman J, Chong LY, Livingstone-Banks J, Bero L. Systematic reviews should consider effects from both the population and the individual perspective. Am J Public Health. 2021;111:820–5. doi: 10.2105/AJPH.2020.306147. [DOI] [PMC free article] [PubMed] [Google Scholar]
- 160.Guyatt GH, Oxman AD, Sultan S, et al. GRADE guidelines: 9. Rating up the quality of evidence. J Clin Epidemiol. 2011;64:1311–6. doi: 10.1016/j.jclinepi.2011.06.004. [DOI] [PubMed] [Google Scholar]