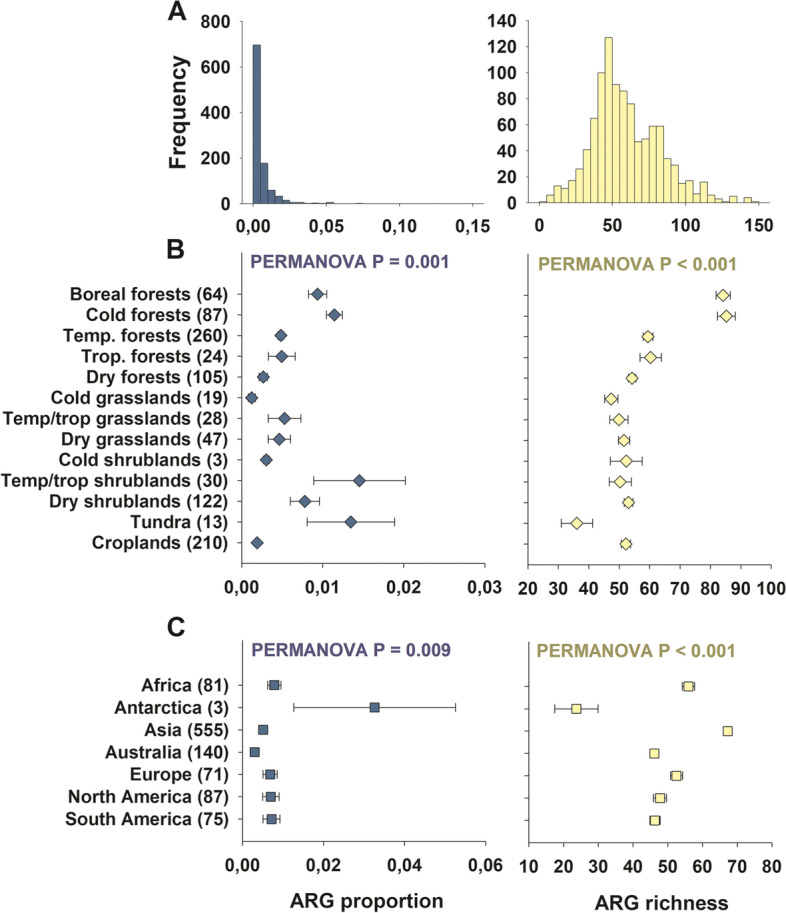
Fig. 2.

Proportion and richness of antibiotic resistance genes (ARGs) across global biomes and continents. A includes the distribution histogram for the proportion and richness of ARGs. B and C include the mean (± SE, number of sites/ecosystems in brackets) of the proportion and richness of soil ARGs across global biomes and continents, respectively. Each site is considered a statistical replicate in the PERMANOVA analyses. The proportion of ARGs was determined as the average standardized relative abundance of 285 individual ARGs. Details of the global biome classification can be found in Supplementary Table 2. Temp., temperate. Trop., tropical. We grouped our data to ensure high enough resolution for all ecosystem sub-types
