Abstract
This work reports the synthesis of an innovative multifunctional carbon nitride based adsorbent and its successful application for the removal of crystal violet (CV) and methylene blue (MB) from wastewater. The functionalized graphitic carbon nitride (f/g-CN) adsorbent was produced by the pyrolysis of melamine followed by thermal alkali treatment to introduce OH, NHx, and CN groups onto the graphitic carbon nitride (g-CN) surface. Experimental data obtained from batch tests revealed that the maximum adsorption capacities of g-CN and f/g-CN were found to be 28.9 and 239.0 mg g−1 for MB, and 163.0 and 532.0 mg g−1 for CV, respectively, at pH 8, 25 °C and after 90 min. This increase in adsorption capacity of f/g-CN can be explained by the presence of multiple functional groups in its structure. f/g-CN showed 100% removal for MB and CV with concentrations lower than 100 ppm and the equilibrium time required for the 100% removal of 500 ppb dye is 60 seconds. Additionally, the experimental data fitted well with the Langmuir isotherm model (R2 = 0.992) and pseudo second order kinetic model (R2 = 0.999) suggesting that the mechanism of adsorption is based on π–π stacking and electrostatic interactions between the NHx and OH groups of f/g-CN and dye molecules with monolayer formation. Moreover, a reusability test showed that the adsorption capacity remained at around 90% after 7 cycles. This work highlights the merits of the prepared adsorbent f/g-CN which is an eco-friendly, stable, efficient, and reusable adsorbent for removing cationic dyes from wastewater.
This work reports the synthesis of an innovative multifunctional carbon nitride based adsorbent and its successful application for the removal of crystal violet (CV) and methylene blue (MB) from wastewater.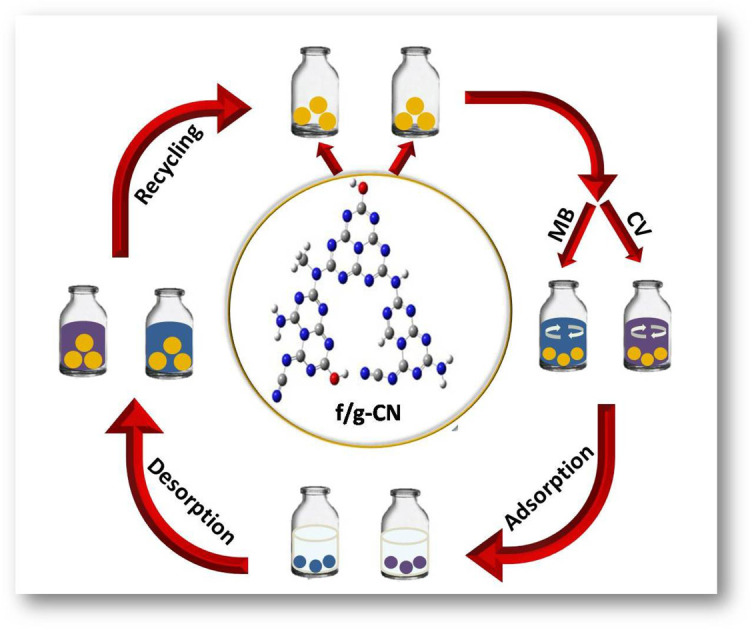
1. Introduction
Around the world, environmental and health concerns are growing related to the availability of clean water. The release of pollutants such as organic dyes into aquatic ecosystems is one of the undesirable consequences of some new technologies and industries1–3. Synthetic dyes are a major contributor to water pollution and are produced by a wide range of industries, including leather, textile, printing, cosmetics and pharmaceuticals4,5. Methylene blue and crystal violet are cationic water-soluble dyes with poor biodegradability4,5. As a result of this, these dyes remain in the environment for a long time, destroying natural ecosystems. Various studies have shown that ingestion of organic dyes can have harmful effects on human health, leading to disorders such as vomiting, irregular heartbeat, excessive sweating, gastritis, and chest pain4,5. Therefore, many studies focus on the removal of these dyes from wastewater. Membrane separation6,7, ultra-filtration8,9, chemical precipitation10, photo catalytic degradation5,11–13 and adsorption4,5,14,15 are some of the techniques that have been studied to remove color from industrial effluents with the aim of reducing their environmental impact. Among these listed methods, adsorption is considered one of the most promising and well-used methods for the removal of dyes from contaminated water due to its high efficiency, simple operating design and low-cost implementation. Carbon-based materials such as graphene (graphene oxide or modified graphene oxide)16,17, carbon nanotubes18, and biochar19 have been developed as efficient and inexpensive adsorbents owing to their high surface area and ability to generate various functional groups. New adsorbents need to be developed for more effective wastewater treatment.
Recently, graphitic carbon nitride (g-CN), a novel attractive 2D carbon-based adsorbent that can be prepared on a large scale by a facile thermal pyrolysis method from inexpensive precursors such as thiourea, urea, thiocyanate, and melamine14,20,21. In addition, graphitic carbon nitride is a promising material with broad applications in adsorption14, sensing22, catalysis23, bioimaging22, and drug delivery24 due to its high nitrogen functional groups (NH, C N, NH2)14,25,26. However, it has high chemical stability, excellent biocompatibility, non-toxicity and excellent optical properties; it has some drawbacks, such as poor surface area, limited adsorption capacity, and low absorption of visible light.14 On the other hand, g-CN can be modified by doping or covalent functionalization to develop novel adsorbents with excellent adsorption capacity and selectivity.3,14,21 The surface modification of g-CN also solves the problem of recycling and recovery.14 Recent theoretical and experimental studies confirm that surface functionalization on the graphitic carbon nitride sheets enhancing the surface area and the conjugation system in g-CN, which are important factors for organic dye adsorption. For example, poly(3-hexylthiophene) modified g-CN,27 polyaniline modified g-CN,25 carbon doped graphitic carbon nitride,3 and polyfluorene modified g-CN.14
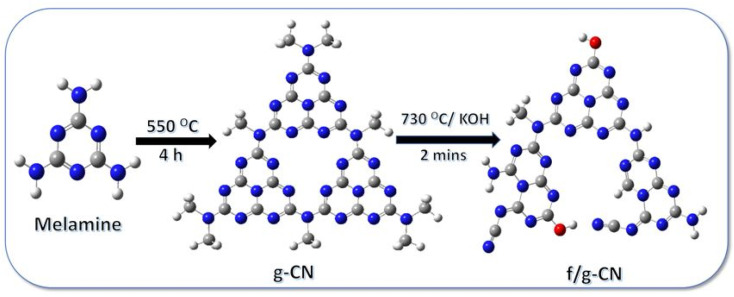
In the present work, we introduce a novel multifunctional carbon nitride based adsorbent (f/g-CN) for the effective removal of cationic dyes from water with a remarkable high capacity for CV. The design strategy of the f/g-CN is motivated by the grafting of the OH, NHx, CN groups onto the g-CN surface. The general procedure for the preparation of f/g-CN nanosheets is shown in Scheme 1, as this method involves the pyrolysis of melamine followed by thermal alkali treatment to introduce OH, NHx, CN groups on the graphitic carbon nitride (g-CN) surface. The main objectives of this study are to develop f/g-CN nanosheets with OH, NHx, and CN groups as an efficient adsorbent for systematical investigation on the adsorption process of CV and MB from wastewater, to provide detailed studies of the kinetics of the adsorption isotherms, and to demonstrate their simple regeneration for the practical large-scale applications for the removal of cationic dyes from polluted water.
Scheme 1. The general procedure for the preparation of f/g-CN.
2. Experimental section
For more details on the materials and characterization, see ESI S1 and S2† respectively.
2.1. Synthesis of surface functionalized graphitic carbon nitride (f/g-CN)
The pure g-CN was synthesized via polymerization of 2,4,6-triamino-1,3,5-triazine monomer under thermal chemical condensation as described previously in literature.28 In brief, 6.0 g of 2,4,6-triamino-1,3,5-triazine was put in a ceramic boat and covered with a lid, and then transferred to a muffle at polymerization temperature (550 °C) for 2 h in air conditions. Afterwards, the furnace was cooled down. The yellow product powder (g-CN) was only present in the ceramic boat. The modification of g-CN was conducted by rapid KOH treatment according to the following procedure. Briefly, 1 g of pure g-CN was fully mixed with 0.3 g of anhydrous KOH using mortar, transferred to ceramic boat and placed in a muffle at 730 °C for 2 min under air conditions. After that the ceramic boat was taken out quickly and cooled down to room temperature. The obtained pale brown powder (f/g-CN) was grinded and washed several times with distilled water till neutral and vacuum-dried at 60 °C. Finally, f/g-CN and g-CN powder were obtained and the production yield of f/g-CN and g-CN from melamine are 33.5%, and 39.0%, respectively.
2.2. Dye adsorption studies
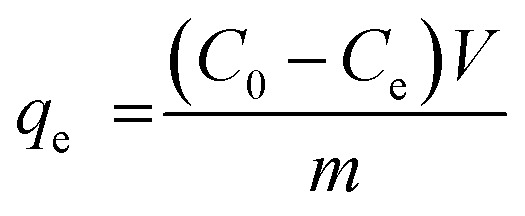
The removal of methylene blue and crystal violet dyes from aqueous solution using pure g-CN and f/g-CN were conducted by adding 0.05 g of g-CN or f/g-CN to a 50 mL of dye solution at desired initial concentration and optimum pH followed by shaking at 200 rpm for 90 min. All the experiments were conducted in dark to avoid any photocatalytic activity of carbon nitride based adsorbents. The effect of pH (2, 4, 6, 8 and 10) on dye removal was investigated at constant dye concentration (100 mg L−1 (MB), 200 mg L−1 (CV)), adsorbent dosage (1 g L−1), and agitation time (90 min). The mixture pH was adjusted using 0.1 M NaOH and 0.1 M HCl. The impact of dye concentration (0.5–800 mg L−1 (CV) and 0.5–600 mg L−1 (MB) was carried out at constant dosage (1 g L−1) and agitation time (90 min). The impact of contact time (5–240 min) was conducted at constant initial dye concentration (400 mg L−1 (MB), 500 μg L−1 (CV), and 600 mg L−1 (CV)) and adsorbent dose (1 g L−1). The influence of adsorbent dose (0.5–3 g L−1) was established at constant initial dye concentration (400 mg L−1 (MB), 600 mg L−1 (CV)) and agitation time (90 min). All the experiments were conducted at pH 8 (optimum pH). After each adsorption experiment, the adsorbent was separated by centrifugation and the remaining dye concentration was determined using UV-vis spectrophotometer (Chrom Tech-Co., Ltd., USA) at 664.0 nm and 590.0 nm for MB and CV, respectively. The following equation was used to determine the quantity of dye adsorbed (qe) and the percentage extracted.29 The equations listed below can be used to calculate % E:
 |
1 |
 |
2 |
where Ce and C0 (mg L−1) indicate the equilibrium and initial dye concentration, respectively. m (g) represents sample weight, and V refers to the volume of the dye solution (L).
2.2.1. Reusability study
To assess the potential reusability of the adsorbents, desorption studies were carried out using HCl. In a conical flask, 40 mL of 0.01 M HCl was agitated for 90 min with 0.04 g of the adsorbent (after each adsorption cycle). Filtration was used to separate the adsorbents. Distilled water was used to wash, and 0.3 M NaOH was used to neutralize the mixture. For additional adsorption trials, the regenerate adsorbent was used.
2.2.2. Real water samples
In order to evaluate the potential practical usage and efficiency of f/g-CN as an efficient and relatively inexpensive adsorbent, the removal of MB or CV (100 mg L−1) from various actual water samples, including domestic wastewater, Nile River water, and tap water were conducted. Water samples were collected from various places in Mansoura (Egypt). A cellulose membrane (0.45 μm) was used to filtrate the water samples and get rid of the solid contaminants. After that, standard solutions of MB or CV were spiked into the resulting water samples.
2.3. Simulation studies
Theoretical studies were applied through using density functional theory (DFT) of Gaussian 09 program package in the presence of a combination level of 6-311G (d to p) and (B3LYP) as exchange function for these computations to elucidate the adsorption mechanism of CV and MB dyes from wastewater at electronic scale on the basis of their expected quantum calculations.4,30–32
3. Results and discussion
3.1. Characterization of graphitic carbon nitride (g-CN) and functionalized graphitic carbon nitride (f/g-CN)
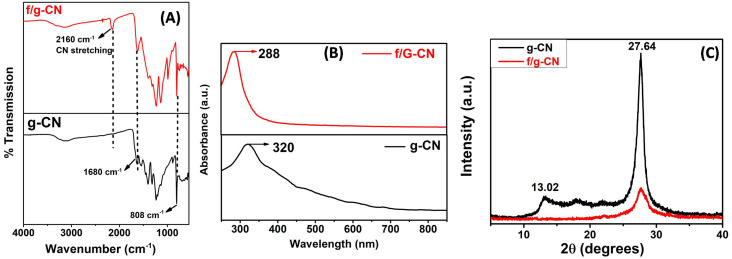
Graphitic carbon nitride and functionalized graphitic carbon nitride were characterized by different analytical techniques. FTIR analysis was conducted to investigate the effect of rapid alkali treatment on the chemical structure of g-CN and confirm the successful grafting of OH and NHx groups on the surface of f/g-CN (Fig. 1A). FTIR spectra of g-CN and f/g-CN had peaks in the region 1100–1700 cm−1 that were assigned to the stretching vibration of NCN cycles in the melon structure.33,34 Additionally, a characteristic peak at 808 cm−1 that was linked to the bending mode of triazine units.14 These results confirmed that the rapid alkali treatment of g-CN had no effect on the chemical structure of carbon nitride. Furthermore, both g-CN and f/g-CN had peaks at 300–3300 cm−1 that were related to the stretching vibration of NH2 groups.33 These peaks were weakened after thermal alkali treatment indicates the partial deprotonation of NH2 groups and the formation of NHx groups. On the other hand, the intensity of the peak at 3300–3550 cm−1, attributed to the stretching vibrations of the OH groups, was progressively increased after thermal alkali treatment confirming an increase in the number of OH groups on the surface of f/g-CN.33,35 Additionally, a new characteristic peak (at 2160 cm−1) was observed in the FTIR spectrum of f/g-CN that was related to the stretching vibration of cyano groups confirming the partial deprotonation of melon units after alkali treatment.33,36 These observations confirmed the successful incorporation of NHx, CN, OH groups onto surface of g-CN nanosheets upon thermal alkali treatment.
Fig. 1. (A) FTIR spectra of g-CN and f/g-CN. (B) UV-vis of g-CN and f/g-CN. (C) XRD patterns of g-CN, and f/g-CN.
Fig. 1B shows the UV-vis spectra of carbon nitride samples. The absorption bands of g-CN at 320 and 220 nm are associated with n–π* transitions of the conjugated heptazine ring system, and π–π* transition of triazine system.14 Whereas, f/g-CN's spectrum shows absorption bands between 220 and 288 nm. This 32 nm blue shifting suggests that the connection between C and N in the melon structure may be slightly weakened by the thermal alkali treatment. Therefore, the absorption band resulting from n–π* transition is reduced.14,37
The XRD patterns of g-CN and f/g-CN were measured from 2θ = 5–40 (Fig. 1C). The pure g-CN exhibited two characteristic peaks at 13.02° and 27.6° confirmed that it is in a crystalline form.14,38 The peak at 13.02° is attributed to the (100) interlayer stacking of repeated units (tri-s-triazine) with interlayer – stacking of 0.69 nm. The observed peak at 2θ = 27.64°, relates to the (002) diffraction planes of the graphite-like carbon nitride and the stacked conjugated aromatic system with interlayer stacking distance of 0.32 nm.3 After thermal alkali treatment, the intensity of this peak was diminished, indicating the exfoliation of g-CN layers and the partial decomposition of g-CN network with more defects confirming the successful grafting of –OH, CN and NHx groups onto the surface of f/g-CN.14,39
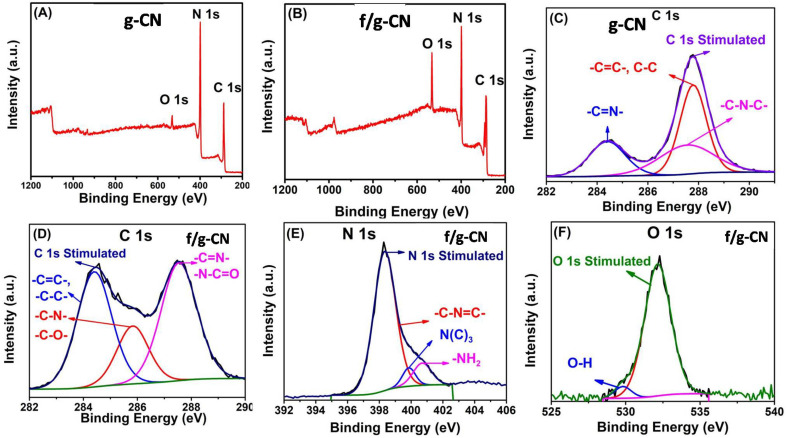
XPS was used to analyze the chemical state of the surface elements. The carbon nitride materials' XPS survey spectra in Fig. 2(A and B) demonstrate that C, N, and O were present in both g-CN and f/g-CN samples. The weak O 1s peak in the g-CN survey may be attributed to physically adsorbed H2O on the surface of the material.3 In contrast, the intensity of O 1s increased in the f/g-CN survey indicating the increase in the number of oxygen containing functional groups on f/g-CN surface upon thermal alkali treatment. Fig. 2C revealed that three peaks at 284.28, 287.4 and 287.8 eV can be observed in the C 1s spectrum of g-CN, and the peaks can be assigned to the C–C, C–N–C, and C N–, respectively. Whereas, the detailed XPS spectra of f/g-CN exhibited three peaks centered at 287.5, 285.4, 284.38 eV, that can be ascribed to (N–C O or –C N–), (C–N or C–O), and C–C, respectively (Fig. 2D).3,40,41 The grafting of the OH and CN, N–C O groups onto f/g-CN is also indicated by the N 1s (Fig. 2E) and O 1s (Fig. 2F). The O 1s spectrum is deconvolved into two peaks at 529.81 and 532.18 eV that can be related to H2O physically adsorbed onto carbon nitride sheets and –OH bonds, respectively.42 Additionally, the N 1s spectra of f/g-CN show three peaks at 400.7, 399.9, and 398.3 eV. These peaks can be attributed to the bonds –NH, N–(C)3, and C–N C, respectively.3,41,43 In addition, the surface elemental analysis including C, N and O are detected (Table S1†). The C content of f/g-CN (58.23%) is higher than g-CN (45.98%) and the O content of g-CN (2.62%) is lower than f/g-CN (11.55%). These results are consistent with FTIR and confirm the successful incorporation of OH and NHx groups onto f/g-CN nanosheets. According to the results obtained from FTIR and XPS, the role of KOH in the functionalization process can be summarized as follow: at 730 °C, fused kOH (melting point ≈ 360 °C) can release the –OH that may uptake proton from tri-s-triazine units of g-CN, resulting in the breakdown of the bond between N and C and then constructing the bonds between hydroxyl groups with unsaturated carbon. Moreover, the released –OH may react with amine groups to generate the cyano and –NHx groups.35
Fig. 2. XPS survey spectra of g-CN (A) and f/g-CN (B); high resolution XPS spectra of (C) C 1s (f/g-CN), (D) C 1s (g-CN), (E) N 1s (f/g-CN) and (F) O 1s (F).
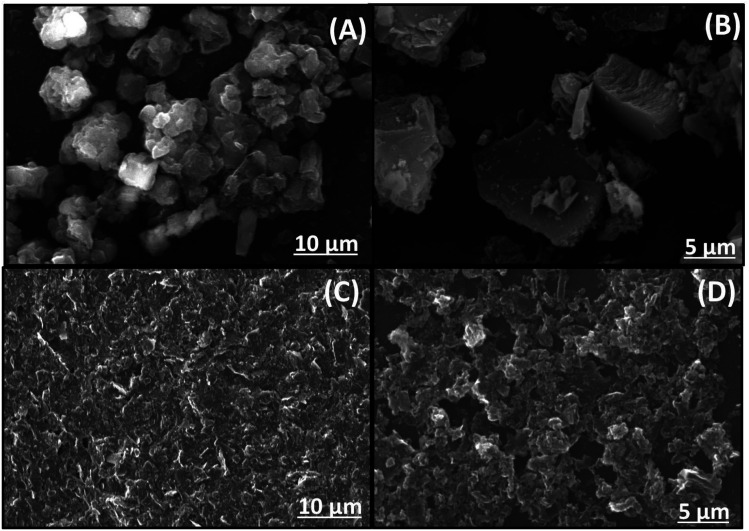
SEM pictures of the samples are shown in Fig. 3. A typical, block-like structure is clearly visible in the g-CN, as displayed in figure. On the other hand, f/g-CN exhibited lamellar structure and was made up of a lot of curved lamellar caused large sheets of graphitic carbon nitride to crack and exfoliate, increasing the surface area and the number of active sites on the carbon nitride sheets' surface.44
Fig. 3. SEM images of g-CN (A and B) and f/g-CN (C and D).
3.2. Dye adsorption studies
3.2.1. Effect of solution pH
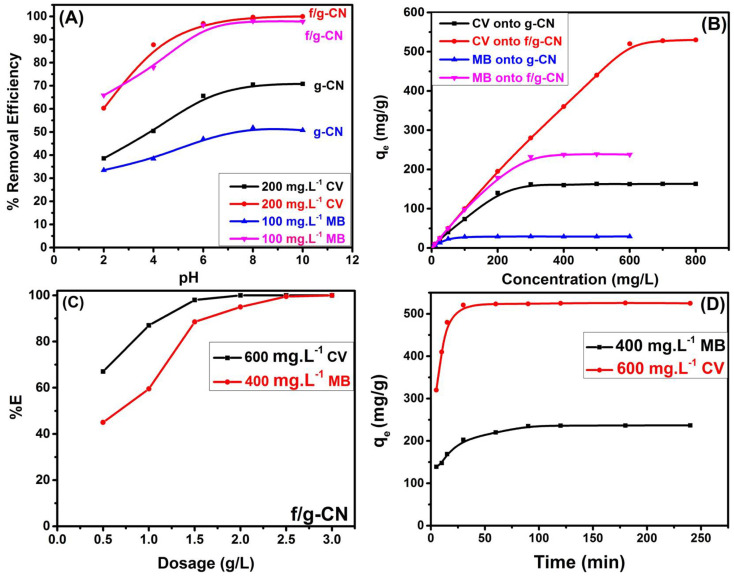
A series of batch adsorption tests were conducted to investigate the influence of the surrounding solution's pH (2–10) on the ability of carbon nitride-based materials to adsorb MB and CV from aqueous solution by affecting the adsorbent surface charge (protonation and deprotonation of the adsorbent functional groups).14 The impact of various pH values on the removal efficiency of MB and CV by pure and modified g-CN was presented in Fig. 4A. The results displayed that when the pH was raised from 2 to 10, the percentage of MB removal enhanced from 33.5% to 51.0% and from 65.88% to 98.0%, for g-CN and f/g-CN, respectively. In addition, the efficiency for CV removal increased from 38.56% to 70.8% and from 60.28% to 100.0% for g-CN, and f/g-CN, respectively. This can be attributed to the change in the electrostatic attraction between cationic dye (MB or CV) and the adsorbent functional groups.14,45 Since MB and CV are cationic dyes, any anionic functional group on the adsorbent surface can adsorb them. Since there are few functional groups in pure g-CN, there was no discernible change in the removal efficiency in the pH range = 2–10. On the other hand, the adsorption efficiency of dye by f/g-CN increased sharply, when the pH increased from 2 to 10. The OH and NHx groups in the f/g-CN were deprotonated at high pH conditions thereby increasing their ability to bind cationic dye molecules, explaining the increase of the adsorbed MB or CV at high pH. In contrast, when the pH decreased, protonation of the OH and NHx groups was increased and the electric charge mutual repulsion made cationic MB or CV dye hard to be adsorbed onto the f/g-CN.45,46 These results confirmed that the grafted OH and NHx groups on the surface of graphitic carbon nitride, via thermal alkali treatment, were the main binding site for dye adsorption.
Fig. 4. The adsorption efficiency of g-CN and f/g-CN as a function of (A) pH; (B) concentration; (C) adsorbent dosage and (D) contact time.
3.2.2. Effect of initial concentration and temperature
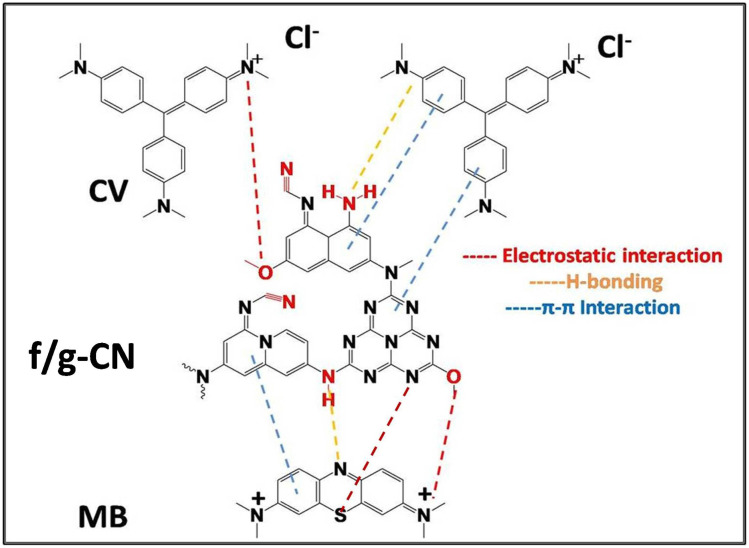
The impact of initial dye concentration on the adsorption potential of carbon nitride based adsorbents was conducted by varying dye concentration from 500 μg L−1 to 800.0 mg L−1 (CV) and from 500 μg L−1 to 600 mg L−1 (MB) at constant dosage (1 g L−1), agitation time (90 min) and pH 8. Fig. S1† displays the experimental results with 100% removal of dye molecules (MB or CV) from aqueous solution with initial concentration of 0.5–100 mg L−1 using f/g-CN. This may be due to the presence of low amount of dye molecules compared to the available active sites on functionalized graphitic carbon surface. Furthermore, Fig. 4B reveals that as the initial concentration increased from 0.5 to 600 mg L−1, the quantity of MB adsorbed at equilibrium increased from 0.5 to 28.9 mg g−1 (for pure g-CN) and from 0.5 to 239 mg g−1 (for f/g-CN). Whereas, the equilibrium adsorption capacities of pure g-CN and f/g-CN increased from 0.5 to 163.0 mg g−1 and from 0.5 to 532 respectively, when the initial concentration of CV dye increased from 0.5 to 800 mg L−1. This may be attributed to the increase in the diffusion rate of dye molecules as initial dye concentration increased. However, with a greater initial dye concentration, the number of active sites rapidly reduced with constant adsorbent dosage. This led to the adsorption capacity reaching stability. The results also showed that f/g-CN had better adsorption performance towards MB and CV than pure g-CN and other adsorbents described in the literature, indicating that π–π interactions (physical adsorption) between NCN heterocycles of f/g-CN and dye molecules and the electrostatic interaction (chemical adsorption) between dye molecules and the NHx, OH, CN groups on the f/g-CN surface are the primary factors of successful adsorption process as shown in Fig. 5.14 Therefore, f/g-CN can be used as an efficient adsorbent for removal of cationic dyes from wastewater. Fig. S2† demonstrates the correlation between temperature and the adsorption of MB and CV onto f/g-CN. As the temperature was raised from 298 K to 323 K, the maximum adsorption capacities for the removal of MB and CV by f/g-CN were increased from 239.0 to 270.0 mg g−1 and from 532.0 to 550.0 mg g−1, respectively, as shown in Fig. S2 (A) and (B).† Because the kinetic energy of dye molecules increases with temperature.47 The outcomes also showed that the endothermic nature of CV and MB's adsorption process.
Fig. 5. Proposed mechanism for the interaction between cationic dyes (MB, CV) and f/g-CN.
3.2.3. Effect of adsorbent dosage
The influence of f/g-CN dosage on the removal of MB and CV is presented in Fig. 4C. It is obvious that the percentage extracted (% E) of MB and CV using f/g-CN increased from 43.0% to 100.0% and from 67.0 to 100.0%, respectively, by increasing the f/g-CN dosage from 0.5 to 3.0 g L−1. This could be attributed to the availability of more adsorption sites and an increase in sorbent surface area. The removal efficiency was found to rise but the adsorption capacity to decrease as the adsorbent dose was raised. Due to particle aggregation, which reduces the overall surface area of the adsorbent, the adsorption capacity decreases as the adsorbent amount increases.43
3.2.4. Effect of contact time and kinetic studies
Fig. 4D displays the impact of stirring time on the extraction of MB (400 mg L−1, pH = 8) and CV (600 mg L−1, pH = 8) by f/g-CN adsorbent. The findings revealed that the rate of MB and CV adsorption increased with the increase of contact time. In the early stages (5 min), more than 59.0% and 62.0% of the maximum adsorption capacities of MB and CV respectively, were adsorbed onto f/g-CN, and then the adsorption rate gradually decreased until equilibrium. It was observed that a contact time of about 45 and 90 min were sufficient to reach the adsorption equilibrium of CV and MB, respectively. Due to the abundance and availability of more adsorption sites, the interaction of dye molecules with f/g-CN was easier in the first few minutes. On the other hand, the dye's tendency to gradually block adsorption sites on the adsorbent was followed by a slowing adsorption rate until reaching equilibrium and saturation.48 Additionally, Fig. S2(C)† showed that after 60 seconds of contact time, 500 μg L−1 of CV or MB were completely removed by f/g-CN adsorbent, showing the possibility of utilizing f/g-CN as an efficient adsorbent at low dye concentrations in polluted water.
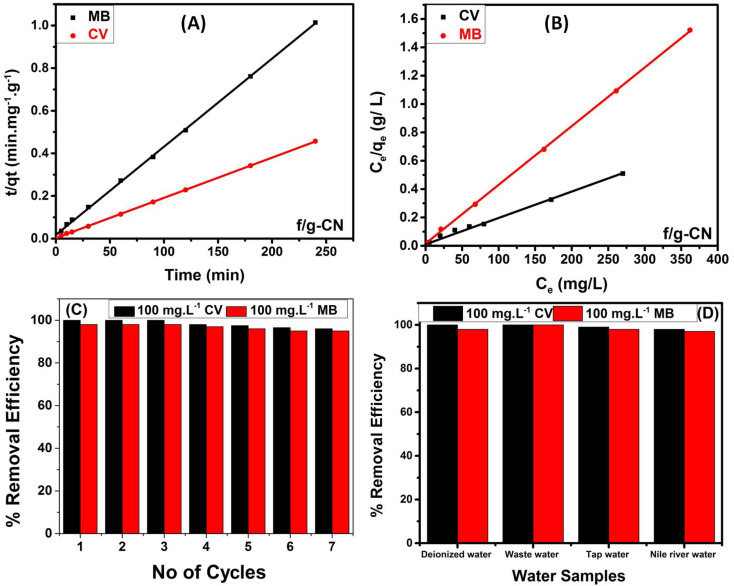
Moreover, the pseudo-first-order (PFO) and the pseudo-second order (PSO) kinetic models have both been extensively used to provide relevant data on the adsorption kinetics, and mechanism of MB and CV adsorption onto f/g-CN.43 For more details on the two models and the corresponding mathematical equations, see ESI (S3).† The PFO and PSO kinetic models for the MB and CV adsorption onto f/g-CN are shown in Fig. S3(A)† and 6A, respectively. Table 1 shows that the PSO model's (qe cal.) values agree with the experimental values (qe exp.). Furthermore, using the PSO model, the correlation coefficient (R2) was 0.999 (Table 1), which was much higher than that (R2 = 0.748) obtained using the PFO model, indicating that the adsorption of MB or CV onto f/g-CN obeys the PSO kinetics.43 Additionally, these results suggest that the removal process was controlled by electron transfer between the dye molecules (adsorbate) and the NHx, OH, CN groups on the f/g-CN surface (adsorbent).14
Fig. 6. (A) PSO kinetic model; (B) Langmuir adsorption isotherm model; (C) regeneration potential of f/g-CN adsorbent; (D) real water samples.
Kinetic parameters and isotherm parameters for the removal of MB and CV dye by f/g-CN.
| Dye | q e exp. (mg g−1) | PFO parameters | PSO parameters | ||||
|---|---|---|---|---|---|---|---|
| R 2 | q e,cal. (mg g−1) | K 1 (min−1) | R 2 | q e,cal. (mg g−1) | K 2 (g mol−1 min−1) | ||
| MB | 239.0 | 0.97 | 7.786 | 0.032 | 0.999 | 241.546 | 0.0009 |
| CV | 530.0 | 0.748 | 9.253 | 0.063 | 0.999 | 529.101 | 0.0013 |
| Dye | Q exp. (mg g−1) | Freundlich parameters | Langmuir parameters | ||||
|---|---|---|---|---|---|---|---|
| K f | R 2 | 1/n | Q max,fitted (mg g−1) | RL | b (L mg−1) | ||
| MB | 239.0 | 96.062 | 0.885 | 0.1734 | 241.55 | 0.007 | 0.251 |
| CV | 532.0 | 130.957 | 0.912 | 0.2745 | 537.63 | 0.006 | 0.172 |
3.2.5. Isotherm studies
The adsorption equilibrium study was performed using Langmuir and Freundlich isotherm models. For more details on the two models and the respective equations, see ESI (S4).† The Langmuir and Freundlich models for the MB and CV adsorption onto the representative sample f/g-CN are shown in Fig. 6B and S3(B),† respectively.3,49,50 Using the Langmuir model, the correlation coefficient (R2) was 0.999 (Table 1), which was much greater than that (R2 = 0.885) obtained using the Freundlich model. Furthermore, the adsorption capacity values of the Langmuir model were consistent with the experimental results described in Table 1. These findings revealed that MB and CV adsorption onto f/g-CN described well by the Langmuir model. The adsorption is homogenous with all active sites and further adsorption will not occur at sites occupied by MB or CV since the adsorption is uniform with all active sites leading to a monolayer process with no interactions between the dye molecules.3 Moreover, a favorable adsorption is characterized by RL values between 0 and 1.49
3.2.6. Reusability of f/g-CN adsorbent
Reusability is one of an adsorbent's most crucial characteristics since it affects its cost-effectiveness and long-term viability in industrial applications. 0.1 M HCl was as an eluent (desorbing agent) as mentioned in the Experimental section. Fig. 6C illustrates the results of the f/g-CN adsorbent's regeneration and reusability throughout 7 cycles. The efficiency of adsorption remained at approximately 90.0% after 7 cycles. These results revealed that f/g-CN adsorbent has the potential for commercial wastewater treatment applications with high efficiency and low-cost effectiveness.
3.2.7. Adsorption using real water samples
The removal of MB and CV (100 mg L−1) from actual water samples, including domestic sewage wastewater, tap water, and Nile River water, was carried out in order to assess the effectiveness and practical applicability of f/g-CN as an effective and cost-effective adsorbent. According to the results in Fig. 6D, the removal efficiency remained greater than 95%. However, the presence of various minerals, heavy metals (Zn2+, Hg2+, Pb2+, Cu2+, and Cd2+) and other pollutants in wastewater and river water.51 Additionally, it was also observed that the efficiency of removal was slightly higher for wastewater than for river and tap water owing to the high pH of wastewater leading to more deprotonated OH groups to bind the dye molecules. These results confirmed the feasibility of the f/g-CN for remediation of wastewater containing cationic dyes.
3.2.8. Comparing of f/g-CN capacity with various adsorbents for CV and MB
The maximum adsorption capacities of f/g-CN for MB and CV were compared with that of other of several reported adsorbents. Table S2† revealed the high ability of f/g-CN in adsorption of CV and MB from aqueous solution. The better adsorption performance of f/g-CN towards MB and CV than other adsorbents described in the literature, indicating that π–π interactions and electrostatic attraction by OH, NHx, and CN groups are the primary factors of successful adsorption process. Therefore; the f/g-CN can be considered as a top and an efficient adsorbent for commercial wastewater treatment applications, especially for the adsorption of cationic dyes.
4. Computational approaches
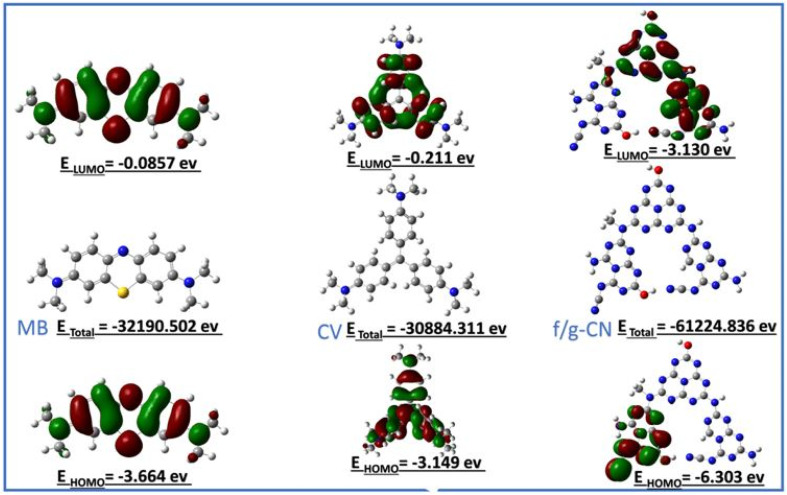
DFT calculations were performed to explore the adsorption mechanism of the both studied dyes and the relative contribution of (f/g-CN). As Frontier orbitals of HOMO/LUMO, as well as electron density charge distributions of the all components are presented in Fig. 7.
Fig. 7. Spatial distribution of calculated HOMO and LUMO orbitals and optimized geometries of the MB, CV and f/g-CN.
The LUMO/HOMO represent the lowest unoccupied and highest occupied molecular orbital energies, which control the chemical activity of the molecules. In the same context, LUMO acts as an electron acceptor representative the capability of molecule to acquire an electron, conversely, HOMO acts as an electron donor, is placed around donating heteroatom's and benzene rings, as in methylene blue, HOMO is localized a round nitrogen, sulfur and benzene rings. By contrast, the LUMO is mainly localized on the residual functional cyano and positively quaternary nitrogen (+NR4) groups indicating its capability of accepting charges which released by the cationic dyes.52 Notably, MB and CV dyes have the nearly geometries distribution of HOMO and LUMO orbitals, this phenomenon is attributed to tertiary amine groups and benzene rings which have accepting and donating abilities at the same time.4 For the (f/g-CN), its HOMO and LUMO distributions are completely different, due to large different distribution of azo groups on the surface of (f/g-CN). As in the HOMO, quinolizine moiety near functional groups like amino groups acts as electron donating. While, the presence of cyano group as auxiliary electron acceptor anchoring with conjugated naphthalene bridge can increase negative charge positions (nucleophilic centers) in the electron acceptor (LUMO side) of the (f/g-CN), led to increase the ability of (f/g-CN) to interact with CV dyes with electrostatic and hydrogen bonds to compensate the lower negative charge in the CV dye, and this postulate is compatible with explanation in adsorption mechanism between cationic dyes (MB, CV) and f/g-CN (Fig. 5).52
To examine the reactivity of the isolated presented geometries in Fig. 7, the electron density values of nucleophilic (electron donor) and electrophilic (electron acceptor) activities of each atom were observed. In the same context, charge distributions of all components were calculated to describe nucleophilic and electrophilic reactivity of each atom (Fig. S4†). According to Fig. S4,† the electrophilic centers in MB were concentrated mainly over sulfur atom and the carbon atom of C N function group suggesting that these centers are highly susceptible to being attacked by nucleophilic sites, as these sites could receive the electrons from filled atomic orbitals of f/g-CN (adsorbent). On the other hand, free lone pairs of nitrogen atoms and π electrons of aromatic carbons act as nucleophilic centers in f/g-CN, and have the capability to attack electrophilic centers in MB dye, this is reasonable explanation for the formed the electrostatic potential between sulfur atom in MB and secondary nitrogen atom in the f/g-CN according to postulate in (Fig. 5). In CV dye, the electrophilic centers are allocated on carbon atoms which directly attached with nitrogen atoms.
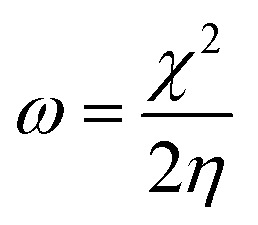
To gain a better understanding of the interaction between f/g-CN and each of MB and CV, global quantities like the electronegativity (χ) and electrophilicity (ω) were applied according to eqn (3), and (4) (ref. 53) to describe electron accepting and donating processes between f/g-CN and the tested dyes (Table S3†).
 |
3 |
 |
4 |
From Fig. 7, the functionalized graphitic carbon nitride (f/g-CN) adsorbent has the highest electron donating capability as it has the lowest EHOMO value (−6.303 eV), this fact means that f/g-CN has highly adsorption capability than MB (EHOMO = −3.664 eV) and CV (EHOMO = −3.149 eV). On the other hand, electronegativity (χ) index encompasses measuring the energy stabilization of dye when it acquires electron density. While, the electrophilicity (ω) factor is useful in explaining the capacity of an electrophile to receive electron density, the previous two facts we can conclude that there is slightly difference in electronegativity and electrophilicity between the MB and CV dyes (0.194 and 0.021, respectively) led to the nearly adsorption ability of each of two dyes by f/g-CN (Table S3†), and this result is compatible with the Experimental section.
5. Conclusions
In summary, a novel, functionalized graphitic carbon nitride (f/g-CN) was prepared from melamine by a thermal condensation polymerization, and then thermal alkali treatment to modify its surface. The successful grafting of OH, NHx, and CN onto the surface of f/g-CN was verified independently by FTIR, XRD, SEM, UV-vis, and XPS. The CV and MB adsorption on f/g-CN can be well described using a Langmuir model (R2 = 0.992) and PSO kinetic model (R2 = 0.999), and the maximum adsorption capacities recorded were 532 mg g−1 for CV and 239.0 mg g−1 for MB. The electrostatic interactions, π–π bulk interactions, and hydrogen-bonding interactions play a role in the adsorption of dyes. The adsorption/desorption experiments showed that the removal efficiency remained at around 90% after 7 cycles. Finally, the results documented in this study indicate that f/g-CN is a promising adsorbent with much potential to remove cationic dyes in wastewater.
Author contributions
Fathi S. Awad and Y. G. Abou El-Reash conceived the project, designed the experiments, analyzed the data, and wrote the paper. Nada M. Ghazy prepared and characterized the samples, performed the experiments, analyzed the data, and drafted the manuscript. Eslam A. Ghaith carried out the computational approaches, analyzed the data, and drafted the manuscript. Rania R. Zaky and Weam M. Abou El-Maaty contributed to the characterization of the samples. All authors read and approved the final form of the manuscript.
Conflicts of interest
There are no conflicts to declare.
Supplementary Material
Electronic supplementary information (ESI) available: Materials (S1). Characterization (S2). The PFO and PSO kinetic model equations (S3). The Langmuir and Freundlich isotherm models equations (S4). Dependence of the removal efficiency of CV and MB onto f/g-CN on the initial dye concentration (Fig. S1). Effect of temperature on MB and CV adsorption onto f/g-CN (Fig. S2(A) and (B)). Effect of contact time on the removal of 500 μg L−1 CV onto f/g-CN (Fig. S2(C)). PFO for dye adsorption onto f/g-CN (Fig. S3(A)). Linear form of Freundlich isotherm of MB and CV adsorption onto f/g-CN (Fig. S3(B)). Electron density charge distributions of the MB, CV and f/g-CN (Fig. S4). The elemental composition of g-CN and f/g-CN from XPS analysis (Table S1). The comparison of adsorption capacities of MB and CV through various adsorbents (Table S2). Electronegativity and electrophilicity of MB, CV, and f/g-CN (Table S3). See DOI: https://doi.org/10.1039/d2ra07032d
References
- Alizadeh N. Shariati S. Besharati N. Int. J. Environ. Res. 2017;11:197–206. [Google Scholar]
- Fernandes A. Almeida C. Menezes C. Debacher N. Sierra M. J. Hazard. Mater. 2007;144:412–419. doi: 10.1016/j.jhazmat.2006.10.053. [DOI] [PubMed] [Google Scholar]
- Ren B. Xu Y. Zhang L. Liu Z. J. Taiwan Inst. Chem. Eng. 2018;88:114–120. [Google Scholar]
- Hosseini H. Zirakjou A. McClements D. J. Goodarzi V. Chen W.-H. J. Hazard. Mater. 2022;421:126752. doi: 10.1016/j.jhazmat.2021.126752. [DOI] [PubMed] [Google Scholar]
- Martins L. R. Soares L. C. Gurgel L. V. A. Gil L. F. J. Hazard. Mater. 2022;424:127401. doi: 10.1016/j.jhazmat.2021.127401. [DOI] [PubMed] [Google Scholar]
- Lu X. Wang H. Chen J. Yang L. Hu T. Wu F. Fu J. Chen Z. Chem. Eng. J. 2022;433:133650. [Google Scholar]
- Bangari R. S. Yadav A. Bharadwaj J. Sinha N. J. Environ. Chem. Eng. 2022;10:107052. [Google Scholar]
- Zhao C. Ye Y. Chen X. Da X. Qiu M. Fan Y. Chin. J. Chem. Eng. 2022;41:267–277. [Google Scholar]
- Oyarce E. Butter B. Santander P. Sánchez J. J. Environ. Chem. Eng. 2021;9:106297. [Google Scholar]
- Wang Y. Zhang X. Hou C. Nano-Struct. Nano-Objects. 2018;16:250–257. [Google Scholar]
- Mahanta U. Khandelwal M. Deshpande A. S. Appl. Surf. Sci. 2022;576:151745. [Google Scholar]
- Gomaa H. Hussein M. A. Motawea M. M. Aboraia A. M. Cheira M. F. Alotaibi M. T. El-Bahy S. M. Ali H. M. Colloids Surf., A. 2022;644:128811. [Google Scholar]
- Fahoul Y. Tanji K. Zouheir M. El Mrabet I. Naciri Y. Hsini A. Nahali L. Kherbeche A. J. Mol. Struct. 2022;1253:132298. [Google Scholar]
- Sogut E. G. Emre D. Bilici A. Kilic N. C. Yilmaz S. Mater. Chem. Phys. 2022;290:126523. [Google Scholar]
- Qi X. Zeng Q. Tong X. Su T. Xie L. Yuan K. Xu J. Shen J. J. Hazard. Mater. 2021;402:123359. doi: 10.1016/j.jhazmat.2020.123359. [DOI] [PubMed] [Google Scholar]
- Sahoo S. K. Padhiari S. Biswal S. Panda B. Hota G. Mater. Chem. Phys. 2020;244:122710. [Google Scholar]
- Kaur K. Jindal R. Carbohydr. Polym. 2019;225:115245. doi: 10.1016/j.carbpol.2019.115245. [DOI] [PubMed] [Google Scholar]
- Ma J. Yu F. Zhou L. Jin L. Yang M. Luan J. Tang Y. Fan H. Yuan Z. Chen J. ACS Appl. Mater. Interfaces. 2012;4:5749–5760. doi: 10.1021/am301053m. [DOI] [PubMed] [Google Scholar]
- Sun P. Hui C. Azim Khan R. Du J. Zhang Q. Zhao Y.-H. Sci. Rep. 2015;5:1–12. doi: 10.1038/srep12638. [DOI] [PMC free article] [PubMed] [Google Scholar]
- Zheng Y. Jiao Y. Zhu Y. Cai Q. Vasileff A. Li L. H. Han Y. Chen Y. Qiao S.-Z. J. Am. Chem. Soc. 2017;139:3336–3339. doi: 10.1021/jacs.6b13100. [DOI] [PubMed] [Google Scholar]
- Fronczak M. Krajewska M. Demby K. Bystrzejewski M. J. Phys. Chem. C. 2017;121:15756–15766. [Google Scholar]
- Wang A. Wang C. Fu L. Wong-Ng W. Lan Y. Nano-Micro Lett. 2017;9:1–21. doi: 10.1007/s40820-017-0148-2. [DOI] [PMC free article] [PubMed] [Google Scholar]
- Lin Q. Li L. Liang S. Liu M. Bi J. Wu L. Appl. Catal., B. 2015;163:135–142. [Google Scholar]
- Shamim M. Perveen M. Nazir S. Hussnain M. Mehmood R. Khan M. I. Iqbal J. J. Mol. Liq. 2021;331:115607. [Google Scholar]
- Ottman N. Ruokolainen L. Suomalainen A. Sinkko H. Karisola P. Lehtimäki J. Lehto M. Hanski I. Alenius H. Fyhrquist N. J. Allergy Clin. Immunol. 2019;143:1198–1206. doi: 10.1016/j.jaci.2018.06.024. [DOI] [PubMed] [Google Scholar]
- Shen W. An Q.-D. Xiao Z.-Y. Zhai S.-R. Hao J.-A. Tong Y. Int. J. Biol. Macromol. 2020;148:1298–1306. doi: 10.1016/j.ijbiomac.2019.10.105. [DOI] [PubMed] [Google Scholar]
- Luo M. Gong H. Yang W. He F. Cao Y. Zhang Y. Zhang Y. Liu K. Cao H. Yan H. Int. J. Hydrogen Energy. 2019;44:7108–7117. [Google Scholar]
- Bakry A. M. Alamier W. M. El-Shall M. S. Awad F. S. J. Mater. Res. Technol. 2022;20:1456–1469. [Google Scholar]
- Awad F. S. AbouZeid K. M. El-Maaty W. M. A. El-Wakil A. M. El-Shall M. S. ACS Appl. Mater. Interfaces. 2017;9:34230–34242. doi: 10.1021/acsami.7b10021. [DOI] [PubMed] [Google Scholar]
- Hamama W. S. Ghaith E. A. Ibrahim M. E. Sawamura M. Zoorob H. H. ChemistrySelect. 2021;6:1430–1439. [Google Scholar]
- Abdallah A. Ghaith E. A. Mortada W. I. Molouk A. F. S. Food Chem. 2023;401:134058. doi: 10.1016/j.foodchem.2022.134058. [DOI] [PubMed] [Google Scholar]
- Ghaith E. A. Zoorob H. H. Ibrahim M. E. Sawamura M. Hamama W. S. ChemistrySelect. 2020;5:14917–14923. [Google Scholar]
- Liang X. Fan J. Liang D. Xu Y. Zhi Y. Hu H. Qiu X. J. Colloid Interface Sci. 2021;582:70–80. doi: 10.1016/j.jcis.2020.08.011. [DOI] [PubMed] [Google Scholar]
- Zhang G. Lin L. Li G. Zhang Y. Savateev A. Zafeiratos S. Wang X. Antonietti M. Angew. Chem. 2018;130:9516–9520. doi: 10.1002/anie.201804702. [DOI] [PubMed] [Google Scholar]
- Li Y. Xu H. Ouyang S. Lu D. Wang X. Wang D. Ye J. J. Mater. Chem. A. 2016;4:2943–2950. [Google Scholar]
- Awad F. S. AbouZied K. M. Bakry A. M. El-Maaty A. Weam M. El-Wakil A. M. El-Shall M. S. J. Mater. Sci. 2021;56:7982–7999. [Google Scholar]
- Ji Y. Qin C. Niu H. Sun L. Jin Z. Bai X. Dyes Pigm. 2015;117:72–82. [Google Scholar]
- Hang L. T. Lai N. D. Phuong N. T. Thang D. V. Hung N. M. Van Minh N. Phys. B. 2018;532:48–53. [Google Scholar]
- Yang S. Gong Y. Zhang J. Zhan L. Ma L. Fang Z. Vajtai R. Wang X. Ajayan P. M. Adv. Mater. 2013;25:2452–2456. doi: 10.1002/adma.201204453. [DOI] [PubMed] [Google Scholar]
- Dong G. Zhang L. J. Mater. Chem. 2012;22:1160–1166. [Google Scholar]
- Bakry A. M. Awad F. S. Bobb J. A. El-Shall M. S. ACS Omega. 2020;5:33090–33100. doi: 10.1021/acsomega.0c04695. [DOI] [PMC free article] [PubMed] [Google Scholar]
- Chen X. Zhang J. Fu X. Antonietti M. Wang X. J. Am. Chem. Soc. 2009;131:11658–11659. doi: 10.1021/ja903923s. [DOI] [PubMed] [Google Scholar]
- El-Wakil A. M. Waly S. M. Abou El-Maaty W. M. Waly M. M. Yılmaz M. Awad F. S. ACS Omega. 2022;7:6058–6069. doi: 10.1021/acsomega.1c06441. [DOI] [PMC free article] [PubMed] [Google Scholar]
- Wang Q. Zhang L. Guo Y. Shen M. Wang M. Li B. Shi J. Chem. Eng. J. 2020;396:125347. [Google Scholar]
- Jabar J. M. Odusote Y. A. Ayinde Y. T. Yılmaz M. Results Eng. 2022;14:100385. [Google Scholar]
- Saini B. Dey A. Mater. Today: Proc. 2022;61:342–350. [Google Scholar]
- Doğan M. Alkan M. Chemosphere. 2003;50:517–528. doi: 10.1016/s0045-6535(02)00629-x. [DOI] [PubMed] [Google Scholar]
- Alkan M. Doğan M. Turhan Y. Demirbaş Ö. Turan P. Chem. Eng. J. 2008;139:213–223. [Google Scholar]
- Bakry A. M. Alamier W. M. Salama R. S. El-Shall M. S. Awad F. S. Surf. Interfaces. 2022;31:102006. [Google Scholar]
- Awad F. S. AbouZied K. M. Abou El-Maaty W. M. El-Wakil A. M. El-Shall M. S. Arabian J. Chem. 2020;13:2659–2670. [Google Scholar]
- Goher M. E. Ali M. H. El-Sayed S. M. Egypt. J. Aquat. Res. 2019;45:301–312. [Google Scholar]
- Li H. Fang M. Hou Y. Tang R. Yang Y. Zhong C. Li Q. Li Z. ACS Appl. Mater. Interfaces. 2016;8:12134–12140. doi: 10.1021/acsami.6b00226. [DOI] [PubMed] [Google Scholar]
- Domingo L. R. Ríos-Gutiérrez M. Pérez P. Molecules. 2016;21:748. doi: 10.3390/molecules21060748. [DOI] [PMC free article] [PubMed] [Google Scholar]
Associated Data
This section collects any data citations, data availability statements, or supplementary materials included in this article.


