

Abstract
Advances in omic technologies have provided insight into cancer progression and treatment response. However, the nonlinear characteristics of cancer growth present a challenge to bridge from the molecular- to the tissue-scale, as tumor behavior cannot be encapsulated by the sum of the individual molecular details gleaned experimentally. Mathematical modeling and computational simulation have been traditionally employed to facilitate analysis of nonlinear systems. In this study, for the first time tumor metabolomic data are linked via mathematical modeling to the tumor tissue-scale behavior, showing the capability to mechanistically simulate cancer progression personalized to omic information obtainable from patient tumor core biopsy analysis. Generally, a higher degree of metabolic dysregulation has been correlated with more aggressive tumor behavior. Accordingly, key parameters influenced by metabolomic data in this model include tumor proliferation, vascularization, aggressiveness, lactic acid production, monocyte infiltration and macrophage polarization, and drug effect. The model enables evaluating interactions of interest between these parameters which drive tumor growth based on the metabolomic data. The results show that the model can group patients consistently with the clinically observed outcomes of response/non-response to chemotherapy. This modeling approach provides a first step towards evaluation of tumor growth based on tumor-specific metabolomic data.
Keywords: Metabolomics, cancer, personalized medicine, mathematical modeling, computational simulation
INTRODUCTION
The nonlinear response of an individual patient’s tumor to a chosen therapy continues to confound the treatment of cancer. Although therapy efficacy may have been proven for patients with tumors of similar type and stage, and may also have been customized to specific tumor genetic characteristics, e.g., BRCA mutation, there is no guarantee that any particular untreated tumor will favorably respond to the same treatment. A major reason is that the tumor response is influenced by the individual tumor cell and microenvironment conditions, as well as patient physiological and life conditions. In order to provide for more accurate outcomes, the ability to gauge and incorporate these conditions into treatment expectations is crucial. Due to the dysregulation of metabolism in cancer, metabolomics in particular has shown promise to provide critical information regarding cancer evaluation and prognosis7. Ideally, metabolomics coupled with other molecular information, such as genomics, transcriptomics, and proteomics would describe individual patient tumor conditions as a set of “signals” that reflect individual tumor conditions. However, the amount of data generated by such analyses is large, and can be difficult to interpret43.
To tackle this challenge, mathematical modeling and computational techniques have been employed to study the nonlinear behavior of tumors. Advances in metabolomics and mathematical modeling, as well as in the estimation of model parameter values based on metabolome data were reviewed in67, focusing on metabolic reaction networks and kinetic models. The role of mathematical modeling in attaining an enhanced understanding of cancer metabolic reprogramming as well as to identify potential therapeutic interventions was recently reviewed49. In particular, Wnt signaling has been linked via mathematical modeling to metabolism patterns in colon cancer33.Although metabolism at the cellular scale has been modeled, (e.g.,50, 62, 63), along with the associated networks82, it has been challenging to link the metabolic to the tissue scale.
Part of the challenge lies in linking metabolomic measurements to mathematical model parameters. A model system designed to simulate tumor behavior would ideally provide sufficient dynamic range to represent various biological conditions while also translating biological measurements into (usually dimensionless) model parameters. In this study, a model system is constructed to mechanistically bridge from patient tumor metabolomic measurements to mathematical model parameters. As proof of concept, the model parameters are calibrated to simulate the progression of lung tumors. Biologically relevant models must include an adequate number of parameters to provide useful predictions. We propose a set of parameters which represent an adequate number to simulate tumor growth based on metabolomic data. The ultimate goal is for such a system to serve as a prognostic tool by projecting tumor behavior into future time, so that the response to particular treatment modalities could be evaluated and selected for efficacy prior to patient administration.
MATERIALS AND METHODS
Vascularized Tumor Growth
We use a tumor growth component based on a 2D continuum representation of tissue, as described in41, 79 while the angiogenesis component represents blood vessels as discrete elements, as described in48. Briefly, as the tumor grows within a vascularized environment, the tissue has heterogeneous access to oxygen and nutrients diffusing from the vasculature. Oxygen and nutrients are transported to the tumor from the location of extravasation from the vasculature. The interstitial flow of oxygen and nutrients is influenced by tissue pressure and by distance from the nearest vessels. Neo-vessel sprouts arise from the host vasculature, whose epithelial cell tips migrate semi-stochastically towards a gradient of tumor angiogenic factor (TAF) produced by tumor tissue. The main equations of the vascularized tumor growth model in41, 79 are summarized in Supplement.
Tumor Aggressiveness
Tumor aggressiveness G is a non-dimensional parameter that represents the ratio of cell proliferation to the rate of tissue relaxation due to to cell-cell adhesion. Assuming uniform cell-cell adhesion throughout the tumor, G is incorporated as a surface-tension like jump boundary condition at the tumor-host interface41:
| (1) |
where κ is the mean curvature of the interface, and P is the oncotic pressure representing the balance of the intra-tumoral (Pinner) and extra-tumoral (Pouter) pressures. Thus, higher proliferation or lower cell-cell adhesion would raise the tumor aggressiveness, meaning that the tumor would overall push stronger (be more invasive) into its surroundings.
Tumor-Associated Macrophages
Tumor-associated macrophages (TAMs) of two different subtypes are simulated in the vascularized tumor microenvironment, as described in38, 42. Briefly, monocytes extravasate from the vasculature following local concentration of chemoattractants secreted from hypoxic tissue, stimulating them to migrate towards regions of tissue hypoxia. Monocytes undergo polarization into M1 (tumoricidal) or M2 (tumorigenic) subtypes in the vicinity of the tumor microenvironment based on the concentration of chemokines released by proliferating and hypoxic tumor cells, and affect the net tumor proliferation10, 36, 37. As in42, pressure, oxygen, and chemoattractant gradients affect the semi-stochastic movement of monocyte precursors and the M1 and M2 macrophage subtype movement through the interstitium.
Lactic Acid
Enhanced lactic acid production by anaerobic glycolysis (Warburg Effect) in cancer is well known and contributes to a low pH within the tumor microenvironment. Additionally, lactic acid is known to be uptaken by cancer cells through monocarboxylate transporters (MCTs) and utilized as an energy substrate64. In the model, lactic acid is produced by proliferating and hypoxic tumor cells and diffuses in the surrounding tissue. It can be uptaken by tumor cells and wash out of the tissue into the vasculature, which altogether represent the decay. Lactic acid production is represented as 2 moles of lactic acid produced for every mole of glucose during anaerobic respiration77:
| (2) |
where DLac. is the diffusivity, L is the local concentration of lactic acid, is the production rate, is the rate of washout, and is the cellular uptake rate (assumed to be on the same order of magnitude as that of oxygen). The production rate of lactic acid is concentration dependent, as it has been shown that cancer cells have the ability to adjust their metabolic behavior by altering lactic acid production to maintain a range of pH within the microenvironment46.
For simplicity, it is assumed that lactic acid production gradually decreases as the level of oxygen and nutrients σ increases towards areas of higher vascularization:
| (3) |
Since the molar mass of lactic acid (~90 g/mol) is on the order of magnitude of oxygen (16 g/mol), the diffusion constant DLac. is for simplicity assumed to be on the same order of magnitude as oxygen. Accordingly, lactic acid diffuses through the host and tumor tissue relatively uninhibited by the ECM. Similarly, the lower bound rate of lactic acid uptake by cells is assumed to be on the same order of magnitude as oxygen.
Chemotherapy
A number of chemotherapeutic agents are routinely administered to non-small cell lung cancer (NSCLC) patients17. To test the proposed model linking metabolomic data to tissue-scale behavior, we chose to simulate response to cisplatin (CDDP), a representative NSCLC drug. The transport of drug c with diffusivity Dc was simulated from the position of extravasation from the vasculature. Uptake by tumor and normal cells and wash-out from the interstitial space were included as a combined effect in the rate λc,uptake, which reflects the drug half-life (assumed to be similar to the half-life in plasma)73:
| (4) |
A constant drug extravasation transfer rate λc,TR from the vasculature was assumed70 :
| (5) |
where λc,TR is the constant transfer rate from pre-existing and new vessels, 1vessel(x, t) equals 1 at vessel locations and 0 elsewhere, kp,i represents the weight of convective transport component of small molecules, pi is interstitial fluid pressure (IFP), and pe is effective pressure (IFP at which there is no net volume flux out of the vasculature)79. Drug concentration in the vasculature is initially , where extravasation follows first order kinetics for a constant drug infusion: Cc,t = 1 − e−αt, with α based on an average CDDP half-life of 0.5 h35.
Metabolomic Data
The metabolomic datasets based on lung tumor core biopsies from 23 patients in53 (available in Metabolomics Workbench Repository, record ST001527) were used to illustrate the study methodology for patient-specific tumors. These data are described in further detail in53. Briefly, patient tumor tissue samples were processed by liquid-liquid metabolite extraction and analyzed by 2DLC-MS with negative and positive ion modes. 2DLC-MS data was presented as an alignment table for each batch with retention time, m/z, signal intensity, stable isotope labeling, name of identified metabolite, and database used for metabolite identification. After combining data from positive and negative ion modes, a preliminary step to handle missing values was performed by removing features which contained more than 50% missing values. This resulted in a data set of 66 metabolites with approximately 21.8% missing values. The data were normalized by a log transformation and imputed by probabilistic principal component analysis (PPCA).
RESULTS
Linking of Metabolomic Data to Model Parameters
A baseline (representative) tumor nodule was first created in silico by calibrating the model parameters to lung tumor experimental data, and a range for the parameter values around baseline was determined (Supplement). The main model parameters affected by metabolomic data include the rate of proliferation, angiogenesis, lactic acid production, drug effect, monocyte production and polarization to the Type 1 and Type 2 macrophage phenotype. In turn, the lactic acid concentration locally modulates the polarization of monocytes to the Type 2 macrophage, while the overall lactic acid within the tumor tissue influences the tumor aggressiveness. Lactic acid is also an important contributor to angiogenesis19. Table 1 summarizes a set of relevant metabolites detected in lung tumor tissue samples53, and highlights the corresponding model parameters potentially affected by these metabolites, as has been established from previous biological observations. Individual metabolites can overall promote tumor progression or tumor control via the combination of increasing (promoting) or decreasing (abating) particular parameters. Thus, each metabolite can have “pro-parameter” and “anti-parameter” effects.
Table 1.
Potential Effect of NSCLC Metabolites on Model Parameters.
| METABOLITE | Refs. | |||||||
|---|---|---|---|---|---|---|---|---|
| Monocyte Production | ||||||||
| Acetyl-L-carnitine | ▲ | ▲ | 83 14 | |||||
| N8- Acetyl-spermidine | ▲ | 56 | ||||||
| Arginine | ▲ a,b | ▲ | ▼ | 68 58, 85 | ||||
| Creatinine | ▼ | ▲ | 32, 60 | |||||
| Cystine | ▼ c | 13, 31 | ||||||
| Fumarate | ▲ d | ▲ | 81 84 | |||||
| Glutamic Acid | ▲ | 20 | ||||||
| Glutamine | ▼ | ▲ | ▼ | 66, 75 | ||||
| Glutaric Acid | ▲ | 34 | ||||||
| Hydroxybutyric Acid | ▲ | 27 | ||||||
| Hydroxyphenyl-lactic Acid | ▼ e | 9 | ||||||
| Inosine | ▲ | 11 | ||||||
| Isoleucine | ▼ | 4 2 | ||||||
| Lactic acid | ▲ | ▲ | 19 | |||||
| Lysine | ▼ f | 80 | ||||||
| Malonic Acid | ▼ g | 30 6 | ||||||
| Methionine | ▼ f | 72 | ||||||
| Methionine Sulfoxide | ▼ h | 39 | ||||||
| N3,N4-Dimethyl-L-arginine | ▲ | ▼ | 76 | |||||
| Ornithine | ▼ i | 58 | ||||||
| Phenylalanine | ▲ | ▼ | 61 66 | |||||
| Proline | ▲ | ▲ | 22 47 | |||||
| Pyruvate | ▲ | ▲ | ▼ | 28 65 1 | ||||
| Salicylic Acid | ▼ | 26 | ||||||
| Serine | ▼ | ▲ j | ▼ j | 57 45 40 | ||||
| Succinate | ▼ | ▲ | 78 | |||||
| Threonine | ▲ | ▼ | 25 | |||||
| Tryptophan | ▲ | ▼ | 68 | |||||
| Urea | ▲ k | 54 | ||||||
| Uric Acid | ▲ b | ▲ | ▼ | 23 | ||||
| Valine | ▼ f | 3 |
Metabolites detected in lung cancer patient tumor samples53 (leftmost column), and their potential promotion (▲) or abatement (▼) of key model parameters (top row).
Biological significance of the metabolites to NSCLC is indicated from literature sources (rightmost column).Green: promoting tumor control; Pink: promoting tumor progression.
Arginine is a “conditionally essential” amino acid involved in the synthesis of polyamines, which promote tumor growth, invasion and metastasis58 and is also involved in immune system activation68, 85.
Although these metabolites promote immune system activation, they are considered to favor tumor progression because the involvement in tumor growth, migration, and contribution to cancer risk/mortality is considered a stronger overall effect.
Increased levels of cystine may be the result of decreased intracellular conversion to cysteine for catabolic usage13 and glutathione synthesis31, which would reflect decreased cancer growth.
Accumulation also leads to persistence of hypoxia-inducible factors in the microenvironment81, potentially promoting angiogenesis. In the context of chemotherapy, angiogenesis combined with potentiation of the drug effect by fumarate is assumed to improve the overall tumor drug response.
General effects of immune system activation or suppression are simulated by changing the monocyte production rate9.
Accumulation is assumed to reflect decreased cancer growth.
Promotes epithelial-mesenchymal transition (EMT), which involves enhanced migration, invasiveness, elevated resistance to apoptosis, and increased ECM production29, overall decreasing the drug effect.
Relieves stress caused by acidic microenvironment39; simulated in the model by lowering the lactic acid production rate.
Increased levels of ornithine may be the result of increased arginine, which promotes tumor growth and immune system activation68 58, 85.
Promotes adaptive immune activity40, simulated in the model by enhanced anti-tumor macrophage polarization.
Increases monocyte proliferation, simulated with higher overall macrophage numbers54.
A flowchart summarizing the process for determining parameter values based on particular metabolomic data is shown in Fig 1.
Fig 1.
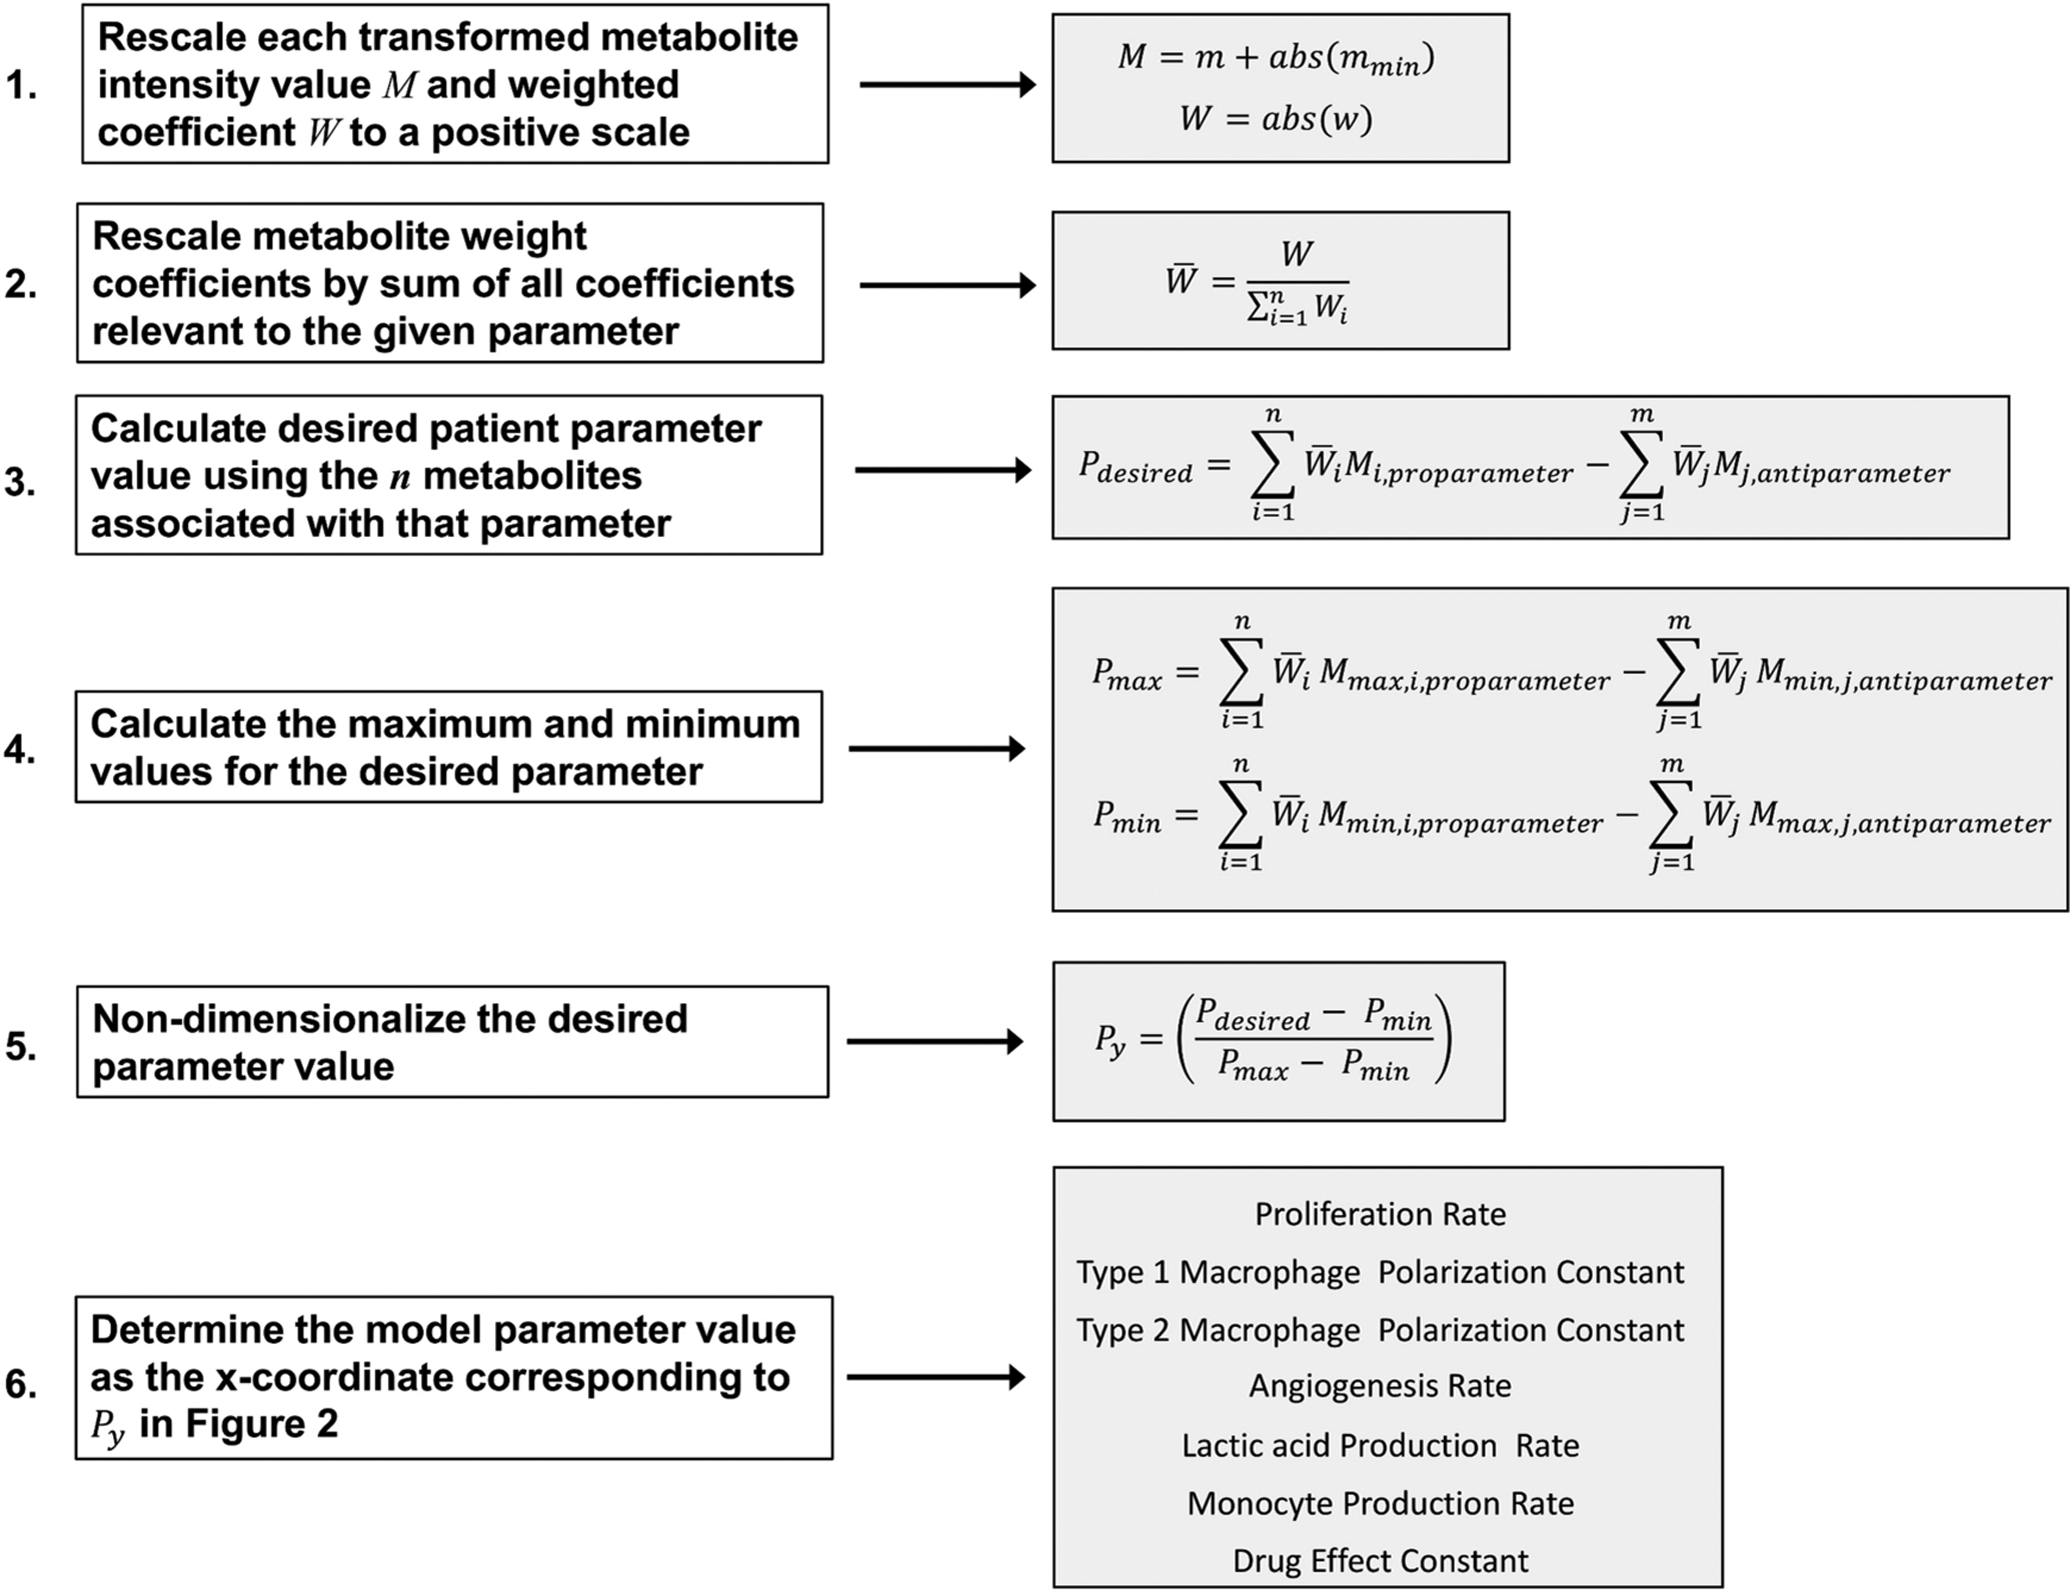
Workflow for Coupling Metabolomic Data to Model Parameter Values.
Determination of Model Parameter Values from Particular Metabolomic Data
Starting with a 2DLC-MS data set, as in53, the weighted coefficients can be determined via a Spearman correlation analysis of experimentally measured metabolite intensities to the clinical response assessment, such as the Response Evaluation Criteria in Solid Tumors Group (RECIST)21, 74, or by the Variable Importance in Projection (VIP) scores obtained from a PLS-DA model and scaling of these scores to represent the fraction of their contribution to the parameter of interest. It is assumed for each metabolite in a set of patient metabolomic data that the weighted coefficient W and intensity value M71 as described in Fig 1 are positive; if not, they are first rescaled as follows:
| (6) |
| (7) |
where for each metabolite, w is the weighted coefficient, m is the transformed intensity value, and mmin is the minimum intensity value in the dataset. Transformations are generally applied to a dataset to normalize and enable proper statistical analysis. For each parameter, the metabolite weighted coefficients (W) are rescaled to a scale of 0 to 1 by dividing each value by the sum of all coefficient values relevant to the given parameter:
| (8) |
where for each metabolite, is the rescaled weighted coefficient and n is the total number of metabolites associated with the parameter (as listed in Table 1). To determine the values for a particular model parameter Pdesired (Table 1, top row) based on the associated metabolomic data, these data are first non-dimensionalized to values Py:
| (9) |
where Pmin and Pmax are the minimum and maximum values calculated across all samples for the desired parameter. Pdesired, Pmax, and Pmin are calculated as the weighted sums of pro-parameter metabolites minus the weighted sums of the anti-parameter metabolites of the corresponding metabolite measurements M, Mmax and Mmin associated with the desired parameter (Table 1):
| (10) |
| (11) |
| (12) |
where Mmax and Mmin are the rescaled maximum and minimum values for a particular metabolite associated with the desired model parameter, and n and m are the total number of pro-parameter and anti-parameter metabolites respectively associated with this parameter (as listed in Table 1).
The weighted coefficients (i.e., relative contribution of specific metabolites towards the dependent variable) can be objectively determined by applying multivariable (e.g., partial least squares discriminant analysis (PLS-DA)) or univariable (e.g., correlation analyses) statistical techniques to the metabolomic dataset, as has been previously shown12, 59.
A representative set of non-dimensionalized Py values is shown in Fig 2. The lines are generated by plotting the model-generated values at 400 h of tumor growth for every metabolism-associated model parameter (see Supporting Information). The parameters were changed one at a time while holding other parameters constant at their baseline values. The time of 400 h was selected because by that time the simulated tumor growth had attained a steady rate of increase (Supplementary Fig 1). Given Py on the y-axis, one can then interpolate the value for a particular model parameter by mapping (or fitting) to the x-axis. Linear or logarithmic functions were found to adequately map the experimentally measured metabolite values to the model parameter space.
Fig 2. Parameter Curves Showing Py vs. Parameter Values.
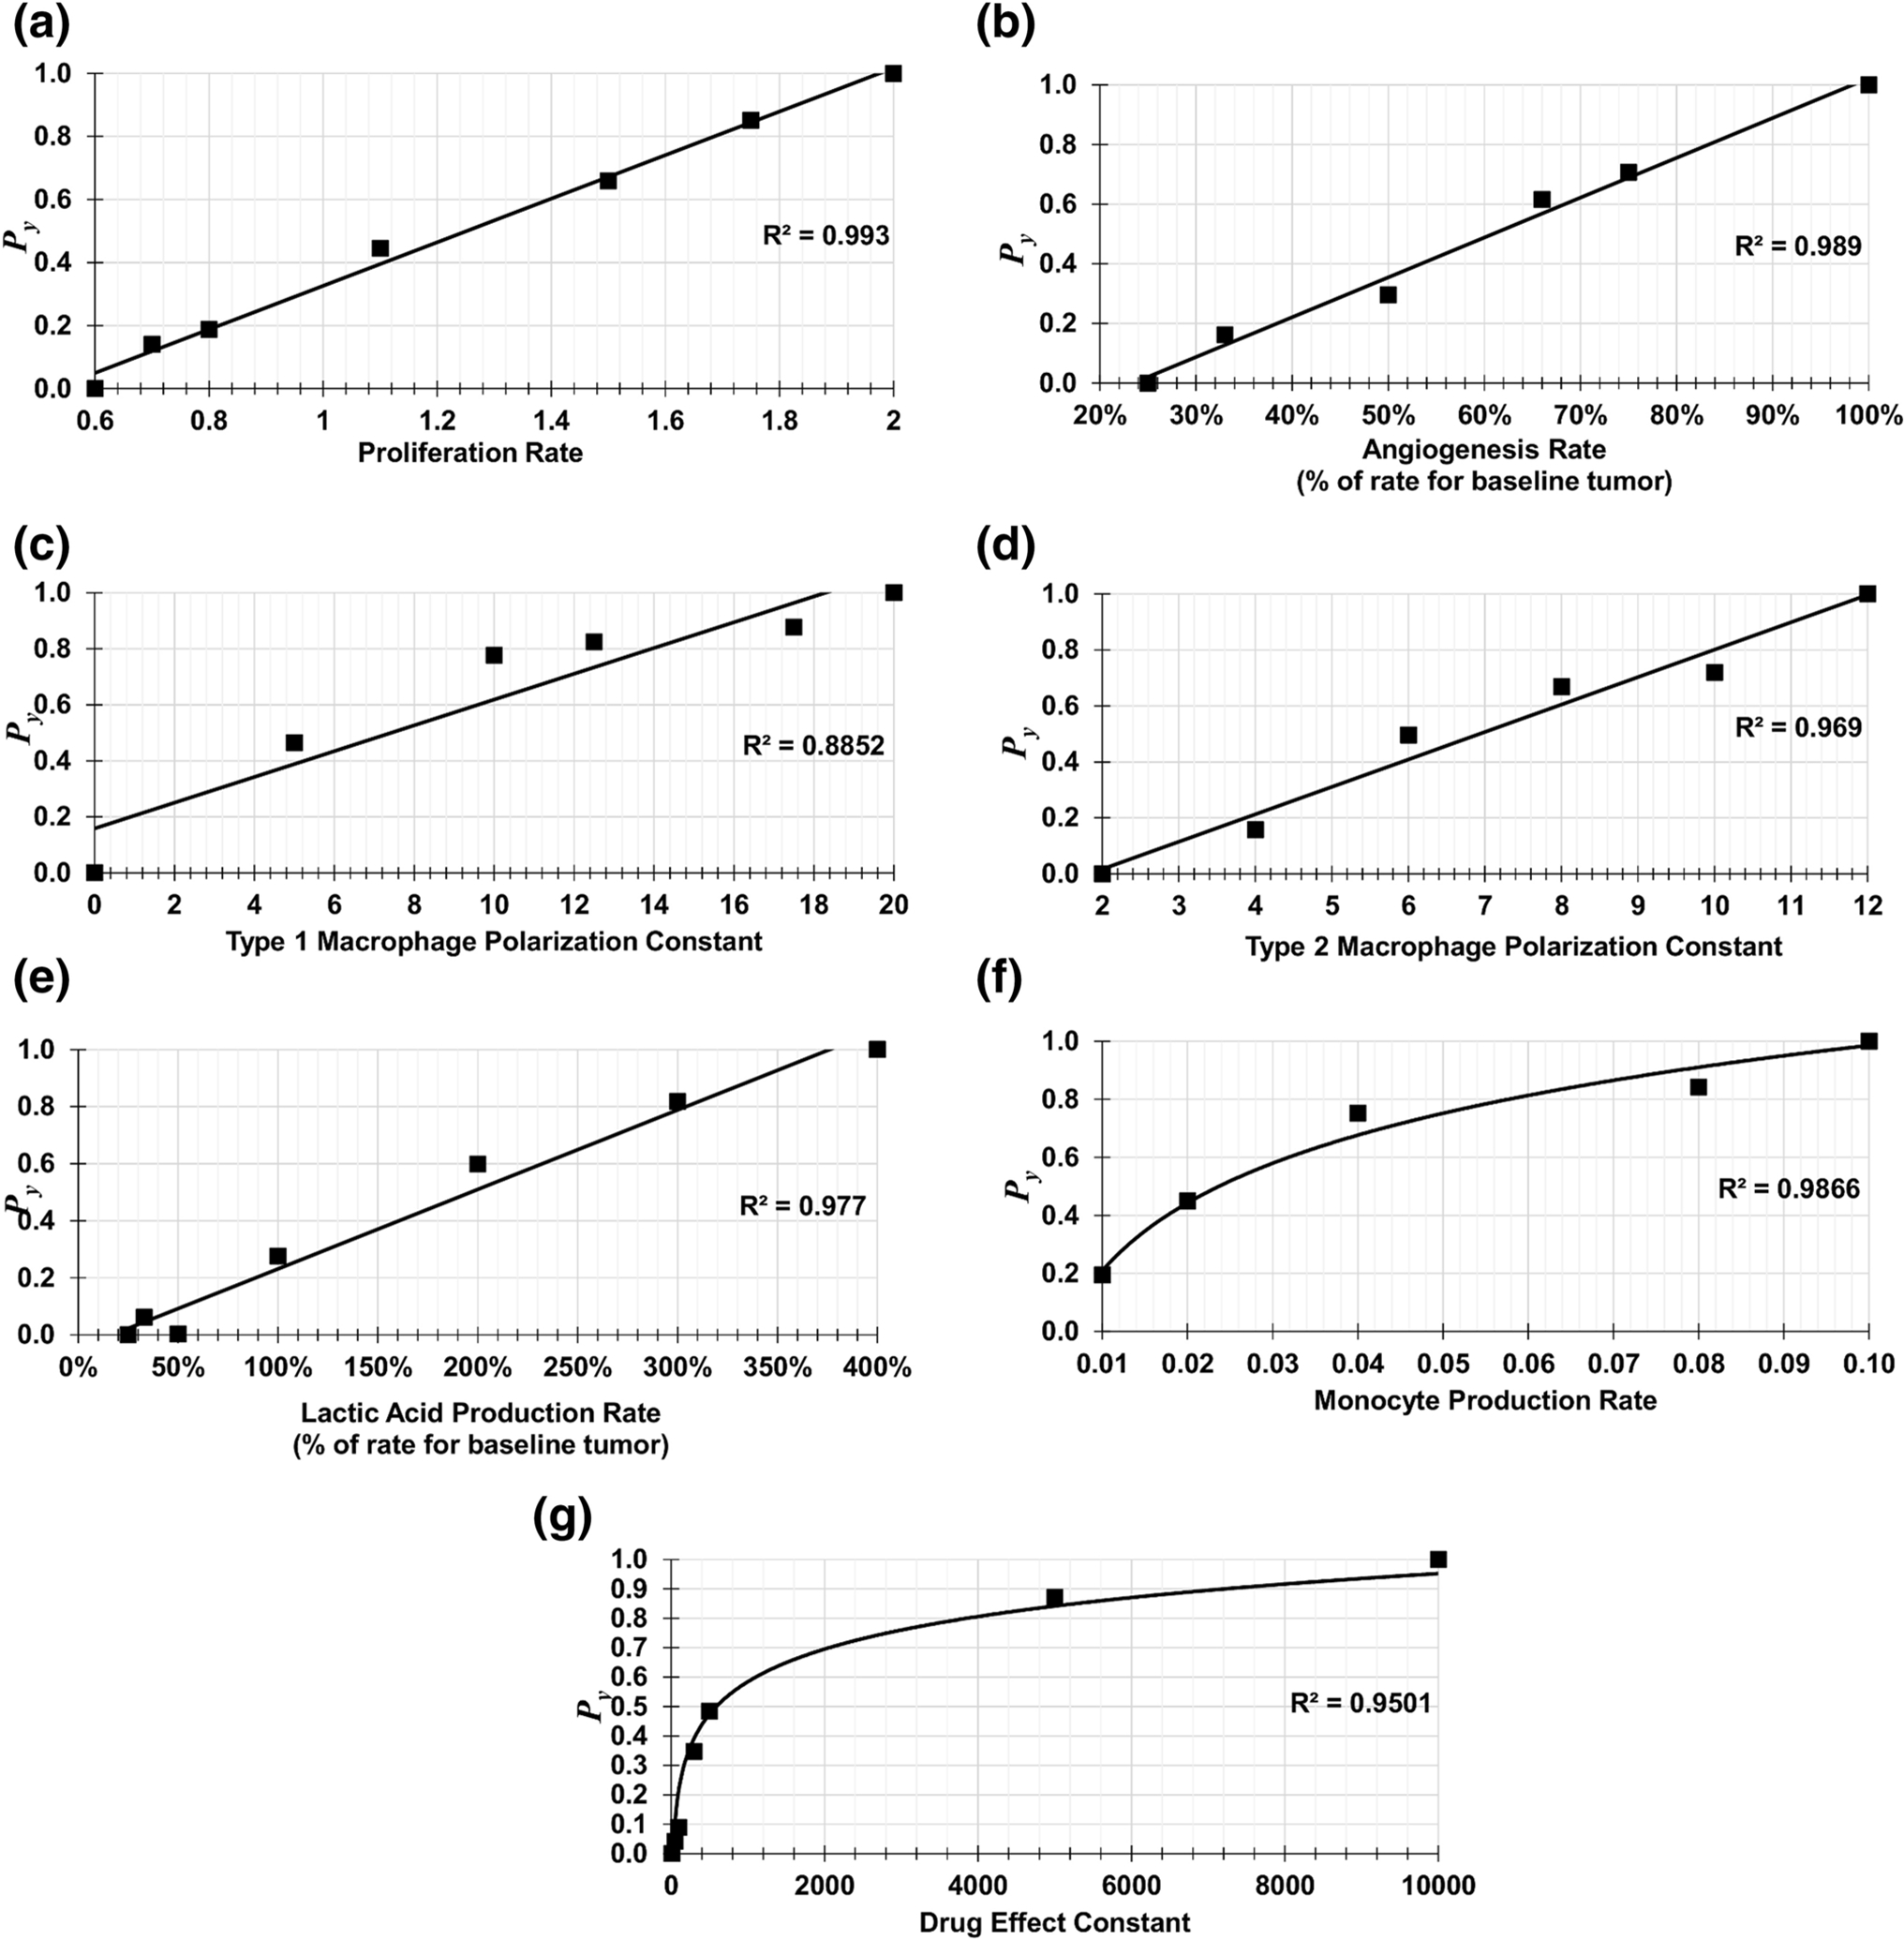
These graphs map a set of patient metabolomic data (y-axis, rescaled to values between 0 and 1) to the parameter space of the model (x-axis).
Variation in Metabolic Dysregulation
Model parameter values representing a range of minimum to maximum metabolic dysregulation (from LOW to HIGH, with BASELINE in between) were chosen in order to simulate the corresponding extremes of metabolic-influenced tumor growth. The range of parameter values listed in Table 2 defines a set of bounds for the values that could be utilized for NSCLC patient-specific tumor simulations based on the dataset in53. The ranges were determined by interpolating values that covered the capability of the model to simulate a range of biologically relevant vascularized tumor growth. In this study, as well as in previous work using these types of models8, 15, 24, 42, 79, we have found that values in these ranges are adequate to evaluate the parameters driving this growth. Type 1 macrophages have the same LOW and MEDIUM values, and Type 2 macrophages have the same MEDIUM and HIGH values due to the calibration of macrophage polarization to maintain tumor growth consistent with the baseline case, as described earlier. The macrophage types are coupled, and their ratio determines the overall range of interactions with the tumor tissue. For angiogenesis, the BASELINE case already represents a highly vascularized condition79.
Table 2.
Ranges for Model Parameter Values.
| Proliferation Rate | 0.600 | 1.100 | 2.000 | 1.356 |
| Type 1 Macrophage Polarization Constant | 20.000 | 20.000 | 0.000 | 9.863 |
| Type 2 Macrophage Polarization Constant | 2.000 | 12.000 | 12.000 | 8.075 |
| Angiogenesis Rate (*) | 25.0% | 100.0% | 100.0% | 66.7% |
| Lactic acid Production Rate (*) | 25.0% | 100.0% | 400.0% | 192.4% |
| Monocyte Production Rate | 0.005 | 0.020 | 0.100 | 0.020 |
| Drug Effect Constant | 1.0E+04 | 100.0 | 10.0 | 805,3 |
Model parameter values chosen to define a range of metabolic-influenced tumor growth and drug response, in order to simulate LOW, BASELINE, and HIGH metabolic dysregulation. For comparison, SAMPLE values are calculated for a representative patient in the dataset.
Shown as % of the corresponding rate for the baseline tumor.
Tumor radius and vessel surface area are shown over time for the three cases in Fig 3 A–B. At 400 h, the HIGH case had 850% of the vasculature and 220% of the radius of the LOW case. In Fig 3 C–E, the proliferating, hypoxic, and necrotic tissue fractions are shown to highlight the differences in tumor tissue heterogeneity over time. At 400 h, the HIGH case had 51%, 375%, and 124% of the proliferating, hypoxic and necrotic tissue regions of the LOW case, respectively. The ratio of Type 1 to Type 2 macrophages is shown in Fig 3 F (the HIGH case has no Type 1 macrophages, Table 2).
Fig 3. Curves Establishing a Range of Metabolic Dysregulation During Tumor Growth.
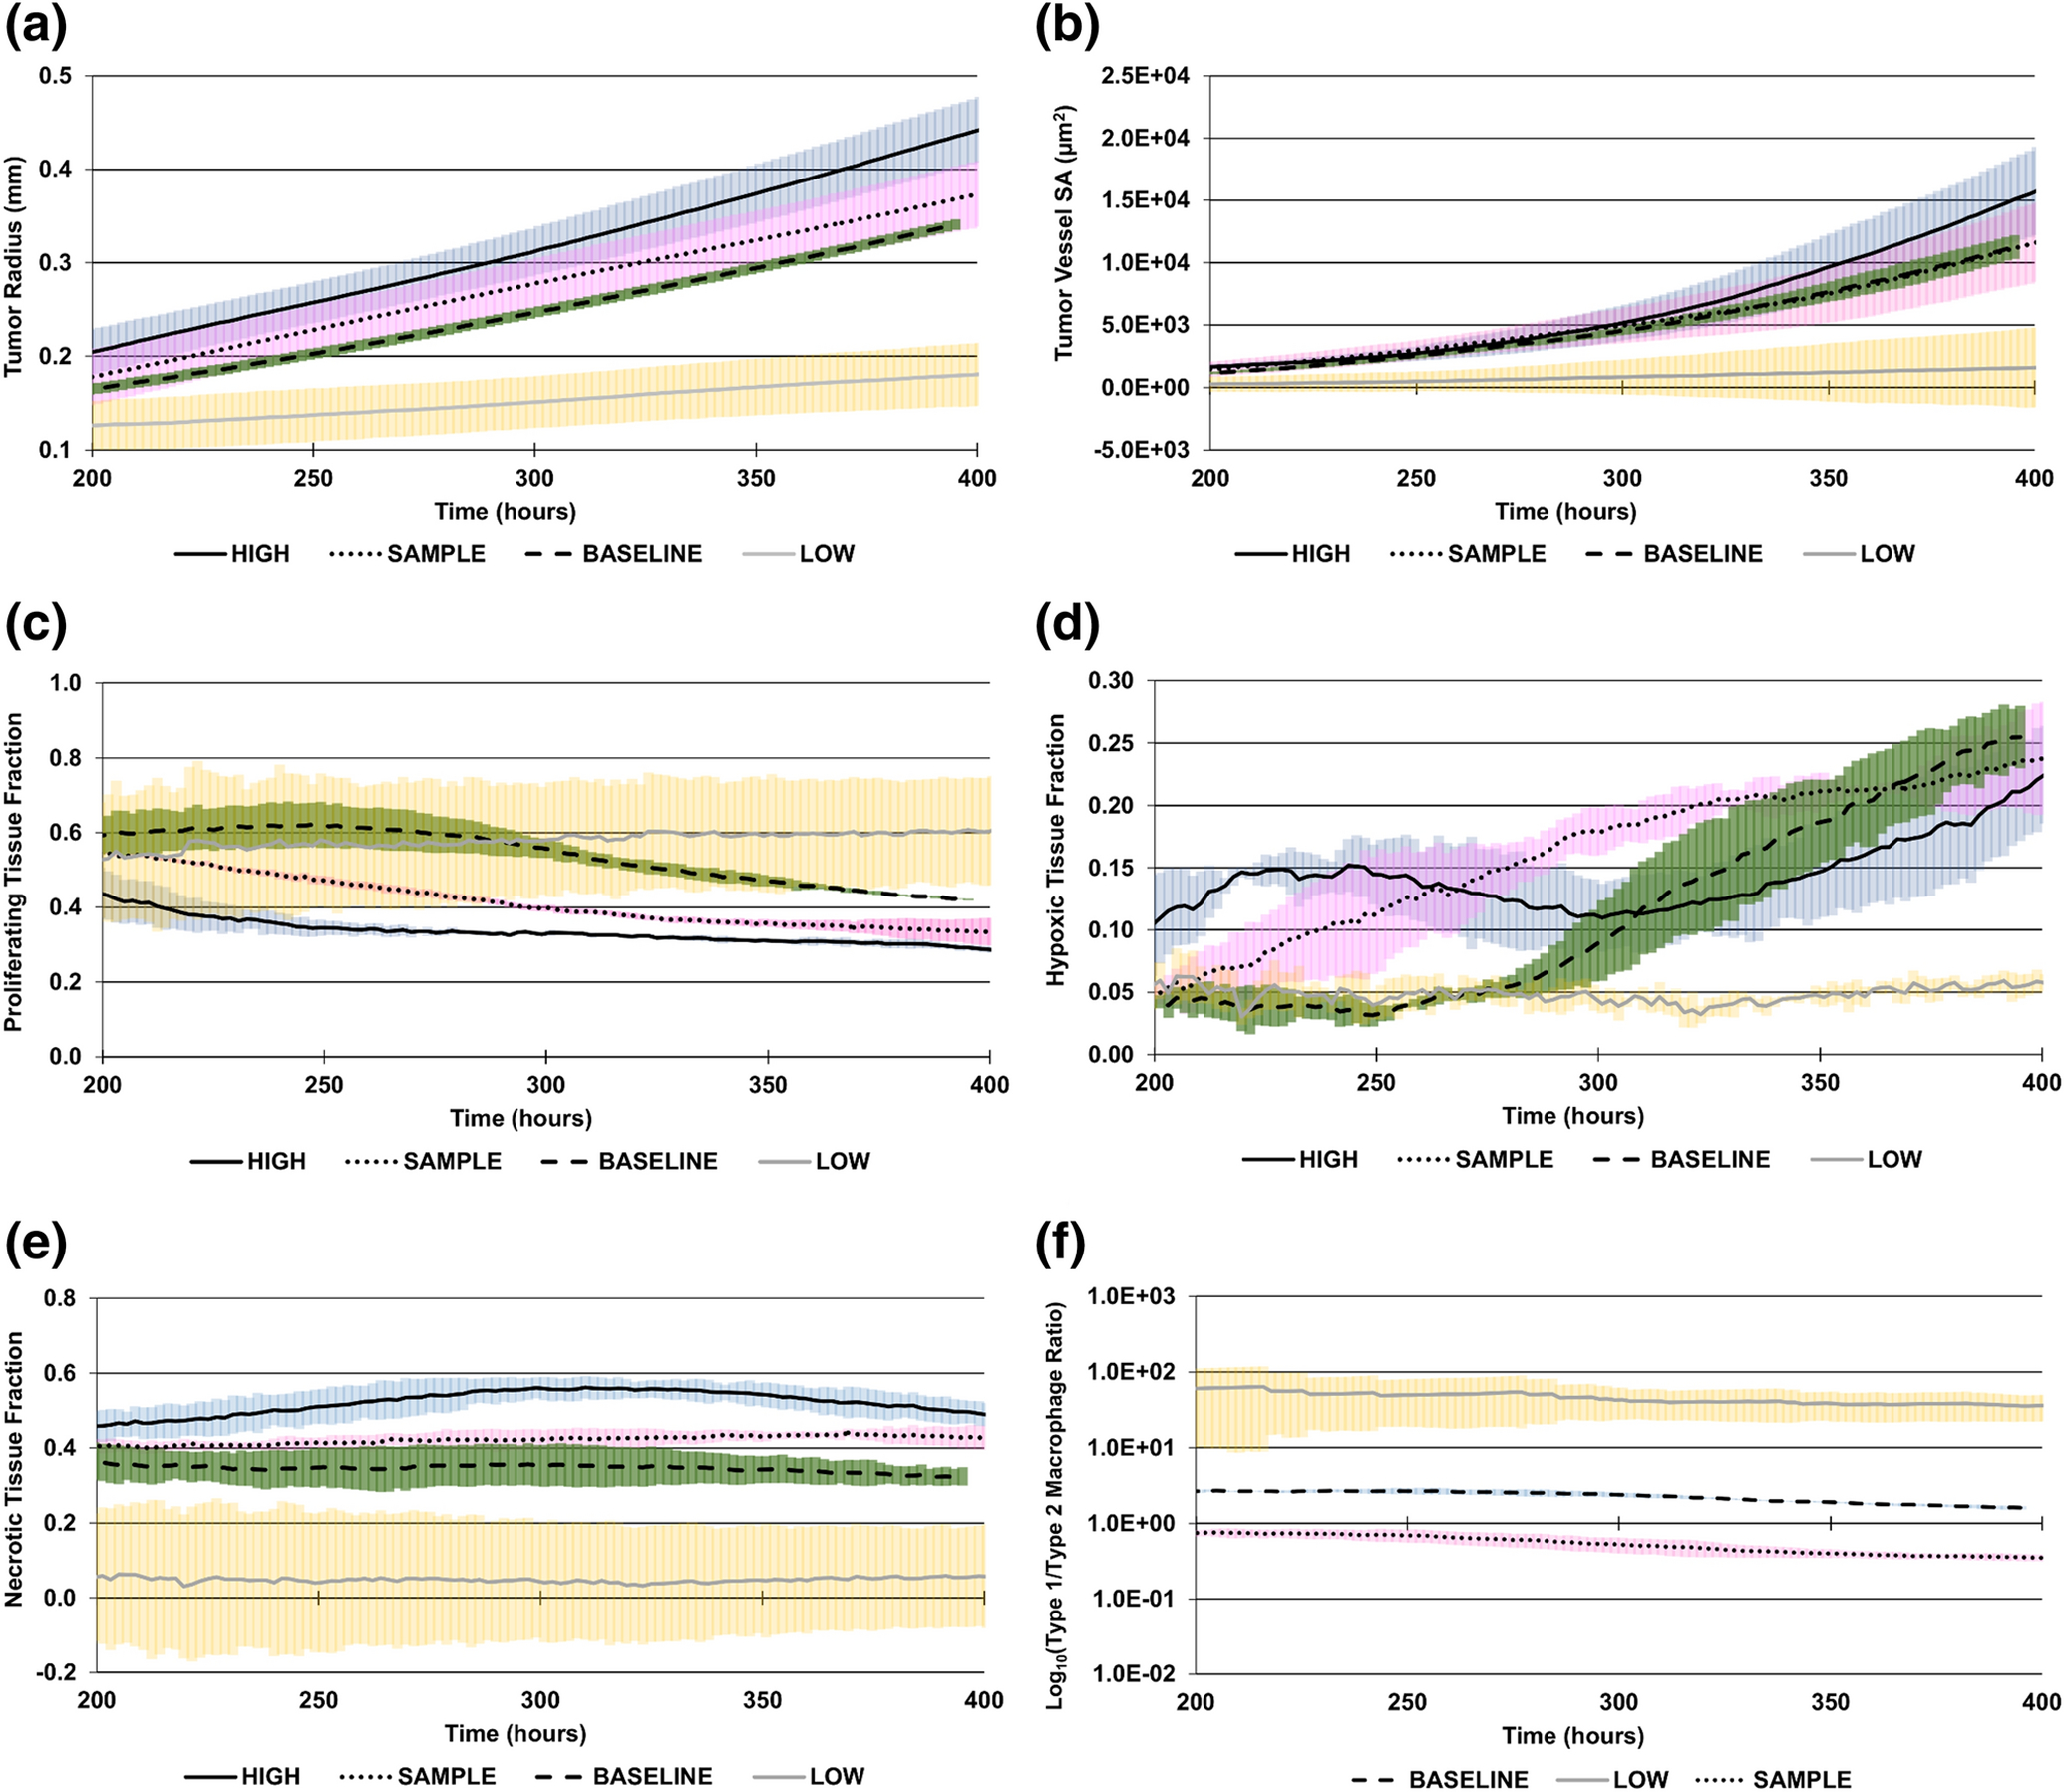
LOW: minimum theoretical dysregulation (yellow error bars); BASELINE: dysregulation based on baseline tumor values (green error bars); HIGH: maximum theoretical dysregulation (blue error bars); SAMPLE: a representative patient case for illustration purposes (pink error bars). (A) Tumor radius, (B) tumor vessel surface area (SA), (C) proliferating tissue fraction, (D) hypoxic tissue fraction, (E) necrotic tissue fraction, (F) ratio of Type 1 to Type 2 macrophages (log10 scale). Type 1 macrophages are not present in the HIGH case.
Simulation of Particular Tumors in Silico
To illustrate the methodology for patient-specific tumors, we simulated the growth phase of a tumor incorporating metabolomic data (Table 3) previously measured from a lung cancer tumor core biopsy53. These data represent log transformed metabolite intensity values, e.g., measured from liquid chromatography mass spectroscopy (LC-MS). Log transformation is commonly applied to biological data to center it and correct for heteroscedasticity71. The parameter values are calculated in the following manner, based on the workflow outlined in Fig 1: First, the transformed intensity value for each metabolite (M) is rescaled to a positive scale by summing the absolute value of the largest negative value (mmin) to all intensities (across all metabolites) so that the largest negative value corresponds to zero (Fig 1, Step 1). A variety of methods could be used to determine the weighted coefficients, including PLS-DA VIP scores, Spearman correlation coefficients, and PLS-DA loadings. Spearman correlation coefficients are found by analyzing clinical response as a function of the transformed metabolite intensities. Similarly, in PLS-DA the transformed metabolite intensities are used as the predictor variables and clinical outcome can be used as the response variable. All metabolite weighted coefficients are rescaled to a positive scale by taking the absolute value of each weighted coefficient (Fig 1, Step 1). Then, the metabolite weight coefficients (W) are rescaled to range from 0 to 1 by dividing each value by the sum of all values relevant to the given parameter (Figure 1, Step 2) (Table 3). Here, we chose a combination of PLS-DA VIP scores and Spearman correlation coefficients to illustrate the calculation of the weighted coefficients. A PLS-DA VIP score and Spearman correlation coefficient are calculated for every metabolite using the clinical patient response as the categorized outcome variable. After rescaling all correlation coefficients to a positive scale, these two values are multiplied together and represent the weight coefficient W. These are considered two different methods of assigning weight to metabolites, relevant to the patient clinical outcome. We choose both by multiplying them to be inclusive, as using only a single method of assigning weight to metabolites could introduce bias into the parameter calculations.
Table 3.
Transformed and Rescaled Intensities and Weighted Coefficients for a Representative Sample.
| METABOLITE | Tumor Proliferation | Type 1 Macrophage | Type 2 Macrophage | Angiogenesis | Drug Effect | Lactic Acid Production | Monocyte Production | TRANSFORMED & RESCALED INTENSITIES Mi |
|---|---|---|---|---|---|---|---|---|
| Acetyl-L-carnitine | 0.0602 | 0 | 0 | 0.1854 | 0 | 0 | 0 | 1.13 |
| N8-Acetyl-spermidine | 0.0571 | 0 | 0 | 0 | 0 | 0 | 0 | 2.59 |
| Arginine | 0.0805 | 0.1392 | 0.1392 | 0 | 0 | 0 | 0 | 1.02 |
| Creatinine | 0 | 0.1148 | 0.1148 | 0 | 0 | 0 | 0 | 0.56 |
| Cystine | 0.0303 | 0 | 0 | 0 | 0 | 0 | 0 | 1.45 |
| Fumarate | 0 | 0 | 0 | 0.1260 | 0.2559 | 0 | 0 | 2.16 |
| Glutamic acid | 0 | 0 | 0 | 0 | 0.4090 | 0 | 0 | 0.48 |
| Glutamine | 0.0766 | 0.1325 | 0.1325 | 0 | 0 | 0 | 0 | 0.20 |
| Glutaric acid | 0.0381 | 0 | 0 | 0 | 0 | 0 | 0 | 0.15 |
| Hydroxybutyric acid | 0.0547 | 0 | 0 | 0 | 0 | 0 | 0 | 1.66 |
| Hydroxyphenyl-lactic acid | 0 | 0 | 0 | 0 | 0 | 0 | 0.1503 | 0.00 |
| Inosine | 0.0738 | 0 | 0 | 0 | 0 | 0 | 0 | 1.88 |
| Isoleucine | 0.0764 | 0 | 0 | 0 | 0 | 0 | 0 | 0.64 |
| Lactic acid | 0 | 0 | 0 | 0.1028 | 0 | 0.4306 | 0 | 1.02 |
| Lysine | 0.0411 | 0 | 0 | 0 | 0 | 0 | 0 | 0.51 |
| Malonic acid | 0 | 0 | 0 | 0 | 0.3351 | 0 | 0 | 0.92 |
| Methionine | 0.0753 | 0 | 0 | 0 | 0 | 0 | 0 | 1.18 |
| Methionine Sulfoxide | 0 | 0 | 0 | 0 | 0 | 0.5694 | 0 | 0.65 |
| N3,N4-Dimethyl-L-arginine | 0 | 0.1244 | 0.1244 | 0 | 0 | 0 | 0 | 0.63 |
| Ornithine | 0 | 0 | 0 | 0 | 0 | 0 | 0.1323 | 1.11 |
| Phenylalanine | 0 | 0.0510 | 0.0510 | 0 | 0 | 0 | 0 | 0.88 |
| Proline | 0.0806 | 0 | 0 | 0.2485 | 0 | 0 | 0 | 1.31 |
| Pyruvate | 0.1095 | 0 | 0 | 0.3373 | 0 | 0 | 0.3418 | 1.46 |
| Salicylic acid | 0 | 0 | 0 | 0 | 0 | 0 | 0.2146 | 1.32 |
| Serine | 0.0383 | 0.0663 | 0.0663 | 0 | 0 | 0 | 0 | 0.65 |
| Succinate | 0 | 0.1103 | 0.1103 | 0 | 0 | 0 | 0 | 0.34 |
| Threonine | 0 | 0.0764 | 0.0764 | 0 | 0 | 0 | 0 | 0.36 |
| Tryptophan | 0 | 0.0592 | 0.0592 | 0 | 0 | 0 | 0 | 1.67 |
| Urea | 0 | 0 | 0 | 0 | 0 | 0 | 0.1609 | 2.41 |
| Uric acid | 0.0728 | 0.1259 | 0.1259 | 0 | 0 | 0 | 0 | 0.64 |
| Valine | 0.0349 | 0 | 0 | 0 | 0 | 0 | 0 | 0.52 |
Transformed and rescaled intensity values for a representative sample and weighted coefficients, calculated for each metabolite associated with the model parameters using a combination of PLS-DA VIP scores and Spearman correlation coefficients. Green: promoting tumor control; pink: promoting tumor progression. The coefficients (either promoting (red) or abating (blue) the associated parameters) were derived as described in Methods from the metabolomic data from the study in53. The coefficients are rescaled to a positive scale, where a value of zero corresponds to the minimum, as described in Fig 1.
For every model parameter in Table 3, Pdesired is found by summing the multiplication of the metabolite intensity values for that patient by the respective weighted coefficients for pro-parameter metabolites (values in red) and subtracting the sum of the multiplication of the metabolite intensity values for that patient by the respective weighted coefficients for anti-parameter metabolites (values in blue). (Fig 1, Step 3). Pmax and Pmin are respectively calculated using the maximum pro-parameter and minimum anti-parameter, and the minimum pro-parameter and maximum anti-parameter metabolite intensities in the dataset (Fig 1, Step 4). Next, the non-dimensionalized y-coordinate Py values for each model parameter are determined from Pdesired, Pmin and Pmax (Fig 1, Step 5). Lastly, the model parameter values are found as the x-coordinate values corresponding to each Py in Fig 2. The resulting values for the sample case are in Table 4.
Table 4.
Model Parameter Values for a Representative Sample.
| Proliferation Rate | 1.650 | 0.584 | −0.844 | 0.573 | 1.357 |
| Type 1 Macrophage Polarization Constant | 1.675 | 0.439 | −0.343 | 0.388 | 4.980 |
| Type 2 Macrophage Polarization Constant | 0.343 | −0.439 | −1.675 | 0.612 | 8.076 |
| Angiogenesis Rate (*) | 2.437 | 1.406 | 0.000 | 0.577 | 66.7% |
| Lactic acid Production Rate (*) | 0.999 | 0.071 | −0.816 | 0.489 | 192.4% |
| Monocyte Production Rate | 0.470 | −0.542 | −1.804 | 0.555 | 0.028 |
| Drug Effect Constant | 2.011 | 0.443 | −0.831 | 0.448 | 426.3 |
Pmax, Pdesired and Pmin values along with the corresponding model parameter values calculated for a representative sample from a metabolomic dataset using the proposed method. Metabolomic data were obtained from the study in53.
Parameter value is shown as % of the corresponding value for the baseline tumor.
The tumor behavior simulated by the model with these parameter values is in Fig 3 and compared at 400 h in Fig 4, showing that for this sample set of metabolite intensity values, the tumor radius would fall between the BASELINE and HIGH tumor radii. A consistent pattern from LOW to HIGH was observed for tumor radius, tumor vessel surface area, and proliferating and necrotic tissue fractions with HIGH, SAMPLE, MEDIUM, and LOW cases. The LOW case had decreased hypoxic fraction along with low vascularization, reflecting the values to represent low metabolic dysregulation in Table 2, including a low proliferation rate.
Fig 4. Tumor Characteristics Compared Between Different Levels of Metabolic Dysregulation.
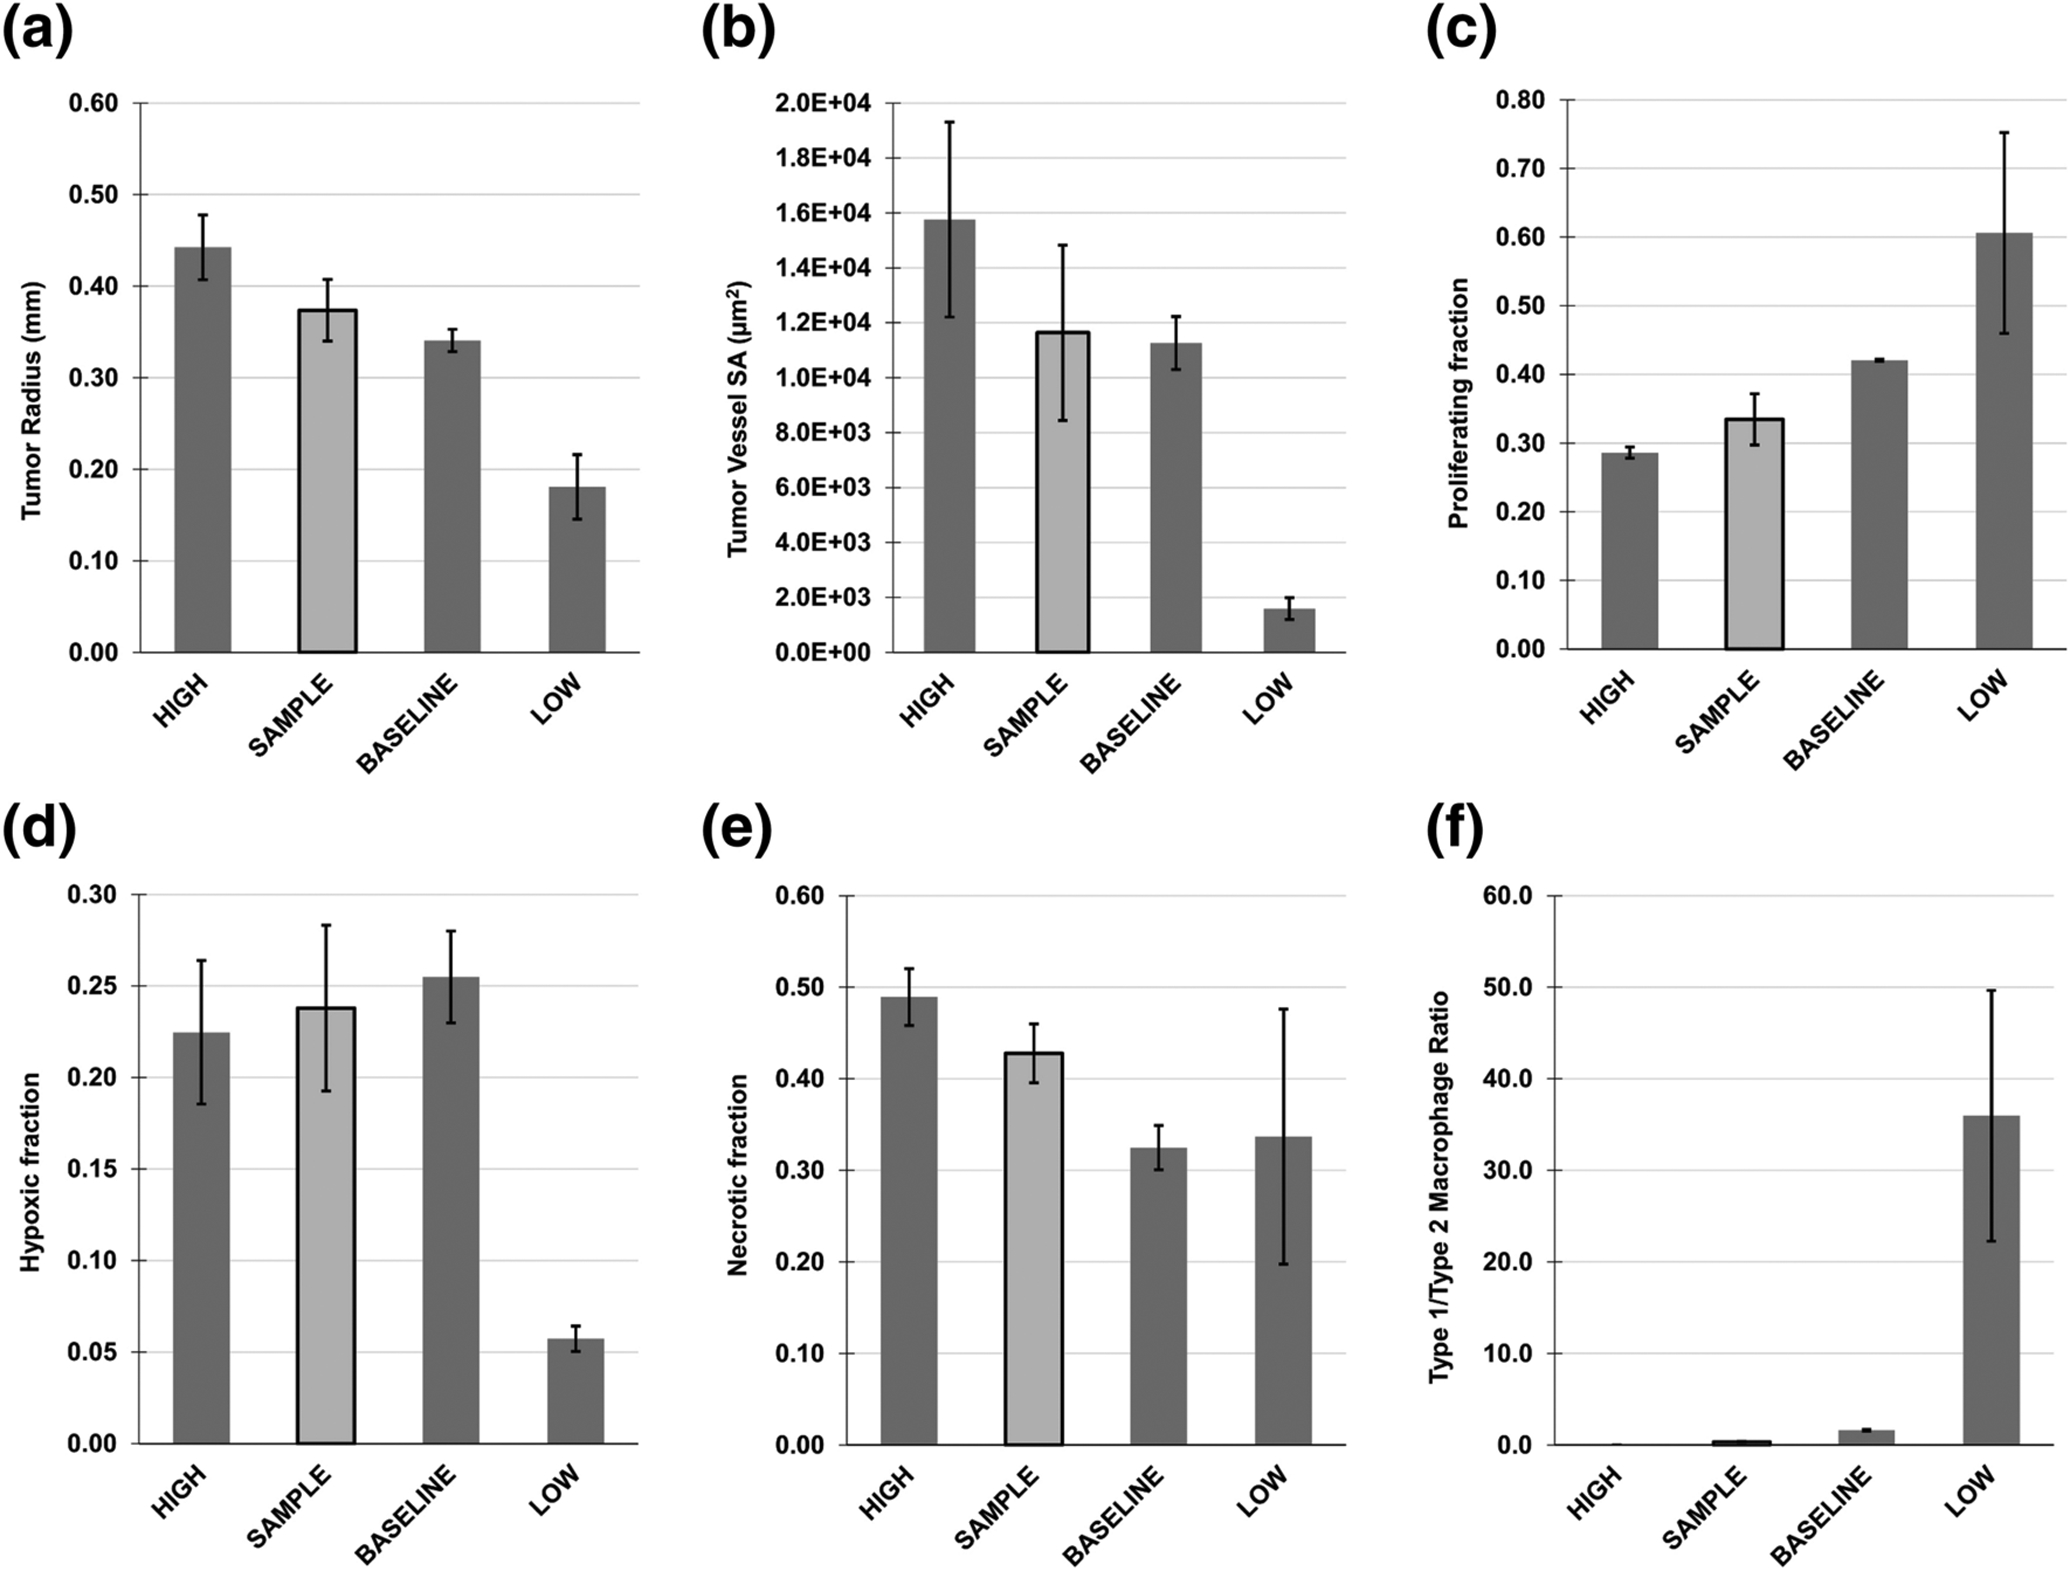
Comparison is at 400 h, by which time a steady rate of growth was achieved. LOW: minimum theoretical dysregulation; BASELINE: dysregulation based on baseline tumor values; HIGH: maximum theoretical dysregulation; SAMPLE: a representative patient case for illustration purposes. (A) Tumor radius, (B) tumor vessel surface area (SA), (C) proliferating tissue fraction, (D) hypoxic tissue fraction, (E) necrotic tissue fraction, (F) ratio of Type 1 to Type 2 macrophages.
Note that the LOW and HIGH cases are used to define a range of NSCLC metabolic dysregulation within the limits of the corresponding model parameter (Table 2). Individual SAMPLE parameters, however, are calibrated to actual metabolomic data, which can yield combinations of parameter values that elicit tumor behavior outside of the range of the behavior elicited by the LOW and HIGH cases. In other words, an ordered set of values in the model parameter space does not necessarily yield a correspondingly ordered set of tumor behavior, since this behavior can be highly nonlinear.
Simulation of Chemotherapy Response
The metabolomic data from the study in53 were used to calculate tumor model parameters for each patient, including the drug effect , and perform simulations of chemotherapy to assess the consistency of the expected response with each clinical classification. Clinical outcomes included complete response (CR), partial response (PR), stable disease (SD) and progressive disease (PD). The patient classifications of CR/PR vs. SD/PD as well as disease control (DC: CR/PR/SD) vs. PD were evaluated. In Figure 5A, there was a significant difference in the average log-transformed anti-parameter metabolite intensity between CR/PR vs. SD/PD as well as DC vs. PD patient groups, while the average log-transformed pro-parameter metabolite intensity trended higher in SD/PD and PD patients compared to CR/PR and DC, respectively. In Figure 5B, the results of simulating bolus drug injection in the patient cohort are shown at 3.4 days post-treatment in terms of tumor radius area-under-curve (AUC) and fraction of initial tumor radius. In all cases, there was a significant difference between responders (CR/PR and DC) and non-responders (SD/PD and PD), indicating that the model-simulated responses were able to classify the patient groups consistently with the clinical response based on the hypothesized linking of metabolite intensities to the model parameters (Table 1).
Fig 5. Patient Classification Based on Chemotherapy Response.
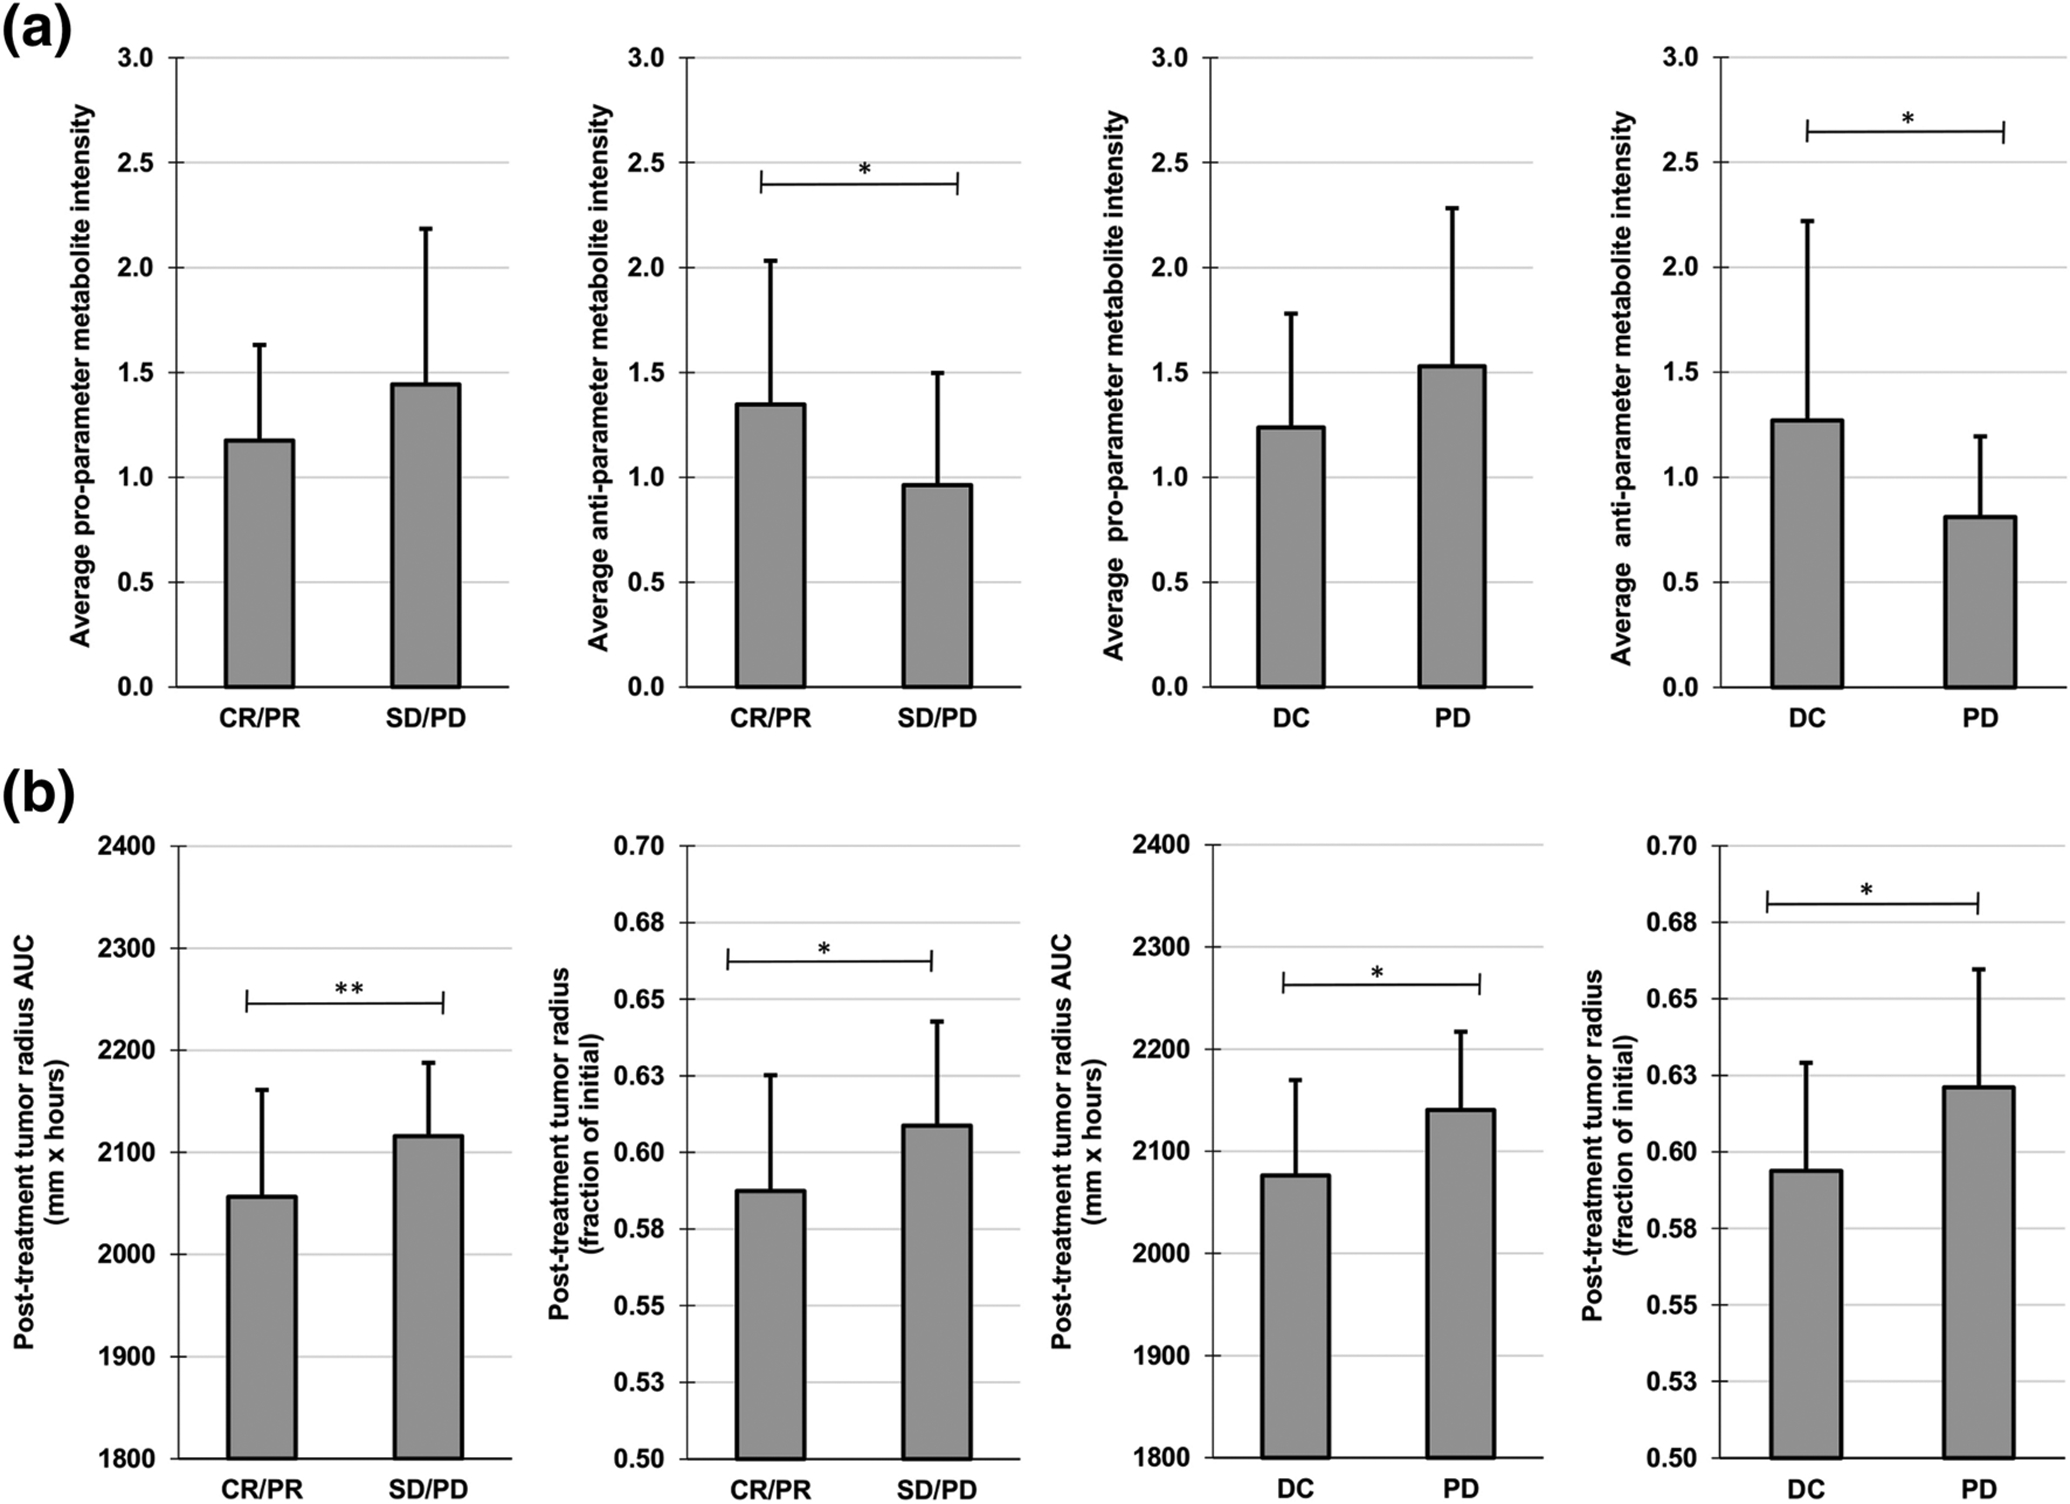
(A) Average log transformed metabolite intensities for patients with clinical therapeutic response data, classified as CR/PR (complete response/partial response), SD/PD (stable disease/progressive disease), DC (disease control = CR/PR/SD) or progressive disease (PD). (B) Simulated post-treatment tumor radius AUC and post-treatment tumor radius (fraction of initial) after bolus injection of drug for responders (CR/PR and DC) and non-responders (SD/PD and PD). Simulated tumor metrics were measured at 3.4 days post-treatment (n=3). *p≤0.05; **p≤0.01
DISCUSSION
This study develops a method to link clinically measureable metabolomic data to tissue-scale tumor behavior. The tumor model representation is modulated by key parameters influencing cell proliferation, tumor tissue vascularization, monocyte infiltration, tumor-associated macrophage polarization, lactic acid production, and drug effect. These parameters interact with each other nonlinearly to influence the simulated tumor progression. A dynamic range for these parameters is established using NSCLC as a representative cancer in order to enable representation of low to high metabolically active tumors. This approach enables the simulation of tumor progression based on particular metabolomic measurements. Metabolomic data obtained from a set of patients undergoing lung tumor core biopsies is used to show the feasibility of this approach.
Previous work has explored statistical approaches (e.g., machine learning) and network-oriented techniques (e.g., principal network analysis) to link the metabolome to tumor tissue-scale behavior; however, results based on these approaches may not necessarily represent any particular tumor55, 59. Although some supervised learning methods (such as PLS-DA) trained with chemotherapy response data can be used to predict the outcome of chemotherapy for new patients, they are limited in that they are only trained by the set of predictor variables (here, the metabolomic data). The application of a mechanistically-based spatio-temporal model of tumor growth to simulate chemotherapy extends the predictive capacity of such statistical models and may provide insight into the mechanisms of treatment resistance. The system proposed here could recreate the behavior of particular tumors for in silico evaluation prior to treatment, incorporating patient tumor-specific metabolomic data. An approach combining data-driven multivariate statistical techniques (i.e., machine learning) with mechanistic spatiotemporal tissue modeling may be advantageous compared to using either one alone.
Previous studies have sought to find robust metabolic biomarkers related to cancer diagnosis, prognosis, and chemotherapeutic efficacy (e.g.,5, 44, 59, 69, 86). With a few exceptions18, 62, 63, the linking of metabolomic data to tissue-scale behavior has been lacking. Since cancer is a heterogeneous disease, one advantage of using a spatiotemporal mechanistic model is the ability to simulate in time different proportions of proliferating, hypoxic and necrotic tissue within the tumor tissue51. This can occur with varying vascular densities due to the surrounding host tissue, causing heterogeneous oxygen distribution. Differences in vasculature between tumors are expected to affect the delivery and distribution of chemotherapeutics administered intravenously51. In previous work, chemotherapeutic efficacy has been determined in non-specific tumors16, 17, 51, 52. Here, we use metabolic characteristics to account for potential inter-patient differences in tumor vascularization, which through its effects influences the delivery and efficacy of chemotherapeutics.
Simulated patient tumor progression as a function of metabolomic data with the proposed methodology could differ from actual clinical results. The set of metabolites (Table 1) and the weighted coefficients assigned to them (Table 3) are critical in determining the model parameter values. The choice of metabolites depends on the specific cancer type and is determined from analysis of mass spectroscopy data for a set of patient data. As such, the set is expected to remain consistent for all patients with the same cancer type – in this study, NSCLC. However, the set may not be the same across different studies. For example, evaluating NSCLC patient plasma samples, eight metabolites were found to be associated with platinum chemotherapy response59, while seven metabolites were found in a study evaluating response to first-line chemotherapy of pemetrexed combined with either cisplatin or carboplatin69. Further, the weighted coefficients calculated via multivariate statistical techniques (i.e., machine learning) may be different depending on the techniques chosen to calculate them, such as a neural network or pathway analysis combined with correlation analysis, which would potentially arrive at different weights for the same set of metabolites. Such differences highlight the need to validate any particular technique with actual outcomes observed in patients. It may also be relevant to explore how correlations between metabolites may affect the simulated results. Moreover, various combinations of model parameter values could give similar results. The parameter values reflect the overlapping of metabolites and tumor biological characteristics, and their combined effects on tumor progression. Although simulated tumor growth may be similar, it is expected that under therapy the results would be further affected by therapy-related parameters. Response to drugs other than cisplatin to reflect actual patient regimens should be evaluated. Additionally, the association of particular metabolites to model parameters (Table 1) depends on the state-of-the-art of the biological knowledge and the mass spectrometry (MS) analysis of the tissue samples. As metabolomic knowledge progresses, it is to be expected that the parameters may need to be calculated based on additional or different sets of metabolites. Accordingly, the assumptions underlying their potential effects on the model parameters may need to be revisited. Care must also be taken to ensure that a consistent set of metabolites are captured during global metabolic profiling of patient biopsies across samples and analytical batches by using reliable state-of-the-art metabolite extraction techniques.
As the number of parameters required to discriminate between patients is unknown, it remains to be verified whether any particular set of parameters and their range of values can accurately simulate tumors from different patients. It may be necessary to augment the parameter set with further biologically-relevant information (e.g., immune cells other than macrophages) in order to achieve this goal. The range of values for the model parameters may also need to be expanded to accommodate the biological information, which could lead to redefinition of the scale describing metabolic dysregulation. A major constraint is that most of this type of information would be difficult to measure from individual tumor biopsies. Consequently, the model behavior depends mainly on the metabolomic information and how this information is weighted and combined to determine its effect on the model parameters. Using a small set of patient data, this study used parameter values linked to metabolite intensities modulated by weights and combinations based on clinical therapeutic responses to show consistency of the model simulated treatment responses with the clinical data. For future work, the weighting and combinations may need to be adjusted to fine-tune the system response to match what is observed with a larger test set of patient tumors, and then using this finer-calibrated system to predict the response for new patients. As a step towards this goal, this study establishes a framework to evaluate the complex interactions between metabolic parameters that drive tissue-scale tumor growth, providing a means to link the molecular- to the tissue-scale behavior.
Supplementary Material
ACKNOWLEDGEMENTS
HBF acknowledges partial support by the National Institutes of Health/National Cancer Institute Grant R15CA203605. J.L. acknowledges partial support from NSF through grants DMS-1714973 and the Simons Foundation (594598QN) for a NSF-Simons Center for Multiscale Cell Fate Research. J.L. also thanks the National Institutes of Health for partial support through grants 1U54CA217378-01A1 for a National Center in Cancer Systems Biology at UC Irvine and P30CA062203 for the Chao Family Comprehensive Cancer Center at UC Irvine.
Footnotes
CONFLICT OF INTERESTS STATEMENT
The authors declare no known conflicts of interest.
REFERENCES
- 1.Abusalamah H, Reel JM and Lupfer CR. Pyruvate affects inflammatory responses of macrophages during influenza A virus infection. Virus Res 286: 198088, 2020. [DOI] [PMC free article] [PubMed] [Google Scholar]
- 2.Adeva-Andany MM, Lopez-Maside L, Donapetry-Garcia C, Fernandez-Fernandez C and Sixto-Leal C. Enzymes involved in branched-chain amino acid metabolism in humans. Amino Acids 49: 1005–1028, 2017. [DOI] [PubMed] [Google Scholar]
- 3.Ananieva E Targeting amino acid metabolism in cancer growth and anti-tumor immune response. World J Biol Chem 6: 281–289, 2015. [DOI] [PMC free article] [PubMed] [Google Scholar]
- 4.Ananieva EA and Wilkinson AC. Branched-chain amino acid metabolism in cancer. Curr Opin Clin Nutr Metab Care 21: 64–70, 2018. [DOI] [PMC free article] [PubMed] [Google Scholar]
- 5.Armitage EG and Barbas C. Metabolomics in cancer biomarker discovery: current trends and future perspectives. J Pharm Biomed Anal 87: 1–11, 2014. [DOI] [PubMed] [Google Scholar]
- 6.Aspuria PP, Lunt SY, Varemo L, Vergnes L, Gozo M, Beach JA, Salumbides B, Reue K, Wiedemeyer WR, Nielsen J, Karlan BY and Orsulic S. Succinate dehydrogenase inhibition leads to epithelial-mesenchymal transition and reprogrammed carbon metabolism. Cancer Metab 2: 21, 2014. [DOI] [PMC free article] [PubMed] [Google Scholar]
- 7.Bamji-Stocke S, van Berkel V, Miller DM and Frieboes HB. A review of metabolism-associated biomarkers in lung cancer diagnosis and treatment. Metabolomics 14: 81, 2018. [DOI] [PMC free article] [PubMed] [Google Scholar]
- 8.Bearer EL, Lowengrub JS, Frieboes HB, Chuang YL, Jin F, Wise SM, Ferrari M, Agus DB and Cristini V. Multiparameter computational modeling of tumor invasion. Cancer Res 69: 4493–4501, 2009. [DOI] [PMC free article] [PubMed] [Google Scholar]
- 9.Beloborodova N, Bairamov I, Olenin A, Shubina V, Teplova V and Fedotcheva N. Effect of phenolic acids of microbial origin on production of reactive oxygen species in mitochondria and neutrophils. J Biomed Sci 19: 89, 2012. [DOI] [PMC free article] [PubMed] [Google Scholar]
- 10.Chanmee T, Ontong P, Konno K and Itano N. Tumor-associated macrophages as major players in the tumor microenvironment. Cancers (Basel) 6: 1670–1690, 2014. [DOI] [PMC free article] [PubMed] [Google Scholar]
- 11.Chen J, Chaurio RA, Maueroder C, Derer A, Rauh M, Kost A, Liu Y, Mo X, Hueber A, Bilyy R, Herrmann M, Zhao Y and Munoz LE. Inosine Released from Dying or Dead Cells Stimulates Cell Proliferation via Adenosine Receptors. Front Immunol 8: 504, 2017. [DOI] [PMC free article] [PubMed] [Google Scholar]
- 12.Cho HW, Kim SB, Jeong MK, Park Y, Miller NG, Ziegler TR and Jones DP. Discovery of metabolite features for the modelling and analysis of high-resolution NMR spectra. Int J Data Min Bioinform 2: 176–192, 2008. [DOI] [PMC free article] [PubMed] [Google Scholar]
- 13.Combs JA and DeNicola GM. The Non-Essential Amino Acid Cysteine Becomes Essential for Tumor Proliferation and Survival. Cancers (Basel) 11: 2019. [DOI] [PMC free article] [PubMed] [Google Scholar]
- 14.Cooke JP and Ghebremariam YT. Endothelial nicotinic acetylcholine receptors and angiogenesis. Trends Cardiovasc Med 18: 247–253, 2008. [DOI] [PMC free article] [PubMed] [Google Scholar]
- 15.Cristini V, Frieboes HB, Gatenby R, Caserta S, Ferrari M and Sinek J. Morphologic instability and cancer invasion. Clin Cancer Res 11: 6772–6779, 2005. [DOI] [PubMed] [Google Scholar]
- 16.Curtis LT, England CG, Wu M, Lowengrub J and Frieboes HB. An interdisciplinary computational/experimental approach to evaluate drug-loaded gold nanoparticle tumor cytotoxicity. Nanomedicine (Lond) 11: 197–216, 2016. [DOI] [PMC free article] [PubMed] [Google Scholar]
- 17.Curtis LT, van Berkel VH and Frieboes HB. Pharmacokinetic/pharmacodynamic modeling of combination-chemotherapy for lung cancer. J Theor Biol 448: 38–52, 2018. [DOI] [PMC free article] [PubMed] [Google Scholar]
- 18.Daghir-Wojtkowiak E, Wiczling P, Waszczuk-Jankowska M, Kaliszan R and Markuszewski MJ. Multilevel pharmacokinetics-driven modeling of metabolomics data. Metabolomics 13: 31, 2017. [DOI] [PMC free article] [PubMed] [Google Scholar]
- 19.de la Cruz-Lopez KG, Castro-Munoz LJ, Reyes-Hernandez DO, Garcia-Carranca A and Manzo-Merino J. Lactate in the Regulation of Tumor Microenvironment and Therapeutic Approaches. Front Oncol 9: 1143, 2019. [DOI] [PMC free article] [PubMed] [Google Scholar]
- 20.Dutta S, Ray S and Nagarajan K. Glutamic acid as anticancer agent: An overview. Saudi Pharm J 21: 337–343, 2013. [DOI] [PMC free article] [PubMed] [Google Scholar]
- 21.Eisenhauer EA, Therasse P, Bogaerts J, Schwartz LH, Sargent D, Ford R, Dancey J, Arbuck S, Gwyther S, Mooney M, Rubinstein L, Shankar L, Dodd L, Kaplan R, Lacombe D and Verweij J. New response evaluation criteria in solid tumours: revised RECIST guideline (version 1.1). Eur J Cancer 45: 228–247, 2009. [DOI] [PubMed] [Google Scholar]
- 22.Elia I, Broekaert D, Christen S, Boon R, Radaelli E, Orth MF, Verfaillie C, Grunewald TGP and Fendt SM. Proline metabolism supports metastasis formation and could be inhibited to selectively target metastasizing cancer cells. Nat Commun 8: 15267, 2017. [DOI] [PMC free article] [PubMed] [Google Scholar]
- 23.Fini MA, Elias A, Johnson RJ and Wright RM. Contribution of uric acid to cancer risk, recurrence, and mortality. Clin Transl Med 1: 16, 2012. [DOI] [PMC free article] [PubMed] [Google Scholar]
- 24.Frieboes HB, Zheng X, Sun CH, Tromberg B, Gatenby R and Cristini V. An integrated computational/experimental model of tumor invasion. Cancer Res 66: 1597–1604, 2006. [DOI] [PubMed] [Google Scholar]
- 25.Habte-Tsion HM, Ren M, Liu B, Ge X, Xie J and Chen R. Threonine modulates immune response, antioxidant status and gene expressions of antioxidant enzymes and antioxidant-immune-cytokine-related signaling molecules in juvenile blunt snout bream (Megalobrama amblycephala). Fish Shellfish Immunol 51: 189–199, 2016. [DOI] [PubMed] [Google Scholar]
- 26.Higuchi S, Osada Y, Shioiri Y, Tanaka N, Otomo S and Aihara H. [The modes of anti-inflammatory and analgesic actions of aspirin and salicylic acid]. Nihon Yakurigaku Zasshi 85: 49–57, 1985. [DOI] [PubMed] [Google Scholar]
- 27.Hilvo M, de Santiago I, Gopalacharyulu P, Schmitt WD, Budczies J, Kuhberg M, Dietel M, Aittokallio T, Markowetz F, Denkert C, Sehouli J, Frezza C, Darb-Esfahani S and Braicu EI. Accumulated Metabolites of Hydroxybutyric Acid Serve as Diagnostic and Prognostic Biomarkers of Ovarian High-Grade Serous Carcinomas. Cancer Res 76: 796–804, 2016. [DOI] [PMC free article] [PubMed] [Google Scholar]
- 28.Jung SY, Song HS, Park SY, Chung SH and Kim YJ. Pyruvate promotes tumor angiogenesis through HIF-1-dependent PAI-1 expression. Int J Oncol 38: 571–576, 2011. [DOI] [PubMed] [Google Scholar]
- 29.Kalluri R and Weinberg RA. The basics of epithelial-mesenchymal transition. J Clin Invest 119: 1420–1428, 2009. [DOI] [PMC free article] [PubMed] [Google Scholar]
- 30.Kim YS Malonate metabolism: biochemistry, molecular biology, physiology, and industrial application. J Biochem Mol Biol 35: 443–451, 2002. [DOI] [PubMed] [Google Scholar]
- 31.Koppula P, Zhang Y, Shi J, Li W and Gan B. The glutamate/cystine antiporter SLC7A11/xCT enhances cancer cell dependency on glucose by exporting glutamate. J Biol Chem 292: 14240–14249, 2017. [DOI] [PMC free article] [PubMed] [Google Scholar]
- 32.Kratochvill F, Neale G, Haverkamp JM, Van de Velde LA, Smith AM, Kawauchi D, McEvoy J, Roussel MF, Dyer MA, Qualls JE and Murray PJ. TNF Counterbalances the Emergence of M2 Tumor Macrophages. Cell Rep 12: 1902–1914, 2015. [DOI] [PMC free article] [PubMed] [Google Scholar]
- 33.Lee M, Chen GT, Puttock E, Wang K, Edwards RA, Waterman ML and Lowengrub J. Mathematical modeling links Wnt signaling to emergent patterns of metabolism in colon cancer. Mol Syst Biol 13: 912, 2017. [DOI] [PMC free article] [PubMed] [Google Scholar]
- 34.Lee O and O’Brien PJ. Modifications of Mitochondrial Function by Toxicants. Comprehensive Toxicology 1: 411–445, 2010. [Google Scholar]
- 35.Leighl NB Treatment paradigms for patients with metastatic non-small-cell lung cancer: first-, second-, and third-line. Curr Oncol 19: S52–58, 2012. [DOI] [PMC free article] [PubMed] [Google Scholar]
- 36.Leonard F, Curtis LT, Hamed AR, Zhang C, Chau E, Sieving D, Godin B and Frieboes HB. Nonlinear response to cancer nanotherapy due to macrophage interactions revealed by mathematical modeling and evaluated in a murine model via CRISPR-modulated macrophage polarization. Cancer Immunol Immunother 2020. [DOI] [PMC free article] [PubMed] [Google Scholar]
- 37.Leonard F, Curtis LT, Ware MJ, Nosrat T, Liu X, Yokoi K, Frieboes HB and Godin B. Macrophage Polarization Contributes to the Anti-Tumoral Efficacy of Mesoporous Nanovectors Loaded with Albumin-Bound Paclitaxel. Front Immunol 8: 693, 2017. [DOI] [PMC free article] [PubMed] [Google Scholar]
- 38.Leonard F, Curtis LT, Yesantharao P, Tanei T, Alexander JF, Wu M, Lowengrub J, Liu X, Ferrari M, Yokoi K, Frieboes HB and Godin B. Enhanced performance of macrophage-encapsulated nanoparticle albumin-bound-paclitaxel in hypo-perfused cancer lesions. Nanoscale 8: 12544–12552, 2016. [DOI] [PMC free article] [PubMed] [Google Scholar]
- 39.Lim JM, Kim G and Levine RL. Methionine in Proteins: It’s Not Just for Protein Initiation Anymore. Neurochem Res 44: 247–257, 2019. [DOI] [PMC free article] [PubMed] [Google Scholar]
- 40.Ma EH, Bantug G, Griss T, Condotta S, Johnson RM, Samborska B, Mainolfi N, Suri V, Guak H, Balmer ML, Verway MJ, Raissi TC, Tsui H, Boukhaled G, Henriques da Costa S, Frezza C, Krawczyk CM, Friedman A, Manfredi M, Richer MJ, Hess C and Jones RG. Serine Is an Essential Metabolite for Effector T Cell Expansion. Cell Metab 25: 345–357, 2017. [DOI] [PubMed] [Google Scholar]
- 41.Macklin P, McDougall S, Anderson AR, Chaplain MA, Cristini V and Lowengrub J. Multiscale modelling and nonlinear simulation of vascular tumour growth. J Math Biol 58: 765–798, 2009. [DOI] [PMC free article] [PubMed] [Google Scholar]
- 42.Mahlbacher G, Curtis LT, Lowengrub J and Frieboes HB. Mathematical modeling of tumor-associated macrophage interactions with the cancer microenvironment. Journal for Immunotherapy of Cancer 6: 10, 2018. [DOI] [PMC free article] [PubMed] [Google Scholar]
- 43.Marx V Biology: The big challenges of big data. Nature 498: 255–260, 2013. [DOI] [PubMed] [Google Scholar]
- 44.Mathe EA, Patterson AD, Haznadar M, Manna SK, Krausz KW, Bowman ED, Shields PG, Idle JR, Smith PB, Anami K, Kazandjian DG, Hatzakis E, Gonzalez FJ and Harris CC. Noninvasive urinary metabolomic profiling identifies diagnostic and prognostic markers in lung cancer. Cancer Res 74: 3259–3270, 2014. [DOI] [PMC free article] [PubMed] [Google Scholar]
- 45.Mattaini KR, Sullivan MR and Vander Heiden MG. The importance of serine metabolism in cancer. J Cell Biol 214: 249–257, 2016. [DOI] [PMC free article] [PubMed] [Google Scholar]
- 46.Mazzio EA, Boukli N, Rivera N and Soliman KF. Pericellular pH homeostasis is a primary function of the Warburg effect: inversion of metabolic systems to control lactate steady state in tumor cells. Cancer Sci 103: 422–432, 2012. [DOI] [PMC free article] [PubMed] [Google Scholar]
- 47.McAuslan BR, Reilly W, Hannan GN, Schindhelm K, Milthorpe B and Saur BA. Induction of endothelial cell migration by proline analogs and its relevance to angiogenesis. Exp Cell Res 176: 248–257, 1988. [DOI] [PubMed] [Google Scholar]
- 48.McDougall SR, Anderson AR and Chaplain MA. Mathematical modelling of dynamic adaptive tumour-induced angiogenesis: clinical implications and therapeutic targeting strategies. J Theor Biol 241: 564–589, 2006. [DOI] [PubMed] [Google Scholar]
- 49.Medina MA Mathematical modeling of cancer metabolism. Crit Rev Oncol Hematol 124: 37–40, 2018. [DOI] [PubMed] [Google Scholar]
- 50.Mendoza-Juez B, Martinez-Gonzalez A, Calvo GF and Perez-Garcia VM. A mathematical model for the glucose-lactate metabolism of in vitro cancer cells. Bull Math Biol 74: 1125–1142, 2012. [DOI] [PubMed] [Google Scholar]
- 51.Miller HA and Frieboes HB. Evaluation of Drug-Loaded Gold Nanoparticle Cytotoxicity as a Function of Tumor Vasculature-Induced Tissue Heterogeneity. Ann Biomed Eng 47: 257–271, 2019. [DOI] [PMC free article] [PubMed] [Google Scholar]
- 52.Miller HA and Frieboes HB. Pharmacokinetic/Pharmacodynamics Modeling of Drug-Loaded PLGA Nanoparticles Targeting Heterogeneously Vascularized Tumor Tissue. Pharm Res 36: 185, 2019. [DOI] [PMC free article] [PubMed] [Google Scholar]
- 53.Miller HA, Yin X, Smith SA, Hu X, Zhang X, Yan J, Miller DM, van Berkel V and Frieboes HB. Evaluation of disease staging and chemotherapeutic response in non-small cell lung cancer from patient tumor-derived metabolomic data. Lung Cancer 156: 20–30, 2021. [DOI] [PMC free article] [PubMed] [Google Scholar]
- 54.Moeslinger T, Friedl R, Volf I, Brunner M, Baran H, Koller E and Spieckermann PG. Urea induces macrophage proliferation by inhibition of inducible nitric oxide synthesis. Kidney Int 56: 581–588, 1999. [DOI] [PubMed] [Google Scholar]
- 55.Mucaki EJ, Zhao JZL, Lizotte DJ and Rogan PK. Predicting responses to platin chemotherapy agents with biochemically-inspired machine learning. Signal Transduct Target Ther 4: 1, 2019. [DOI] [PMC free article] [PubMed] [Google Scholar]
- 56.Mudumba S, Menezes A, Fries D and Blankenship J. Differentiation of PC12 cells induced by N8-acetylspermidine and by N8-acetylspermidine deacetylase inhibition. Biochem Pharmacol 63: 2011–2018, 2002. [DOI] [PubMed] [Google Scholar]
- 57.Newman AC and Maddocks ODK. Serine and Functional Metabolites in Cancer. Trends Cell Biol 27: 645–657, 2017. [DOI] [PubMed] [Google Scholar]
- 58.Patil MD, Bhaumik J, Babykutty S, Banerjee UC and Fukumura D. Arginine dependence of tumor cells: targeting a chink in cancer’s armor. Oncogene 35: 4957–4972, 2016. [DOI] [PMC free article] [PubMed] [Google Scholar]
- 59.Peng F, Liu Y, He C, Kong Y, Ouyang Q, Xie X, Liu T, Liu Z and Peng J. Prediction of platinum-based chemotherapy efficacy in lung cancer based on LC-MS metabolomics approach. J Pharm Biomed Anal 154: 95–101, 2018. [DOI] [PubMed] [Google Scholar]
- 60.Riesberg LA, McDonald TL, Wang Y, Chen XM, Holzmer SW, Tracy SM and Drescher KM. Creatinine downregulates TNF-alpha in macrophage and T cell lines. Cytokine 110: 29–38, 2018. [DOI] [PubMed] [Google Scholar]
- 61.Rodriguez PC and Ochoa AC. T cell dysfunction in cancer: role of myeloid cells and tumor cells regulating amino acid availability and oxidative stress. Semin Cancer Biol 16: 66–72, 2006. [DOI] [PubMed] [Google Scholar]
- 62.Roy M and Finley SD. Computational Model Predicts the Effects of Targeting Cellular Metabolism in Pancreatic Cancer. Front Physiol 8: 217, 2017. [DOI] [PMC free article] [PubMed] [Google Scholar]
- 63.Roy M and Finley SD. Metabolic reprogramming dynamics in tumor spheroids: Insights from a multicellular, multiscale model. PLoS Comput Biol 15: e1007053, 2019. [DOI] [PMC free article] [PubMed] [Google Scholar]
- 64.San-Millan I and Brooks GA. Reexamining cancer metabolism: lactate production for carcinogenesis could be the purpose and explanation of the Warburg Effect. Carcinogenesis 38: 119–133, 2017. [DOI] [PMC free article] [PubMed] [Google Scholar]
- 65.Sellers K, Fox MP, Bousamra M 2nd, Slone SP, Higashi RM, Miller DM, Wang Y, Yan J, Yuneva MO, Deshpande R, Lane AN and Fan TW. Pyruvate carboxylase is critical for non-small-cell lung cancer proliferation. J Clin Invest 125: 687–698, 2015. [DOI] [PMC free article] [PubMed] [Google Scholar]
- 66.Sikalidis AK Amino acids and immune response: a role for cysteine, glutamine, phenylalanine, tryptophan and arginine in T-cell function and cancer? Pathol Oncol Res 21: 9–17, 2015. [DOI] [PubMed] [Google Scholar]
- 67.Sriyudthsak K, Shiraishi F and Hirai MY. Mathematical Modeling and Dynamic Simulation of Metabolic Reaction Systems Using Metabolome Time Series Data. Front Mol Biosci 3: 15, 2016. [DOI] [PMC free article] [PubMed] [Google Scholar]
- 68.Tantawy AA and Naguib DM. Arginine, histidine and tryptophan: A new hope for cancer immunotherapy. PharmaNutrition 8: 100148, 2019. [Google Scholar]
- 69.Tian Y, Wang Z, Liu X, Duan J, Feng G, Yin Y, Gu J, Chen Z, Gao S, Bai H, Wan R, Jiang J, Liu J, Zhang C, Wang D, Han J, Zhang X, Cai L, He J and Wang J. Prediction of Chemotherapeutic Efficacy in Non-Small Cell Lung Cancer by Serum Metabolomic Profiling. Clin Cancer Res 24: 2100–2109, 2018. [DOI] [PubMed] [Google Scholar]
- 70.van de Ven AL, Wu M, Lowengrub J, McDougall SR, Chaplain MA, Cristini V, Ferrari M and Frieboes HB. Integrated intravital microscopy and mathematical modeling to optimize nanotherapeutics delivery to tumors. AIP Adv 2: 11208, 2012. [DOI] [PMC free article] [PubMed] [Google Scholar]
- 71.van den Berg RA, Hoefsloot HC, Westerhuis JA, Smilde AK and van der Werf MJ. Centering, scaling, and transformations: improving the biological information content of metabolomics data. BMC Genomics 7: 142, 2006. [DOI] [PMC free article] [PubMed] [Google Scholar]
- 72.Wanders D, Hobson K and Ji X. Methionine Restriction and Cancer Biology. Nutrients 12: 2020. [DOI] [PMC free article] [PubMed] [Google Scholar]
- 73.Ware MJ, Curtis LT, Wu M, Ho JC, Corr SJ, Curley SA, Godin B and Frieboes HB. Pancreatic adenocarcinoma response to chemotherapy enhanced with non-invasive radio frequency evaluated via an integrated experimental/computational approach. Sci Rep 7: 3437, 2017. [DOI] [PMC free article] [PubMed] [Google Scholar]
- 74.Watanabe H, Okada M, Kaji Y, Satouchi M, Sato Y, Yamabe Y, Onaya H, Endo M, Sone M and Arai Y. [New response evaluation criteria in solid tumours-revised RECIST guideline (version 1.1)]. Gan To Kagaku Ryoho 36: 2495–2501, 2009. [PubMed] [Google Scholar]
- 75.Wilmore DW and Shabert JK. Role of glutamine in immunologic responses. Nutrition 14: 618–626, 1998. [DOI] [PubMed] [Google Scholar]
- 76.Winkler MS, Nierhaus A, Rosler G, Lezius S, Harlandt O, Schwedhelm E, Boger RH and Kluge S. Symmetrical (SDMA) and asymmetrical dimethylarginine (ADMA) in sepsis: high plasma levels as combined risk markers for sepsis survival. Crit Care 22: 216, 2018. [DOI] [PMC free article] [PubMed] [Google Scholar]
- 77.Wu H, Ying M and Hu X. Lactic acidosis switches cancer cells from aerobic glycolysis back to dominant oxidative phosphorylation. Oncotarget 7: 40621–40629, 2016. [DOI] [PMC free article] [PubMed] [Google Scholar]
- 78.Wu JY, Huang TW, Hsieh YT, Wang YF, Yen CC, Lee GL, Yeh CC, Peng YJ, Kuo YY, Wen HT, Lin HC, Hsiao CW, Wu KK, Kung HJ, Hsu YJ and Kuo CC. Cancer-Derived Succinate Promotes Macrophage Polarization and Cancer Metastasis via Succinate Receptor. Mol Cell 77: 213–227 e215, 2020. [DOI] [PubMed] [Google Scholar]
- 79.Wu M, Frieboes HB, McDougall SR, Chaplain MA, Cristini V and Lowengrub J. The effect of interstitial pressure on tumor growth: coupling with the blood and lymphatic vascular systems. J Theor Biol 320: 131–151, 2013. [DOI] [PMC free article] [PubMed] [Google Scholar]
- 80.Wu Z, Wei D, Gao W, Xu Y, Hu Z, Ma Z, Gao C, Zhu X and Li Q. TPO-Induced Metabolic Reprogramming Drives Liver Metastasis of Colorectal Cancer CD110+ Tumor-Initiating Cells. Cell Stem Cell 17: 47–59, 2015. [DOI] [PubMed] [Google Scholar]
- 81.Yang M, Soga T, Pollard PJ and Adam J. The emerging role of fumarate as an oncometabolite. Front Oncol 2: 85, 2012. [DOI] [PMC free article] [PubMed] [Google Scholar]
- 82.Yizhak K, Chaneton B, Gottlieb E and Ruppin E. Modeling cancer metabolism on a genome scale. Mol Syst Biol 11: 817, 2015. [DOI] [PMC free article] [PubMed] [Google Scholar]
- 83.Yu H, Xia H, Tang Q, Xu H, Wei G, Chen Y, Dai X, Gong Q and Bi F. Acetylcholine acts through M3 muscarinic receptor to activate the EGFR signaling and promotes gastric cancer cell proliferation. Sci Rep 7: 40802, 2017. [DOI] [PMC free article] [PubMed] [Google Scholar]
- 84.Yu HE, Wang F, Yu F, Zeng ZL, Wang Y, Lu YX, Jin Y, Wang DS, Qiu MZ, Pu HY, Kang TB, Xie D, Ju HQ, Xu RH and Luo HY. Suppression of fumarate hydratase activity increases the efficacy of cisplatin-mediated chemotherapy in gastric cancer. Cell Death Dis 10: 413, 2019. [DOI] [PMC free article] [PubMed] [Google Scholar] [Retracted]
- 85.Yue Y, Huang W, Liang J, Guo J, Ji J, Yao Y, Zheng M, Cai Z, Lu L and Wang J. IL4I1 Is a Novel Regulator of M2 Macrophage Polarization That Can Inhibit T Cell Activation via L-Tryptophan and Arginine Depletion and IL-10 Production. PLoS One 10: e0142979, 2015. [DOI] [PMC free article] [PubMed] [Google Scholar]
- 86.Zhang A, Sun H, Yan G, Wang P, Han Y and Wang X. Metabolomics in diagnosis and biomarker discovery of colorectal cancer. Cancer Lett 345: 17–20, 2014. [DOI] [PubMed] [Google Scholar]
Associated Data
This section collects any data citations, data availability statements, or supplementary materials included in this article.