Abstract
Invasive fungal pathogens are major causes of human mortality and morbidity1,2. While numerous secreted effector proteins that reprogram innate immunity to promote virulence have been identified in pathogenic bacteria, there are no examples of analogous secreted effector proteins produced by human fungal pathogens. Cryptococcus neoformans, the most common cause of fungal meningitis and a major AIDS pathogen, induces a pathogenic type 2 response characterized by pulmonary eosinophilia and alternatively activated macrophages3–8. Here, we identify Cpl1 as an effector protein secreted by C. neoformans that drives alternative activation (also known as M2 polarization) of macrophages to enable murine pulmonary infection. We observed that Cpl1-enhanced macrophage polarization requires Toll-like receptor 4, best known as a receptor for bacterial endotoxin, but is also a poorly understood mediator of allergen-induced type 2 responses9–12. We show that this effect is due to Cpl1 itself and not contamination by lipopolysaccharide. Cpl1 is essential for virulence, drives polarization of interstitial macrophages in vivo, and requires type 2 cytokine signaling for its impact on infectivity. Strikingly, C. neoformans selectively associates with polarized interstitial macrophages during infection, suggesting a mechanism by which C. neoformans generates its own intracellular replication niche within the host. This work identifies a circuit whereby a secreted effector protein produced by a human fungal pathogen reprograms innate immunity, revealing an unexpected role for Toll-like receptor 4 in promoting pathogenesis of infectious disease.
Invasive fungal pathogens are responsible for approximately 1.5 million deaths per year 2. They account for 50% of AIDS-related deaths and have been referred to as a ‘neglected epidemic1. New, drug-resistant fungal pathogens have been identified13, while available drugs display limited efficacy and high toxicity14. Despite these challenges, how fungal pathogens evade host immunity to replicate and cause disease is incompletely understood. Fungal pathogens of plants utilize secreted effector proteins to thwart plant immune systems to enable infection15. While secretion of immunomodulatory effector proteins could be a strategy for fungi to drive infection in mammals, such molecules have yet to be identified. Cryptococcus neoformans is an environmental yeast that is acquired by inhalation and subsequently causes lethal meningitis in immunocompromised individuals3. The most common cause of fungal meningitis, Cryptococcal infection case fatality rates range from 10-70% and ~200,000 deaths annually16. During murine infection, C. neoformans induces a type 2 immune response detrimental to host protection5,7,8,17,18. Despite the importance of skewed immune responses on pulmonary infection outcome, little is known about how C. neoformans promotes type 2 inflammation.
Macrophage polarization by C. neoformans
Production of a polysaccharide capsule helps C. neoformans evade macrophage phagocytosis19. Capsular polysaccharides may have additional immunomodulatory functions20. To test whether capsule contributes to suppression of macrophage activation, we measured tumor necrosis factor (TNF) production by murine bone marrow-derived macrophages (BMDMs) exposed to wild type or capsule-deficient (cap60Δ) C. neoformans (KN99α serotype A strain), the non-pathogen Saccharomyces cerevisiae (s288c), or the pathogen Candida albicans (SC5314). C. neoformans failed to induce TNF, whereas S. cerevisiae and C. albicans both strongly induced TNF (Extended Data Fig. 1a). To investigate BMDM responses globally, we performed RNA-seq on cells stimulated with lipopolysaccharide (LPS), zymosan (a product of S. cerevisiae cell walls), S. cerevisiae, and wild type or capsule-deficient C. neoformans. C. neoformans induced negligible induction of inflammatory cytokine mRNAs (Extended Data Fig. 1c). Analysis of genes uniquely upregulated by C. neoformans revealed a partial signature reminiscent of alternatively activated/tolerized macrophages (M2 polarized macrophages), especially the induction of the M2 marker gene arginase-1 (Arg1), by both wild type and capsule-deficient strains. (Fig. 1a and Extended Data Fig. 1d). There was minimal induction of Arg1 by LPS, zymosan, or S. cerevisiae (Fig. 1b and Extended Data Fig. 1d). These results suggested that C. neoformans harbors a capsule-independent immunomodulatory mechanism.
Figure 1. Cryptococcus promotes arginase-1 expression in macrophages via a soluble, capsule-independent mechanism.
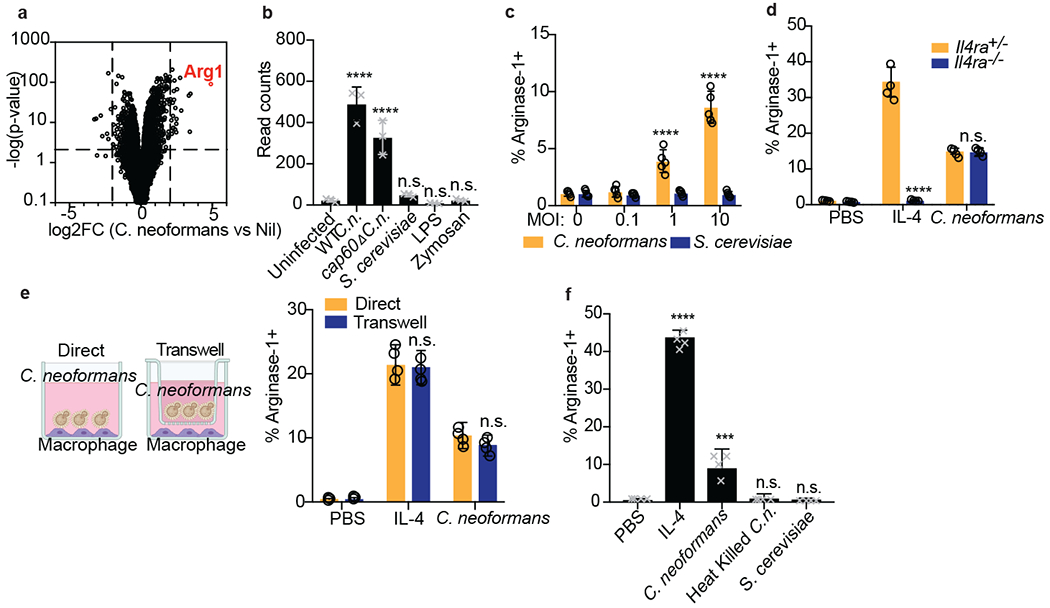
(a) Volcano plot of RNA-seq data showing uniquely differentially expressed genes (filtered on genes with <2 fold change in S. cerevisiae challenge) between uninfected and 6hrs wild type C. neoformans MOI=10 infected BMDMs based on DESeq2 analysis. Three biological replicates were used for each condition. (b) Normalized RNA-seq data on BMDMs stimulated for 6hrs with either WT C.n., cap60Δ C.n., S. cerevisiae (all at MOI=10), LPS (100ng/ml), or zymosan (10ug/ml). Three biological replicates were used for each condition. (c) Intracellular FACS staining for arginase-1 after 24hrs of infection with either C. neoformans or S. cerevisiae at the indicated MOIs. n = five biologically independent samples. (d) Arginase-1 intracellular FACS on either Il4ra+/− or Il4ra−/− BMDMs stimulated for 24hrs with IL-4 (40ng/ml) or WT C.n. (MOI=10). n = four biologically independent samples. (e) Arginase-1 intracellular FACS with identical conditions as in (d), but with the stimuli either added directly to the BMDMs or added to the top of a 0.2um transwell insert (image created with Biorender.com). n = four biologically independent samples. (f) Arginase-1 FACS on BMDMs stimulated for 24hrs with IL-4 (40ng/ml), live WT C.n., heat killed (55C for 15min) WT C.n., or S. cerevisiae (all MOI=10). n = four biologically independent samples. Data are presented as mean values +/− SD. ***p < 0.001; ****p < 0.0001 by one-way ANOVA with Bonferroni test.
To verify this, we performed intracellular flow cytometry staining for arginase-1 and iNOS protein and confirmed specific upregulation by IL-4 and LPS, respectively (Extended Data Fig. 1e). C. neoformans induced arginase-1 protein in BMDMs, whereas no induction was observed with S. cerevisiae (Fig. 1c). Reciprocally, Saccharomyces drove high levels of iNOS, whereas minimal induction was seen after C. neoformans infection (Extended Data Fig. 1b). Type 2 cytokines such as IL-4 and IL-13 promote expression of Arg1 in macrophages, thus we tested whether C. neoformans-mediated Arg1 expression required IL-4Rα. However, C. neoformans induced similar levels of arginase-1 in wild type and Il4ra−/− BMDMs, suggesting an alternative mechanism (Fig. 1d). We found that the C. neoformans-derived signal was soluble and did not require direct cell-cell interactions, as the fungi could still promote arginase-1 expression across a 0.2um transwell (Fig. 1e). However, heat-killed C. neoformans could not induce macrophage arginase-1, indicating an active process is required (Fig. 1f).
Identification of a fungal effector
To understand how C. neoformans influences macrophage polarization, we performed a forward genetic screen using a C. neoformans knockout collection generated in the KN99α strain background by our laboratory. In this collection, most non-essential genes (n=4,402) were individually replaced with a nourseothricin-resistance cassette (NAT1) by homologous recombination. We infected BMDMs with this collection in an arrayed format and then screened them by flow cytometry to identify C. neoformans mutant strains defective in macrophage arginase-1 induction (Fig. 2a). We re-screened the top 100 hits (Extended Data Fig. 2a) and identified 14 genes whose deletion yielded a reproducible defect in arginase-1 induction in response to C. neoformans (Extended Data Fig. 2b). Because we had already observed that the C. neoformans-derived signal was soluble, we focused on the one protein among the 14 that harbored a predicted signal peptide, encoded by CNAG_02797/CPL1. CPL1 is a predicted secreted protein of unknown molecular function with a cysteine-rich C-terminal domain (Fig. 2b). CPL1 was previously identified in an in vivo mouse screen of a small knockout library in a different yeast strain background, and was found to have defect in fitness as well as a defect in the production of visible polysaccharide capsule21. Another notable hit from our genetic screen was a knockout of GAT201, which encodes a transcription factor that is a key regulator of C. neoformans virulence, which binds to the CPL1 promoter 21,22. As effector proteins from plant fungal pathogens are highly enriched for small, secreted cysteine-rich proteins, we selected CPL1 for further study23.
Figure 2. Identification of CPL1 as a fungal effector by forward genetics.
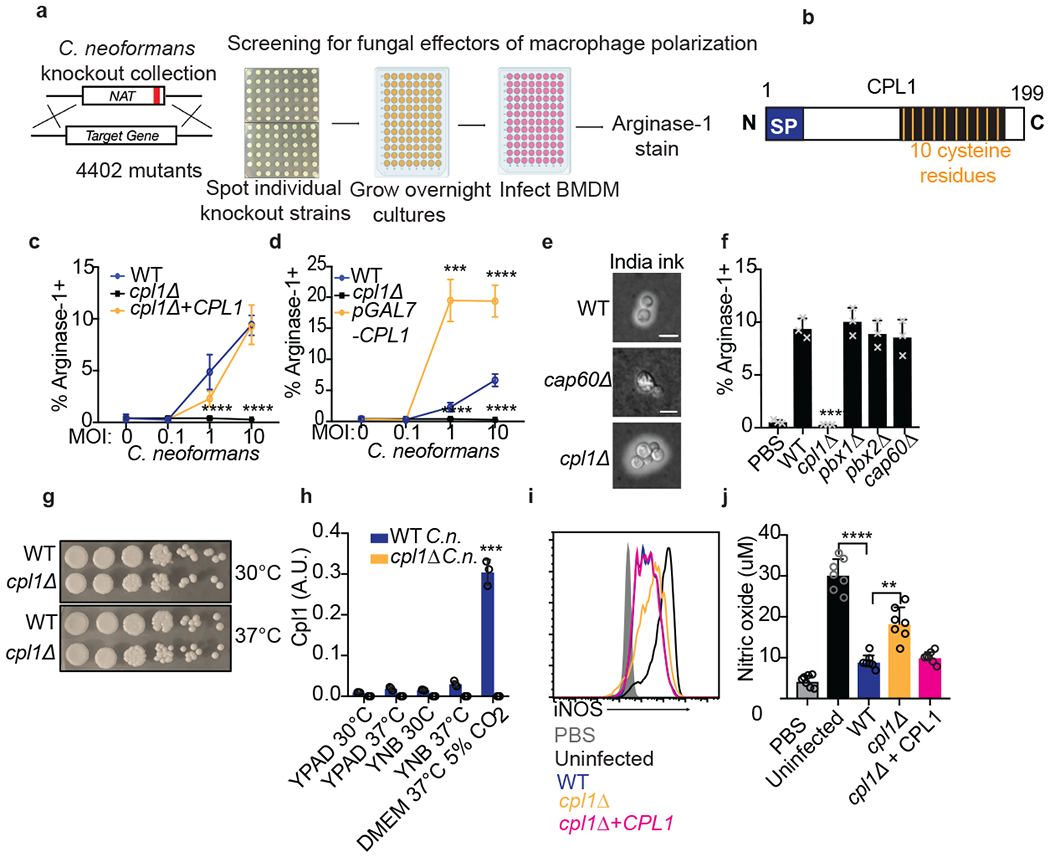
(a) Genetic screening strategy to identify fungal effectors that drive arginase-1 expression. (b) Outline of CPL1 protein domain architecture. (c) Complementation assay using arginase-1 FACS on BMDMs stimulated for 24hrs with either WT, cpl1Δ, or cpl1Δ + CPL1 C.n. strains at the indicated MOIs. n = four biologically independent samples. (d) Arginase-1 FACS on BMDMs stimulated for 24hrs with WT, cpl1Δ, or pGAL7-CPL1 C.n. strains at the indicated MOIs. n = four biologically independent samples. (e) India ink staining for capsular polysaccharides in the indicated strains after overnight culture in 10% Sabouraud media. Scale bar indicates 5 microns. Data are representative of two independent experiments. (f) Arginase-1 FACS on BMDMs stimulated for 24hrs with the indicated capsule mutant strains at MOI=10. n = three biologically independent samples. (g) Spotting assay for WT vs cpl1Δ C.n. growth on YPAD plates incubated at the indicated temperatures. (h) RT-qPCR for CPL1 mRNA expression in cultures grown to OD600=1.0 in the indicated conditions (A.U. = arbitrary units relative to ACT1). n = three biologically independent samples. (i) Representative FACS histogram for intracellular iNOS protein levels in BMDMs pre-infected with the indicated strains at an MOI=10 for 2hrs followed by 24hr stimulation with LPS (100ng/ml) and IFNγ (50ng/ml). (j) Total nitric oxide in supernatants from BMDMs treated as in (i). n = seven biologically independent samples. Data are presented as mean values +/− SD. **p < 0.01; ***p < 0.001; ****p < 0.0001 by one-way ANOVA with Bonferroni test.
To complement the cpl1Δ phenotype, we inserted the CPL1 gene into a neutral locus24. This complemented strain displayed restored arginase-1 induction capacity (Fig. 2c). In addition, overexpression of CPL1 triggered increased arginase-1 induction (Fig. 2d). Experiments performed in different C. neoformans strain backgrounds have yielded different conclusions regarding the extent of the capsule defect of cpl1Δ mutants25,26. We found that, in the KN99α background used here, both India ink staining and FACS staining of yeast with antibodies against GXM, the major capsular polysaccharide, showed that the cpl1Δ strain contained equivalent to slightly increased surface GXM levels compared to wild type, whereas cap60Δ showed an expected loss of staining (Fig. 2e and Extended Data Fig. 2c). While we did not expect capsule production to be related to the arginase-1 induction phenotype, as cap60Δ showed equivalent upregulation to wild type by RNA-seq and no classical capsule mutants were obtained in our screen, we nonetheless tested a series of capsule-related mutants that clustered with cpl1Δ in chemogenomic profiles25. None showed altered arginase-1 upregulation by BMDMs (Fig. 2f). Thus, the phenotype of cpl1Δ mutants on arginase-1 induction could not be explained by a defect in the capsule.
In addition to producing a capsule, C. neoformans has virulence attributes including the production of melanin, thought to have antioxidant properties, and the ability to grow at 37°C27. We observed no specific defect for cpl1Δ in growth at 37°C (Fig. 2g). We next asked whether temperature or culture conditions had any impact on CPL1 expression, as genes related to virulence may be predicted to have increased expression in mammalian tissue culture conditions. Indeed, we found that tissue culture conditions (37°C, DMEM, 10% fetal calf serum, 5% CO2) dramatically increased CPL1 mRNA levels compared to culture in YPAD or YNB at either 30°C or 37°C (Fig. 2h). The upregulation of CPL1 in mammalian tissue culture conditions involved redundant contributions of 5% CO2 and 10% fetal calf serum (Extended Data Fig. 2d). We found qualitatively equivalent melanin induction (Extended Data Fig. 2e). Lastly, we examined macrophage TNF production in response to challenge with cpl1Δ C. neoformans to determine whether the loss of arginase-1 expression was secondary to a gain in classical macrophage activation. While zymosan generated a strong response from BMDMs, neither WT nor cpl1Δ C. neoformans elicited any TNF production (Extended Data Fig. 2f).
C. neoformans can suppress nitric oxide production by macrophages in response to LPS and IFNγ via a capsule-independent mechanism27. As alternative macrophage activation antagonizes induction of antimicrobial factors such as iNOS, we tested whether CPL1 had an impact on iNOS expression and nitric oxide production. We infected BMDMs for 2hrs with either wild-type, cpl1Δ, or cpl1Δ+CPL1 C. neoformans followed by stimulation with LPS and IFNγ for 24hrs. We then used flow cytometry to assess iNOS expression and quantified total nitric oxide in the BMDM supernatants. Consistent with previous reports, we found that wild-type C. neoformans suppressed iNOS expression and nitric oxide production (Fig. 2i and 2j). Strikingly, the cpl1Δ strain was defective in suppressing iNOS expression and nitric oxide production (Fig. 2i and 2j). This effect was strong but not complete, indicating that additional modulators exist.
Fungal potentiation IL-4 signaling
We hypothesized that Cpl1 might act directly on macrophages. To test this model, we expressed recombinant CPL1-6xHis (rCPL1) using the yeast Pichia pastoris (Fig. 3a). We stimulated macrophages with dilutions of purified protein, or the equivalent dilutions derived from mock purifications from wild type yeast to control for potential background contaminants. Using flow cytometry, we found that rCPL1 could induce arginase-1 in BMDMs at nanomolar concentrations (Fig. 3b). Using a strain with an endogenous CPL1-6xHis-tag, we found that the endogenous concentration of this protein produced in supernatants under mammalian tissue culture conditions was ~10nM, which was within the range we observe activity (Extended Data Fig. 3a). As C. neoformans is well-known to induce type 2 cytokines such as IL-4 during pulmonary infection, we tested whether rCPL1 induction of arginase-1, a well-known IL-4-responsive gene, might reflect an ability to enhance the effects of IL-4. We stimulated BMDMs with IL-4 along with dilutions of rCPL1. We found that rCPL1 potentiated the induction of arginase-1 by IL-4 (Fig. 3b). We additionally observed that wild type C. neoformans strongly potentiated induction of Arg1 mRNA in BMDMs by IL-4 in a CPL1-dependent manner (Extended Data Fig. 3b). While Arg1 is not a marker of human IL-4-stimulated myeloid cells, we found that Mrc1 expression could be potentiated by C. neoformans in the THP-1 human monocytic cell line as well as primary human monocyte-derived macrophages (Extended Data Fig. 3c and 3d).
Figure 3. CPL1 potentiates IL-4 signaling via TLR4.
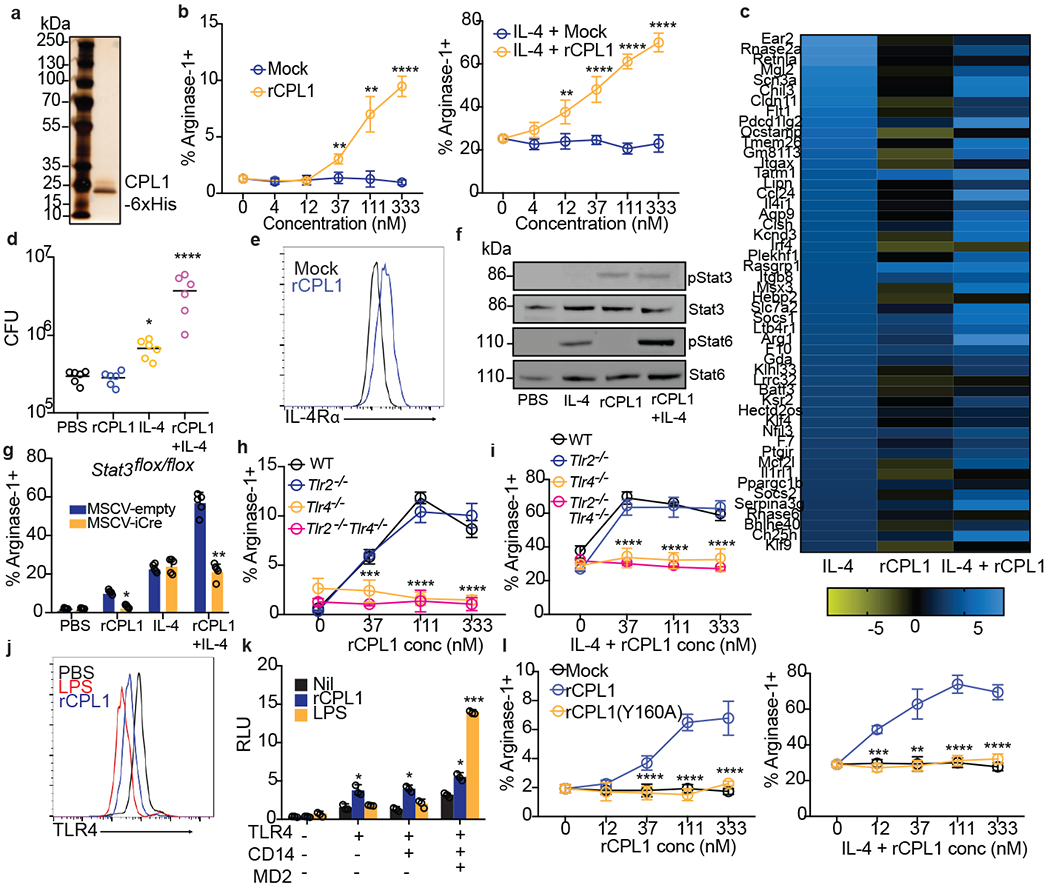
(a) Silver stained SDS-PAGE gel of recombinant CPL1. n = 5 independent experiments. (b) Arginase-1 FACS on BMDMs stimulated for 24hrs with mock or purified rCPL1 alone (left) or with IL-4 (right). n = 3 biologically independent samples. (c) RNA-seq heatmap of the top 50 BMDM IL-4-induced genes comparing the log2 fold changes of indicated stimulations to PBS. (d) C. neoformans CFUs after 48hrs of incubation at 37°C, 5% CO2 in supernatants from BMDMs stimulated for 24hrs as in (c). n = six biologically independent samples. (e) FACS for IL-4Rα levels on BMDMs stimulated for 24hrs with rCPL1 or mock. (f) Western blot for indicated proteins on BMDMs stimulated as in (c) for 8hrs. Data are representative of three independent experiments. (g) Arginase-1 FACS on STAT3flox/flox BMDMs transduced with empty vector or iCre retrovirus and stimulated as in (c). n = five biologically independent samples. (h) Arginase-1 FACS in WT, Tlr2−/−, Tlr4−/−, or Tlr2−/−Tlr4−/− BMDMs stimulated for 24hrs with rCPL1. n = 3 biologically independent samples. (i) Same as (h) but plus IL-4. n = 3 biologically independent samples. (j) FACS for TLR4 levels on BMDMs stimulated for 1hr with LPS (100ng/ml) or rCPL1. n = 3 biological experiments. (k) Luminescence in HEK293T cells transfected with the indicated plasmids plus NF-kB luciferase and stimulated for 6hrs with either rCPL1 or LPS (100ng/ml). n = 3 biologically independent samples. (l) Arginase-1 FACS in BMDMs stimulated for 24hrs with mock, rCPL1, or rCPL1(Y160A) alone (left) or in combination with IL-4 (right). n = 3 biologically independent samples. Concentrations are IL-4 (10ng/ml) and rCPL1 (111nM) unless otherwise noted. Data are presented as mean values +/− SD. *p < 0.05; **p < 0.01; ***p < 0.001; ****p < 0.0001 by one-way ANOVA with Bonferroni test.
RNA-seq on BMDMs stimulated for 24hrs with either PBS, IL-4 alone, rCPL1 alone, or both (IL-4 + rCPL1) confirmed that rCPL1 increased expression of a large subset of IL-4-induced genes, indicating this is not specific to Arg1 expression (Fig. 3c and Extended Data Fig. 3e). The RNA-seq data also showed striking potentiation of IL-4-induced Arg1 mRNA expression by rCPL1 (Extended Data Fig. 3e). Another gene that showed strong expression potentiation by rCPL1+IL-4 was Ccl24, encoding an eosinophil chemoattractant (Extended Data Fig. 3e). Using a transwell migration assay, we found that splenic eosinophils indeed showed increased chemotaxis towards supernatants derived from BMDMs stimulated with IL-4 + rCPL1 compared to IL-4 alone (Extended Data Fig. 3f). We also found that C. neoformans showed enhanced growth in supernatants from BMDMs stimulated with IL-4 + rCPL1 compared to supernatants from either stimulation alone, suggesting that alternatively activated macrophages may secrete nutrients that promote fungal growth (Fig. 3d). These results demonstrated that CPL1 enhances the effect of IL-4 on macrophages, generating conditions that are beneficial to fungal growth in vitro.
We investigated how CPL1 and IL-4 may cooperate to amplify the IL-4 transcriptional signature. One intriguing hypothesis was that CPL1 may enhance macrophage sensitivity to IL-4 at the level of the receptor expression. Indeed, FACS staining revealed that C. neoformans drove increased surface levels of BMDM IL-4Rα in a manner dependent on CPL1, and that rCPL1 was sufficient to produce this effect (Fig. 3e and Extended Data Fig. 4a). Salmonella typhimurium has been reported to drive macrophage M2-like polarization via the effector protein SteE, which activates phosphorylation of STAT328,29. We noted in those reports that the readout for M2 polarization was increased IL-4Rα levels, and that STAT3 was required for IL-4Rα upregulation by Salmonella. To test whether similar signaling pathways were required for the activity of CPL1, we performed western blots on extracts of BMDMs to assess phosphorylation of STAT3 and STAT6 after stimulation with either IL-4, rCPL1, or IL-4 + rCPL1. While we saw no effect of CPL1 during immediate early time points (Extended Data Fig. 4b and 4c), at 8hrs post-stimulation rCPL1 drove hyper-phosphorylation of STAT6 when given in combination with IL-4 (Fig. 3f and Extended Data Fig. 3d). Time course analysis showed that rCPL1 promoted STAT3 phosphorylation starting at 2hrs after stimulation in BMDMs, consistent with STAT3 activation preceding hyper-STAT6 activation (Extended Data Fig. 4e). To test the requirement for STAT3, we transduced Stat3flox/flox bone marrow using murine retrovirus (MSCV) encoding iCre and generated BMDMs. STAT3 was found to be required for both arginase-1 induction and IL-4 potentiation by CPL1 (Fig. 3g). These data indicate that activation of STAT3 is downstream of CPL1.
TLR4 as a mediator of CPL1 activity
We next sought to identify receptors involved in this process. Previous work had shown that Bacillus Calmette Guerrin (BCG) can thwart macrophage intracellular immunity by promoting expression of arginase-130 via engagement of TLR2-MyD88 signaling to activate STAT3, which drives transcription of arginase-1. We therefore tested MyD88−/− BMDMs in our arginase-1 assays. We found that MyD88-deficiency abrogated arginase-1 upregulation by rCPL1 (Extended Data Fig. 5a). We also observed that rCPL1 instead quenched arginase-1 upregulation by IL-4 in MyD88−/− BMDMs, which may be due to induction of type I IFN downstream via the adaptor TRIF (Extended Data Fig. 5a). We hypothesized that MyD88 signaling promoted STAT3 phosphorylation via induction of autocrine/paracrine-acting cytokines. As predicted by such a model, we found that co-culture of CD45.2+ MyD88−/− BMDMs with wild type congenic (CD45.1+) BMDMs rescued the arginase-1 induction (Extended Data Fig. 5b).
As MyD88 is an adaptor molecule for Toll-like receptor (TLR) signaling31, we tested whether TLRs were required for the activity of CPL1. We found that deletion of Unc93b1, which is required for endosomal nucleic acid-sensing TLRs to function32, did not impact CPL1-dependent arginase-1 induction (data not shown). However, we found abrogation of arginase-1 induction in response to CPL1 in the absence of the LPS receptor TLR4, while TLR2-deficiency had no effect (Fig. 3h and 3i). There are molecules that activate TLR4 signaling without directly binding the receptor such as palmitic acid33. Notably, while TLR4-binding agonists direct rapid TLR4 endocytosis 34, indirect activators such as palmitic acid do not result in TLR4 internalization33. To test the impact of CPL1 in TLR internalization, we stained BMDMs stimulated for 1hr with either LPS or rCPL1 and measured TLR4 surface levels by flow cytometry. We found that rCPL1 stimulation decreased surface TLR4 levels (Fig. 3j), though not to the same extent as LPS, consistent with a model in which CPL1 is a TLR4 ligand.
While our data did not find robust arginase-1 induction by LPS, we nonetheless addressed whether CPL1 phenotypes could be due to LPS contamination. First, we stimulated BMDMs with dilutions of LPS and tested arginase-1 upregulation. We found that LPS only induced robust arginase-1 at a high concentration (1ug/ml) (Extended Data Fig. 5c). As the high amount of LPS required for arginase-1 upregulation was at a concentration that induced robust caspase-11-dependent pyroptosis when given with cholera toxin B (CTB) (Extended Data Fig. 5d), we reasoned that if the effect of CPL1 were due to LPS contamination, we would observe pyroptosis when stimulating BMDMs with CPL1 + CTB35,36. However, we observed no pyroptosis induced by CPL1+CTB stimulation (Extended Data Fig. 5e). LPS is heat stable, whereas proteins can be denatured by heat. We observed that boiling of rCPL1 completely abrogated arginase-1 induction and potentiation by IL-4, again consistent with a role for CPL1 protein and not LPS (Extended Data Fig. 5f). As another approach, we incubated rCPL1 with polymyxin B to sequester any LPS in the preparation. We found that polymyxin B treatment had no impact on the ability of rCPL1 to promote arginase-1 expression (Extended Data Fig. 5g and 5h). Lastly, we tested whether expression of CPL1 in BMDMs could phenocopy the impact of the purified recombinant protein, as this would prevent the possibility of introducing microbial contaminants. We cloned CPL1 into a murine retroviral vector with an IL-2 signal peptide and transduced mouse bone marrow. After differentiation into BMDMs, we stimulated these cells with dilutions of IL-4. We found that transduction of CPL1 into macrophages potentiated the IL-4 induction of arginase-1 compared to control transductions (Extended Data Fig. 5i). Altogether, these data strongly support the conclusions that CPL1 activates TLR4 and this is not due to inadvertent endotoxin contamination.
While best known as a sensor of LPS, TLR4 plays a key role in driving allergic inflammation in response to house dust mite extract (HDM) and low dose LPS can also drive allergic inflammation in response to ovalbumin10,11. Two dominant allergens in HDM are the protease Derp1 and the lipid-binding protein Derp237,38. One mechanism by which Derp2 drives allergic responses is by acting as an MD2 mimic to activate TLR49. To test whether CPL1 could activate TLR4 via a similar mechanism, we reconstituted NF-kB-luciferase reporter expressing HEK293T cells with murine TLR4 alone or in combination with co-receptors CD14 and MD2 and then stimulated these cells with rCPL1 or LPS. While LPS only drove luciferase expression when TLR4 was co-expressed with CD14 and MD2, rCPL1 induced luciferase in cells expressing TLR4 only, suggesting that CPL1 can bypass a requirement for MD2 in TLR4 activation (Fig. 3k). In previous studies on Derp2, it was found that mutation of a key tyrosine residue flanked by two cysteines, which was similar to a conserved motif found on MD2, abrogated TLR4 activation, despite no sequence homology between the two proteins9. We analyzed the CPL1 amino acid sequence and generated a recombinant protein with a mutation (Y160A) in an analogous motif (Extended Data Fig. 5j). Strikingly, we found that this mutation eliminated the ability of CPL1 to augment both IL-4-independent and -dependent arginase-1 expression (Fig. 3l). While it remains to be demonstrated whether CPL1 indeed activates TLR4 via an analogous mechanism to that of Derp2, this result provided an additional control for possible contaminants.
Lastly, to control for effects that may be specific to P. pastoris-derived proteins, we purified CPL1 from supernatants of a C. neoformans strain expressing CPL1-6xHis under the control of the H3 promoter and inserted into a neutral locus. We found that this rCPL1 also promotes arginase-1 on its own and potentiates IL-4-induced arginase-1 expression in BMDMs in a TLR4-dependent manner (Extended Data Fig. 6a and 6b).
CPL1 enhances type 2 immunity in vivo
We next examined whether CPL1 contributes to type 2 inflammation during in vivo pulmonary infection. Deletion of IL-4 signaling in myeloid cells has been shown to be beneficial to the host during Cryptococcus infection, however, the lung myeloid compartment is highly heterogenous and the specific identity of the arginase1+ cells during fungal infection remains unclear4,39. We infected arginase-1-YFP reporter mice (YARG) with wild-type C. neoformans and processed lung tissue for flow cytometry on day 10. Analysis of the CD45+YARG+ cells revealed that interstitial macrophages (IMs) (CD45+CD64+MerTK+SiglecF-) are the major cell type that expresses Arg1 during infection (Fig. 4a and 4b). To test the role of CPL1, we infected YARG mice intranasally with either wild type, cpl1Δ, or qsp1Δ, a strain lacking a secreted peptide important during in vivo infection22. We found that cpl1Δ infection resulted in a striking reduction in YARG+ interstitial macrophages compared to both wild type and qsp1Δ infections (Fig. 4c). To determine whether this decrease in YARG+ cells was secondary to a global reduction in type 2 immunity we assessed other outputs of IL-4/IL-13 signaling such as eosinophilia, IgG1 class switching in germinal center B cells, and cytokine production by CD4+ T cells. Compared to wild type and qsp1Δ , cpl1Δ infection showed a modest reduction in lung eosinophils (Extended Data Fig. 7a), which is not surprising given that IL-4 stimulated macrophages produce eosinophil-recruiting chemokines such as CCL2440. On the other hand, we observed no difference between any fungal genotypes in the levels of IL-4-dependent IgG1 class switching (Extended Data Fig. 7b and 7c) or in CD4+ T cell cytokine production (Extended Data Fig. 7d and 7e). These data identify a crucial role for CPL1 in promoting local type 2 inflammation in the lung, although we cannot rule out effects on additional cell types beyond IMs.
Figure 4. CPL1 promotes arginase-1 expression in pulmonary interstitial macrophages and is required for virulence.
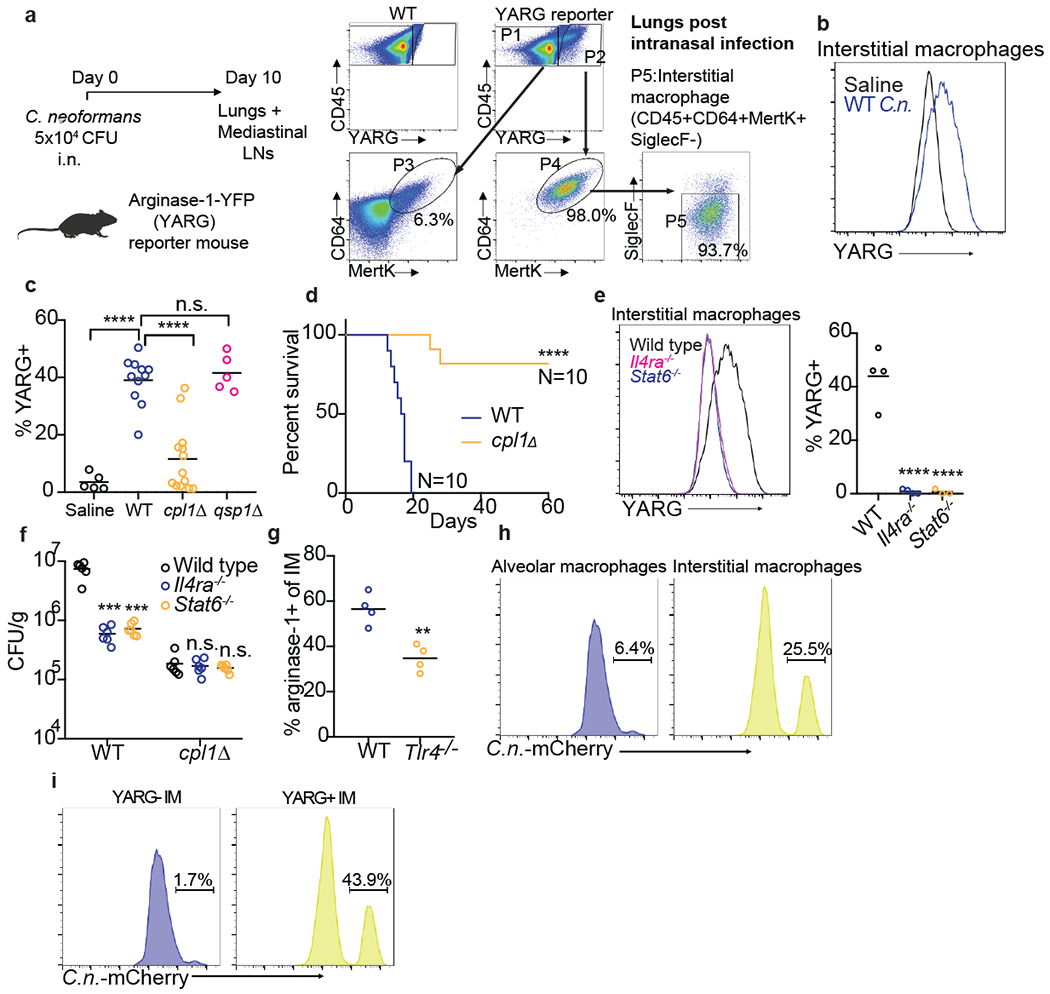
(a) FACS subgating on CD45+YARG+ lung cells from arginase-1-YFP (YARG) mice infected intranasally with 5x10⁴ CFU WT C. neoformans for 10 days. (b) Representative histogram of YARG expression in lung interstitial macrophages from mice injected intranasally with either saline or 5x10⁴ CFU WT C.n. for 10 days. (c) Quantification of YARG expression by FACS on interstitial macrophages from mice injected intranasally with either saline (N=5 mice), WT (N=11 mice), cpl1Δ (N=14 mice), or qsp1Δ (N=5 mice) Kn99a (5x10⁴ CFU) for 10 days; statistical significance determined by one-way ANOVA with Bonferroni test. (d) Kaplan-Meier survival curve analysis of mice infected with WT (N=10mice) or cpl1Δ C.n. (N=10 mice); ****p < 0.0001 by Mantel-Cox test. (e) Representative histogram (left) and quantification of YARG expression on WT, Il4ra−/−, or Stat6−/− (all N=4 mice) infected for 10 days as in (a). (f) CFUs from lungs of the indicated mouse genotypes (N=6 mice for each genotype) infected for 10 days with either WT or cpl1Δ strains; statistical significance determined by one-way ANOVA with Bonferroni test. (g) Arginase-1 FACS on lung IMs from WT or Tlr4−/− mice infected as in (a); statistical significance determined by unpaired two-sided T-test. (h) Representative FACS histograms of C.neoformans-mCherry expression in alveolar macrophages (left) or interstitial macrophages (right) after 10 days of infection. (i) Representative FACS histograms of C.neoformans-mCherry expression in interstitial macrophages from YARG mice gated on YARG-negative IMs (left) or YARG-positive IMs (right). *p < 0.05; **p < 0.01; ***p < 0.001; ****p < 0.0001
A defect in type 2 cytokine signaling increases survival of mice infected with C. neoformans4,8,17. Since we found that mice infected with cpl1Δ C. neoformans exhibited decreased type 2 inflammation, we asked whether CPL1 impacted mouse survival. Strikingly, we found that nearly all mice survived infection by a strain lacking CPL1 (Fig. 4d). Complementation of the mutant with the wild-type gene rescues the in vivo YARG and eosinophil defects as well as the virulence defect (Extended Data Fig. 8a, 8b, 8c). Infection with cpl1Δ C. neoformans additionally resulted in decreased fungal burden in the brain (Extended Data Fig. 8d). We confirmed that YARG induction in response to C. neoformans infection was indeed dependent on type 2 cytokine signaling using both IL-4Rα-and STAT6-deficient mice (Fig. 4e).
As CPL1 may have contributions to virulence in vivo beyond augmentation of type 2 inflammation, we tested whether the cpl1Δ mutant displayed phenotypes in mice lacking factors critical for type 2 responses. We infected wild type, Il4ra−/−, and Stat6−/− mice with either wild type or cpl1Δ C. neoformans and then measured pulmonary CFUs on day 10. Consistent with previous reports, we found that IL-4Rα-and STAT6-deficient mice showed lower pulmonary fungal burden than wild type mice (Fig. 4f). However, while cpl1Δ infections showed decreased CFUs relative to the control strain in wild type mice, there was no further decrease in IL-4Rα-and STAT6-deficient hosts (Fig. 4f). This result suggests that induction of type 2 inflammation is required for CPL1 to impact infectivity. We reasoned that simultaneous infection of mice with wild type C. neoformans might rescue cpl1Δ CFUs via the induction of type 2 immunity in trans. We performed mixed intranasal infections [WT vs. WT(KanR), cpl1Δ vs. cpl1Δ (KanR), and WT(KanR) vs. cpl1Δ] using congenic G418-resistant mixing partners and found that co-infection with wild type partially restored the cpl1Δ pulmonary CFUs (Extended Data Fig. 8e). While there are likely additional mechanisms by which CPL1 promotes C. neoformans pathogenesis, these data indicate that promotion of type 2 immunity is a critical function of this virulence factor.
Since BMDM polarization by CPL1 requires TLR4, we tested whether TLR4 contributed to type 2 inflammation in response to pulmonary infection. We found that Tlr4−/− mice infected with C. neoformans displayed reduced arginase-1 expression in IMs as well as reduced pulmonary fungal burden and eosinophilia (Fig. 4g and Extended Data Fig. 9a and 9b). To investigate the role of CPL1 in animals but in the absence of pathogen-host dynamics, we tested whether rCPL1 protein alone could drive type 2 inflammation. We challenged wild type and Tlr4−/− mice intranasally with a series of CPL1 doses and then assessed pulmonary eosinophilia on day 21. We found that intranasal treatment of mice with rCPL1 (but not bovine serum albumin) was sufficient to induce pulmonary eosinophilia; this induction was fully dependent on TLR4 (Extended Data Fig. 9c).
Alternatively activated macrophages can be exploited as a replicative niche by pathogens due to their reduced ability to kill microbes41. To begin to test this hypothesis we performed flow cytometric analysis of pulmonary tissue from YARG mice infected intranasally with mCherry-expressing C. neoformans. We observed high mCherry+ signal associated with interstitial macrophages compared to alveolar macrophages (Fig. 4h). Sub-gating interstitial macrophages into either YARG-or YARG+ populations further showed a striking enrichment of mCherry+ C. neoformans in the YARG+ cells (Fig. 4i). These data demonstrate a selective association of C. neoformans with arginase-expressing IMs in vivo.
Discussion
We identified CPL1 as a secreted effector of C. neoformans that promotes fungal virulence by enhancing type 2 inflammation. Our work supports a model whereby CPL1 activates TLR4 signaling to drive phosphorylation of STAT3 in macrophages, which both promotes the initial induction of arginase-1 but also amplifies macrophage sensitivity to IL-4 signaling (Extended Data Fig. 9d). In vivo, CPL1 is required for virulence and, strikingly, promotes the induction of arginase-1 by interstitial macrophages. C. neoformans also physically associates with polarized IMs during infection, consistent with direct macrophage reprogramming in vivo by CPL1. Future detailed biochemical and structural studies will be required understand the precise mechanism of TLR4 activation by CPL1, which could involve modulation of canonical as well as noncanonical co-receptors and/or signaling mechanisms.
Methods
Mice
Wild type C57BL/6J mice were purchased from Jackson Labs and bred in house. MyD88−/−, Tlr4−/− and Stat3flox/flox mice were purchased from Jackson Labs. Arginase-1-YFP (YARG) reporter mice, IL-4ra−/− and Stat6−/− mice were a gift from Richard Locksley (UCSF). BoyJ (B6.SJL-PtprcaPepcb/BoyJ) mice were a gift from Jason Cyster (UCSF). Animals were housed in a specific-pathogen free environment in the Laboratory Animal Research Center at UCSF. All experiments conformed to ethics and guidelines approved by the UCSF Institutional and Animal Care and Use Committee.
Yeast manipulations
Yeast genetic manipulations were performed as previously described47. Insertion of genes was obtained through homologous recombination by transforming 10ug of digested plasmid.
Intranasal infections
Individual colonies from Cryptococcus plates were cultured overnight in 10mL of YPAD (30C). The next day, yeast were counted on a hemocytometer and diluted to 1x10⁶ cells per mL in saline. Mice were anesthetized with intraperitoneal ketamine/dexmedetomidine and then hung by their front teeth using surgical thread. 50uL of yeast (5x10⁴ CFU) were then pipetted onto the nasal flares and taken up by aspiration. For survival curves, the mice were weighed and assessed for clinical endpoints every 2 days for the first week post-infection, and then every day starting after week 1.
Intranasal injection of CPL1
Mice were anesthetized with intraperitoneal ketamine/dexmedetomidine and then hung by their front teeth using surgical thread for intranasal injection. Mice were injected with 100ng of either bovine serum albumin (Sigma) or recombinant CPL1 on day 0, 1, and 2 and then injected with 25ng of either protein on days 14, 15, 17, 18, 19 and then mice were euthanized for analysis on day 21.
Generation of bone marrow-derived macrophages
On day 0, mice were euthanized and femurs/tibias were harvested into RPMI (2% FCS). The ends of the bones were clipped with scissors, and then bone marrow was flushed using a 251/2 gauge syringe. The bone marrow was then suspended in complete DMEM (10% FCS, HEPES, glutamine, P/S) and 10% m-CSF media derived from 3T3-mCSF cells. Bone marrow suspensions were plated in non-tissue culture-treated 10cm petri dishes. On day 4, 3mL of additional 10% m-CSF media was added to each plate. The adherent macrophages were then harvested on day 6 and either plated out for experiments or frozen.
Generation of human monocyte-derived macrophages
On day 0, monocytes were enriched from donated human PBMCs through successive Ficoll (Sigma Aldrich) and Percoll (GE Healthcare) gradients. Monocytes were then allowed to adhere to non-tissue culture-treated bacterial petri dishes for 1hr at 37°C. Cells were then cultured for 7 days in IMDM + 10% AB human serum (Life Technologies). On Day 7, cells were lifted from the plates using 0.05% Trypsin-EDTA, and seeded onto 24-well TC-treated plates at 500,000 cells/well. Human monocyte-derived macrophages were then stimulated for 24hrs with recombinant human IL-4 (Peprotech) and the indicated fungal strains.
Retroviral transduction of BMDMs
On day 0, bone marrow was harvested and cultured in 10% m-CSF media as above and murine retroviral MSCV plasmid encoding CPL1 or iCre was transfected into platE cells using Lipofectamine 2000 (Thermo Fisher Scientific). On day 2, viral supernatants were harvested and filtered through a 0.45micron syringe filter. Non-adherent bone marrow cells were harvested and spun down in 6-well plates. The supernatant was aspirated, and 2mL of retrovirus was added to each well along with 10ug/ml polybrene (Sigma). The plates were then spun for 2hrs at room temperature at 2400rpm with no brake. After spinning, the retroviral supernatants were aspirated and replaced with 10% m-CSF media. On day 3, another round of identical spinfection was performed. Cells were then harvested for experiments on day 6.
ELISA
High-binding half area 96-well plates (Corning) were coated with 25uL of unconjugated anti-TNF antibody (Invitrogen; clone 1F3F3D4) at a concentration of 2ug/ml in PBS and incubated overnight at 40C. Plates were then washed 6 times with PBST (1X PBS + 0.05% Tween-20) and blocked for 1hr at room temperature with 120uL of 1X PBS + 5% FCS. Next, the blocking solution was removed and 25uL of indicated macrophages supernatants plus a standard curve using recombinant murine TNF (Peprotech) in 1xPBS + 5% FCS were added to the plates and incubated for an hour at room temperature. Plates were washed as above, and then 25uL of biotinylated anti-TNF (Invitrogen; clone MP6-XT3) was added a concentration of 1ug/ml in PBS + 5% FCS for 1hr at room temperature. Plates were then washed, and 25uL of streptavidin-HRP (Jackson ImmunoResearch) was added at a concentration of 2.5ug/ml in 1xPBS + 5% FCS for 1hr at room temperature. Plates were then washed, assay was developed using a 50uL of Substrate reagent (R&D Systems), and absorbance was read at 450nm.
Flow cytometry
Cells were stained with Abs to CD11b (M1/70), SiglecF (S17007L), Arginase-1 (A1exF5), iNOS (CXNFT), Mertk (DS5MMER), CD64 (X54-5/7.1), CD90.2 (53-2.1), CD45.2 (104), CD45.1 (A20), B220 (RA3-6B2), CD38 (NIMR5), IgD (11-26c.2a), CD4 (GK1.5), CD95 (Jo2), GL7 (GL7), IgG1 (RMG1-1), IgA (C10-1), IgM (11/41), IL-4 (11B11), IL-17A (TC11-18H10.1), IFNg (XMG1.2), TCRβ (H57-597), CD44 (IM7), TLR4 (SA15-21), IL-4Rα (I015F8), GXM (18B7) (from Biolegend, BD Biosciences or eBiosciences). All antibodies were used at a 1:200 dilution, except for anti-GL7 (1:400) and anti-CD11b (1:400). To detect intracellular arginase-1 or iNOS, cells were treated with BD Cytofix Buffer and Perm/Wash reagent (BD Biosciences) and then stained with anti-arginase-1 or anti-iNOS in Perm/Wash buffer. For flow cytometry on lung samples, mice were infected or challenged as indicated and then lungs were dissected and minced using scissors. The minced lung tissue was then incubated for 30min at 37C in digestion media (RPMI, 2% FCS, 0.125mg/ml Collegenase II (Thermo Fisher Scientific), 0.2mg/ml DNaseI (Millipore)). The digested lung tissue was then mashed through a 100micron strainer (Fisher Scientific) and washed with RPMI + 2% FCS + 5mM EDTA. Red blood cells were then lysed for 5min on ice using RBC Lysis Buffer (Biolegend). Cells were resuspended in FACS buffer (1XPBS, 2% FCS, 1mM EDTA) for staining. For analysis of mediastinal lymph nodes, the LNs were dissected from mice and then mashed through a 100micron strainer.
Expression of recombinant protein in Pichia pastoris
CPL1 was PCR amplified from Kn99a genomic DNA with a GSGS-linker-6xHis tag encoded in the 3’ primer. This PCR product was then cloned into SnaBI-digested pPIC9K (Thermo Fisher Scientific) using a Gibson assembly kit (New England Biosciences). The assembled vector was transformed in to DH5α E. coli and plated onto LB + ampicillin plates. Colonies were screened for the correct inserts by sanger sequencing (Quintara Bio). For P. pastoris transformation, a 50mL culture of GS115 was inoculated overnight at 30oC at 200rpm. The next morning, the cultures were diluted into 500mL YPAD and incubated (300C, 200rpm) until the culture reached OD600=2.0. Then cultures were then spun down and washed twice with ice cold 1M sorbitol. The cells were then resuspended in 2mL of ice cold sorbitol and then electroporated with 5ug of SacI-digested pPIC9K-CPL1-6xHis. Electroporated yeast were then selected for successful integrations on HIS-plates.
Purification of recombinant CPL1
Single colonies were inoculated in 100mL of BMGY (1% yeast extract, 2% peptone, 100mM potassium phosphate pH 6.0, 1.34% YNB, 4x10⁻⁵% biotin, 1% glycerol) overnight at 30C, 200rpm. The next day, yeast were pelleted, washed with ddH2O and then resuspended to OD600=1.0 in BMMY (1% yeast extract, 2% peptone, 100mM potassium phosphate pH 6.0, 1.34% YNB, 4x10⁻⁵% biotin, 1% methanol) for induction. Supernatants from BMMY induction cultures (24hrs at 300C, 300rpm) were concentrated using 10kD-cutoff Centricon Plus −70 concentrators (EMD Millipore). The concentrated supernatants were then dialyzed for 24hrs (10mM Phosphate buffer pH=7.4, 500mM NaCl, 10% glycerol) using 30mL 10kD pore Slide-a-Lyzer Dialysis cassettes (Thermo Fisher Scientific). The dialyzed supernatants were then run over a 5mL HisTrap HP column using an ĀKTA pure fast protein chromatography system (Cytiva). The column was equilibrated with 25mL of equilibration buffer (10mM Phosphate buffer pH=7.4, 500mM NaCl, 10% glycerol, 20mM imidazole) and then the dialyzed supernatants were injected onto the column. The column was then washed with 25mL of equilibration buffer. The bound proteins were then eluted in 15mL of elution buffer (10mM Phosphate buffer pH=7.4, 500mM NaCl, 10% glycerol, 500mM imidazole). The eluted proteins were concentrated using 10kD cutoff Amicon Ultra-15 Centrifugal Filter units (EMD Millipore) and then further purified on a HiLoad 16/600 Superose 6pg preparative size exclusion chromatography column (SEC) (GE Healthcare). The SEC column was first equilibrated with 128mL of equilibration buffer (10mM Phosphate buffer pH=7.4, 125mM NaCl, 10% glycerol) and then the loaded 1mL sample was injected, and fractions were collected over a 128mL elution volume. The eluted fractions were run on a 4-12% SDS-PAGE (Fisher Scientific) gel and analyzed by silver stain and western blot for purity. Fractions containing pure CPL1-6xHis were then concentrated to 2mg/ml using 10kD cutoff Amicon Ultra-4 Centrifugal Filter units (EMD Millipore). Potential endotoxin was removed from the samples using a High Capacity Endotoxin Removal Resin (Pierce) and endotoxin levels were confirmed to be below 0.05EU/mL using an LAL Chromogenic Endotoxin Quantification Kit (Pierce).
RNA-seq
2x10⁶ BMDMs were seeded in 6-well plates and stimulated with the indicated conditions. RNA was then extracted from the macrophages using a RNeasy Midi Kit (Qiagen). Sequencing libraries were prepared using 500ng of purified RNA using a QuantSeq 3’end mRNA-Seq Library Prep Kit (Lexogen). Library quality and quantify was determined using a High Sensitivity DNA Bioanalyzer chip (Agilent). The RNA-seq libraries were then sequenced using 50bp single end reads on a HiSeq4000 (Illumina).
RNA-seq analysis
Read counts were determined using HTSeq by counting the number of reads aligned by STAR for each mouse transcript. We then used DEseq2 to determine differentially expressed genes between different treatment conditions.
Screening the Cryptococcus knockout collection
Individual Cryptococcus knockout strains were spotted onto YPAD+NAT omni-trays in a 96-well pattern (Thermo Fisher Scientific) from frozen −80C stocks. Each mutant was then inoculated into 100uL of YPAD in 96-well round bottom plates and incubated overnight at 30C on a shaker. The OD600 was then determined for each well using a plate reader, and yeast were diluted into complete DMEM at a concentration of 1x10⁷ cells/ml. 100ul of each mutant was then added to BMDMs (1x10⁵ cells) seeded in 96-well plates. Infections were left for 24hrs, and then the cells were surface stained for CD11b to distinguish macrophages from yeast, and then intracellular argainse-1 staining was performed as described above. The screen was performed over several rounds of experiments, with an average of 5 knockout plates screened per experiment. For each experiment, a 96-well plate of entirely wild type Cryptococcus was inoculated and added to macrophages. Z-scores for the mutants in each experiment were calculated using the mean and standard deviation for arginase-1 induction by the wild type plate.
Western blotting
BMDMs were stimulated with the indicated conditions and then supernatants were aspirated and cells were washed with ice cold 1XPBS. The cells were then placed on ice and lysed for 20min in RIPA buffer (50mM Tris-HCl pH=7.4, 150mM NaCl, 1% NP-40, 0.5% deoxycholate, 0.1% SDS) plus protease/phosphatase inhibitor cocktail (Thermo Scientific). The lysate was then transferred to 1.5mL Eppendorf tubes and centrifuged for 20min at 14,000rpm at 4C. Novex NuPAGE LDS samples buffer (Thermo Fisher Scientific) was then added and samples were run on 4-12% NuPAGE Bis-Tris protein gels (Thermo Fisher Scientific) at 190V. Gels were then transferred onto nitrocellulose membranes at 35V for 90min. Membranes were blocked for 1hr in 5%(w/v) milk in TBST. Primary antibodies were then added at 1:1000 in TBST + 5% mil overnight at 4C. Antibodies were used against Stat6 (D3H4), pStat6-Tyr641 (D8S9Y), Stat3 (79D7), pStat3-Tyr705 (D3A7) (all purchased from Cell Signaling Technologies). Membranes were then washing 3x5minutes using TBST and secondary anti-rabbit horseradish (Bio-Rad) peroxidase was added at 1:10,000 for 1hr at room temperature. Membranes were washed as above and then developed for 5min using a SuperSignal West Pico Plus Chemiluminescent Substrate kit (Fisher Scientific).
Phospho-Flow cytometry
BMDMs were seeded in 6-well plates (2x10⁶ cells/well) and stimulated with the indicated conditions. 16% PFA was added to each well dropwise to a final concentration of 1.5% PFA. Cells were then allowed to fix at room temperature for 10min. The cells were then placed on ice, supernatant aspirated, and washed twice with ice cold 1XPBS. Next, the PBS was aspirated and 1mL of ice cold methanol was added dropwise to each well. Cells were left overnight in a −80C freezer. Cells were then washed twice with FACS buffer, scraped off the plate, and transferred to round bottom 96-well plates. Next, the samples were blocked at 1hr at room temperature in blocking buffer (FACS buffer + Fc Block (1:100) + FCS (1:20). Cells were then washed with FACS buffer and stained with the indicated primary antibodies (1:100) at room temperature for 45min. Samples were then washing twice with FACS buffer, and stained for 1hr with anti-rabbit PE (1:400) at room temperature. Finally, cells were washed twice with FACS buffer and analyzed on a flow cytometer.
LDH release assay
1x10⁵ BMDMs were seeded in 96-well plates and then stimulated with the indicated conditions in DMEM without phenol red (Corning). Supernatants were then harvested and LDH release was determined using a LDH Cytotoxicity Assay kit (Fisher Scientific) in 96-well plates. The assay was then measured at 490nm absorbance. The percent LDH release was determined by comparing to positive control samples that were macrophage RIPA buffer lysates.
Total Nitric oxide assay
1x10⁵ BMDMs were seeded in 96-well plates and then stimulated with the indicated conditions. Supernatants were then assayed for nitric oxide in 96-well plates using a colorimetric Total Nitric Oxide Assay Kit (Thermo Fisher Scientific). Assays were read on a plate reader at an absorbance of 540nm.
India ink capsule staining
C. neoformans single colonies were picked from YPAD plates and grown overnight in YPAD at 30°C with shaking. The next day, cultures were diluted 1:100 in capsule induction media (10% Sabouraud, 50mM HEPES pH=7.9) and incubated overnight at 30°C with shaking. Yeast cells were then fixed with 2% paraformaldehyde for 15min at room temperature, and washed twice with 1XPBS. Cells were resuspended in 100uL of 1XPBS and then diluted 1:1 with India ink. Cells were then placed on slides with coverslips and imaged with a 40X objective lens using brightfield microscopy (Leica).
RT-qPCR
C. neoformans was cultured in the indicted media and temperatures until reaching OD600=1.0. Yeast were then pelleted, resuspended in 1mL Trizol (Thermo Fisher Scientific), and lysed using a bead beater (2 cycles x 90 seconds). 200uL of chloroform was then added and the suspension was vortexed until homogenous and centrifuged at 12,500xg at 4°C. The aqueous phase was then collected and RNA was further extracted using an RNA Extraction Kit (Zymo Research). Reverse transcription was then performed on 5ug of RNA using a SuperScript III™ Reverse Transcription Kit (Thermo Fisher Scientific). Quantitative PCR was then ran with PowerUP SYBR Green Master Mix (Life Technologies) to determine the expression of CPL1 (Fwd: 5’-CTCGCAGACTGGTTCAAGGT-3’; Rev: 5’-GCGCAATCTTGGCCAGAAC-3’) relative to ACT1 (Fwd: 5’-CCACCCACTGCCCAAGTAAA-3’; Rev: 5’-GTCGAGGGCGACCAACAATA-3’).
Extended Data
Extended Data Figure 1.
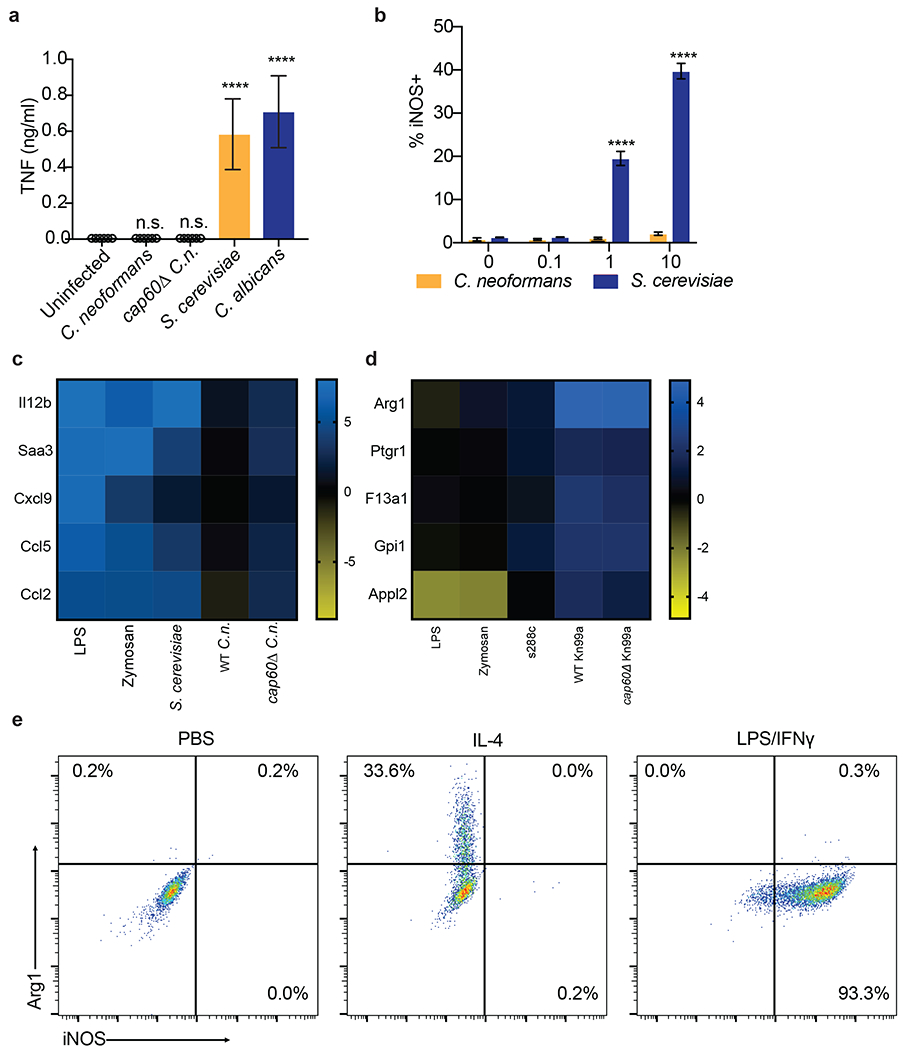
(a) TNF ELISA on supernatants from BMDMs infected for 24hrs with the indicated yeasts at MOI=10. n = six biologically independent samples. Significance determined by one-way ANOVA with Bonferroni test. (b) Intracellular FACS staining for iNOS after 24hrs of infection with either C. neoformans or S. cerevisiae at the indicated MOIs. n = three biologically independent samples. (c) RNA-seq heatmap depicting log2 fold changes of the indicated pro-inflammatory genes in BMDMs following 6hrs of stimulation. (d) RNA-seq heatmap depicting log2 fold changes of the indicated M2/tolerized genes in BMDMs following 6hrs of stimulation. (e) Representative FACS plots of Arg1 and iNOS expression in BMDMs following 24hrs of stimulation with PBS, IL-4 (40ng/ml), or LPS (100ng/ml) and IFNγ (50ng/ml). Data are presented as mean values +/− SD. ****p < 0.0001
Extended Data Figure 2.
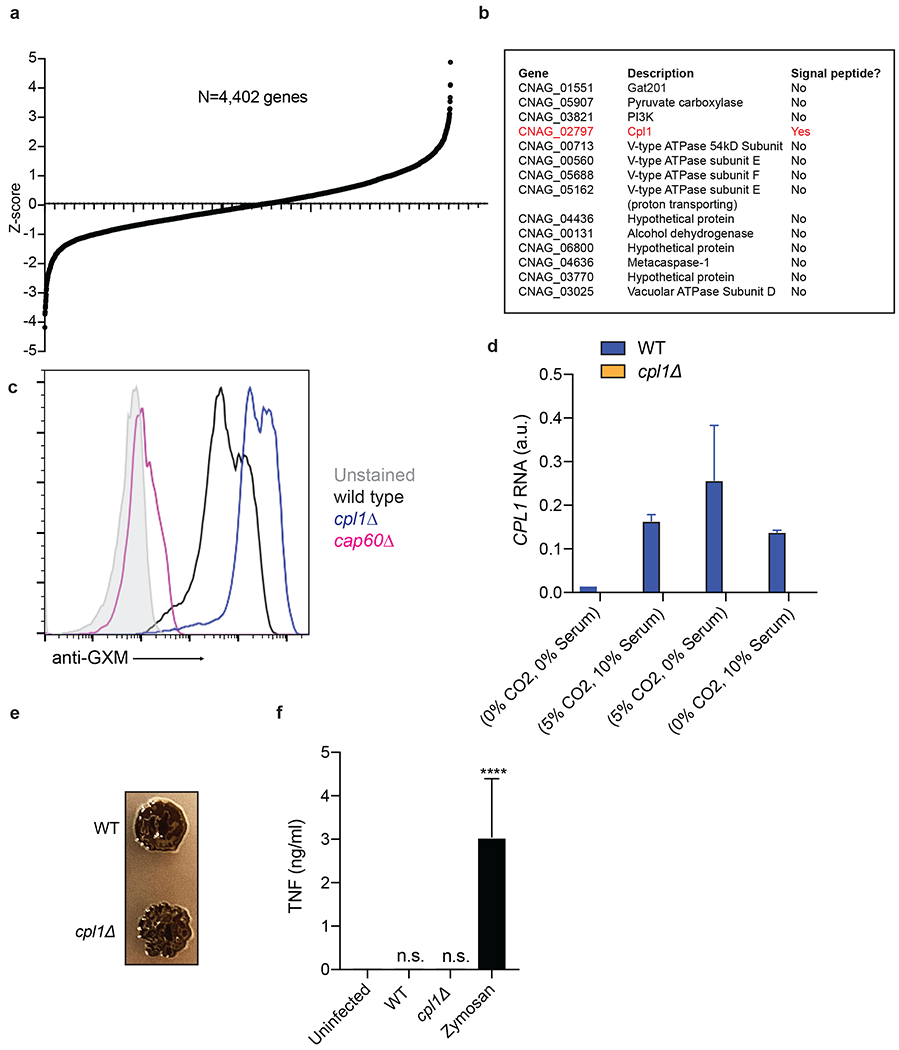
(a) Ranked Z-scores of hits from forward genetic screen for C. neoformans Arg1 induction. (b) List of validated screen hits and gene descriptions. (c) Representative FACS histograms of GXM staining on the indicated C. neoformans strains cultured overnight in 10% Sabouraud media. (d) RT-qPCR for CPL1 mRNA expression in cultures grown to OD600=1.0 in the indicated conditions (A.U. = arbitrary units relative to ACT1). n = three biologically independent samples. (e) Melanin production in WT or cpl1Δ strains grown at 30°C on L-DOPA plates. (f) TNF production (measured by ELISA) to the indicated stimulations. n = six biologically independent samples. Significance determined by one-way ANOVA with Bonferroni test. Data are presented as mean values +/− SD. ****p < 0.0001.
Extended Data Figure 3.
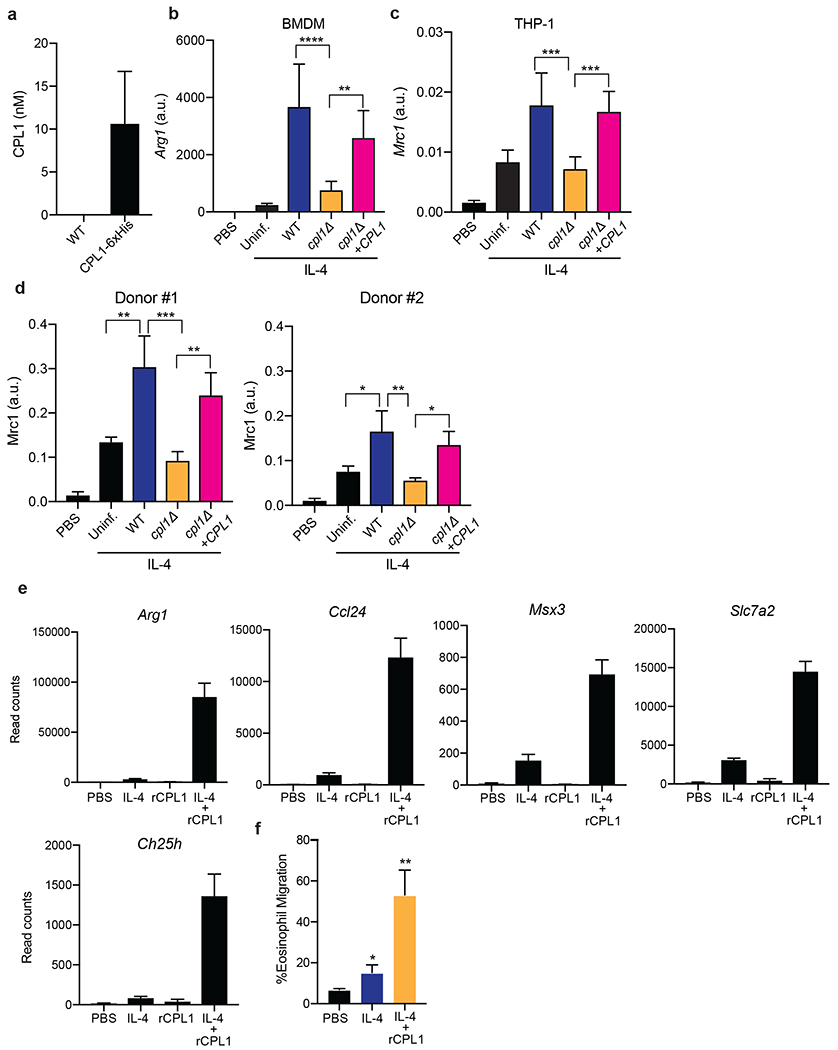
(a) Quantification by competitive ELISA of CPL1-6xHis in supernatants from the indicated strains grown in mammalian tissue culture conditions to OD=1.0. n = six biologically independent samples. (b) RT-qPCR for Arg1 mRNA in BMDMs stimulated with the indicated C. neoformans strains (OD=0.1) along with IL-4 (10ng/ml) for 24hrs. Expression normalized to Actb, a.u. = arbitrary units. n = three biologically independent samples. (c) RT-qPCR for Mrc1 mRNA in PMA-differentiated THP-1 cells stimulated with the indicated C. neoformans strains (OD=0.1) along with IL-4 (10ng/ml) for 24hrs. Expression normalized to Actb, a.u. = arbitrary units. n = six biologically independent samples (d) RT-qPCR for Mrc1 mRNA in primary human monocyte-derived macrophages stimulated for 24hrs with PBS or recombinant human IL-4 (10ng/ml) along with the indicated C. neoformans strains (MOI=0.1). Expression normalized to Actb, a.u. = arbitrary units. n = three biologically independent samples (e) RNA-seq read counts of the indicated genes in BMDMs stimulated for 24hrs with either PBS, IL-4 (10ng/ml), rCPL1 (111nM), or IL-4 + rCPL1. n = three biologically independent samples. (f) Transwell migration assay on splenic eosinophils towards supernatants from BMDMs stimulated as in (e). n = three biologically independent samples. Data are presented as mean values +/− SD.
Exended Data Figure 4.
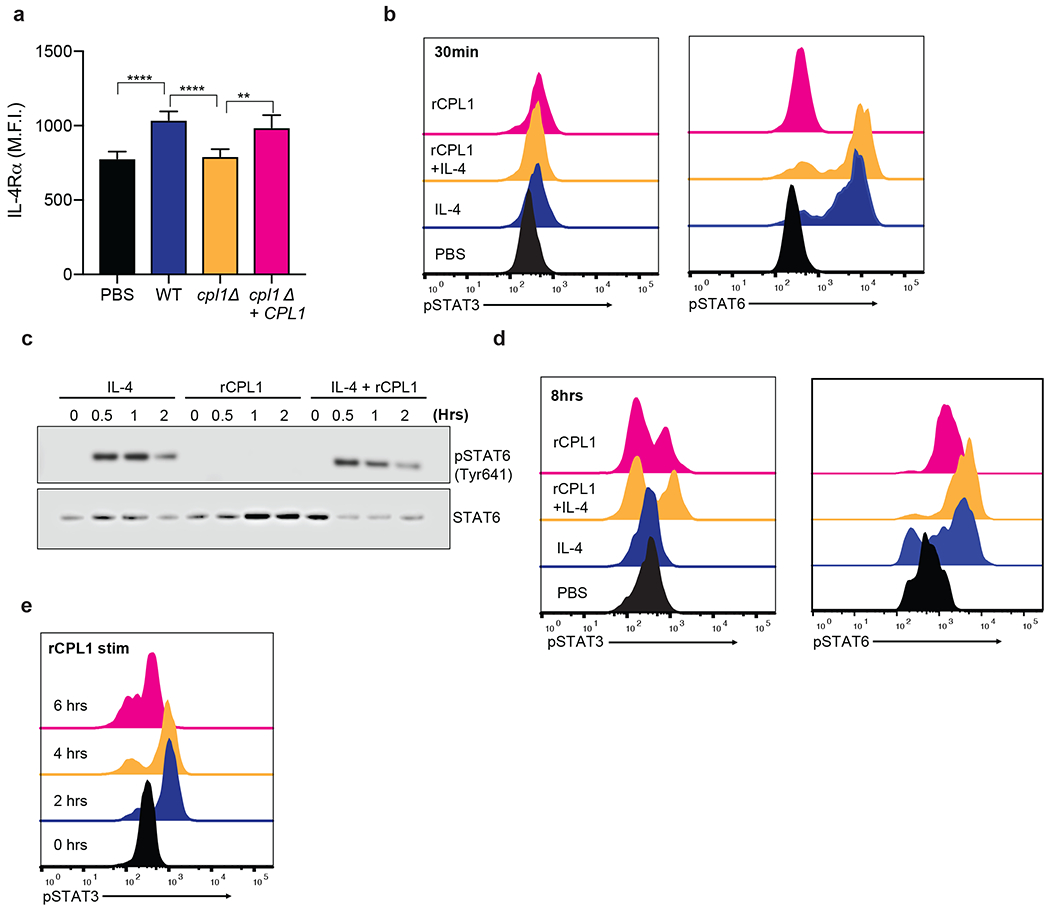
(a) Representative FACS staining of surface IL-4Rα levels on BMDMs stimulated for 24hrs with the indicated C. neoformans strains (MOI=10). n = six biologically independent samples (b) Phospho-FACS for pSTAT3 (left) and pSTAT6(right) after 30min of stimulation with PBS, IL-4 (10ng/ml), rCPL1 (111nM), or IL-4 + rCPL1. (c) Western blot for pSTAT6 or total STAT6 on BMDMs stimulated for the indicated times with either IL-4 (10ng/ml) alone, rCPL1 (111nM) alone, or IL-4 + rCPL1. Data are representative of three independent experiments. (d) Phospho-FACS for pSTAT3 (left) or pSTAT6 (right) in BMDMs after 8hrs of stimulation with PBS, IL-4 (10ng/ml), rCPL1 (37nM), or rCPL1+IL-4. (e) Phospho-FACS for pSTAT3 in BMDMs stimulated with 111nM rCPL1 for the indicated time points. Data are presented as mean values +/− SD.
Extended Data Figure 5.
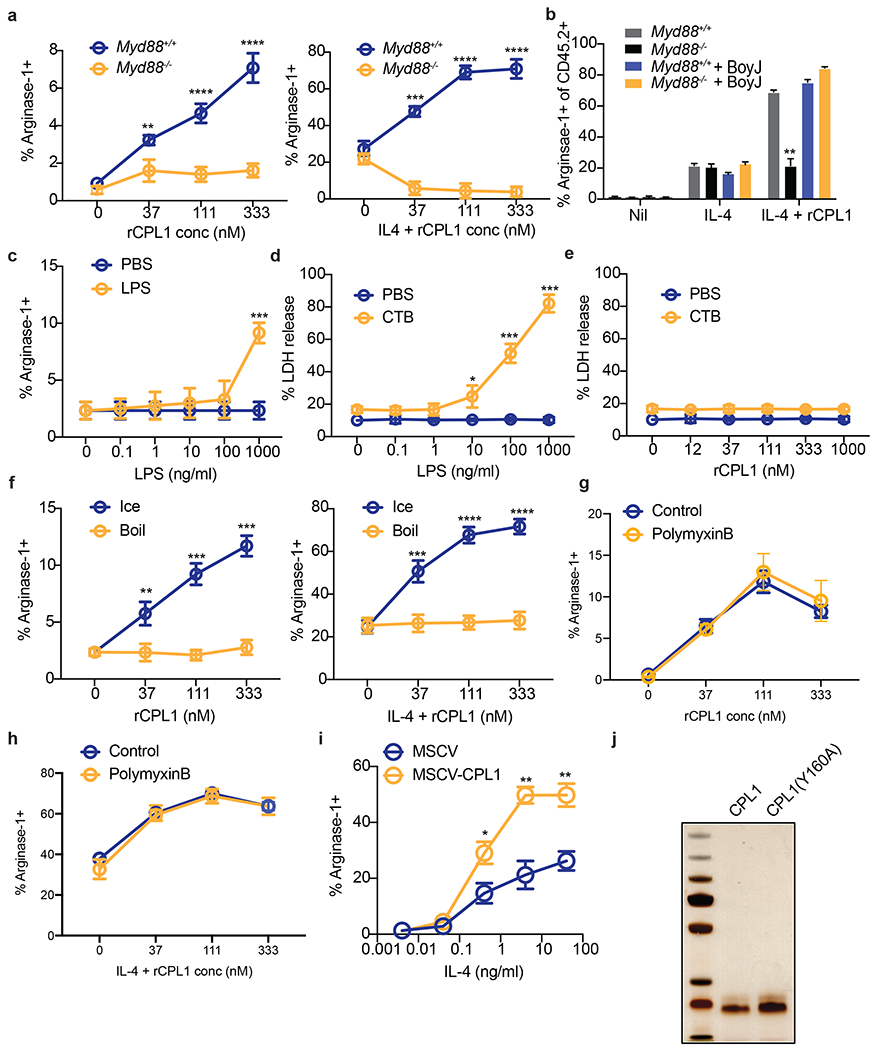
(a) Arginase-1 FACS in Myd88+/+ or Myd88−/− BMDMs stimulated for 24hrs with the indicated concentrations of rCPL1 alone (left) or in combination with IL-4 (10ng/ml). n = three biologically independent samples. (b) Arginase-1 FACS gated on CD45.2+ BMDMs from the indicated genotypes co-cultured with a 50:50 mix of CD45.1 BoyJ BMDMs and stimulated for 24hrs with IL-4 (10ng/ml) or IL-4 + rCPL1 (111nM). n = three biologically independent samples. (c) Arginase-1 FACS on BMDMs stimulated for 24hrs with the indicated concentrations of LPS. (d) Measurement of pyroptosis by LDH release assay on BMDMs stimulated with the indicated concentrations of LPS alone or with 10ug/ml cholera toxin B (CTB). n = three biologically independent samples. (e) Measurement of pyroptosis by LDH release assay on BMDMs stimulated with the indicated concentrations of rCPL1 alone or with 10ug/ml CTB. n = three biologically independent samples. (f) Arginase-1 FACS on BMDMs stimulated with rCPL1 that was either kept on ice or boiled at 100°C for 15min. Cells were stimulated with either rCPL1 alone (left) or in combination with IL-4 (right). n = three biologically independent samples. (g)(h) Arginase-1 FACS in in BMDMs stimulated with the indicated concentrations of rCPL1 alone (g) or in combination with IL-4 (10ng/ml) (h) that were either treated with control or polymyxinB. n = three biologically independent samples. (i) Arginase-1 FACS on BMDMs transduced with MSCV-empty or MSCV-CPL1 retrovirus and stimulated for 24hrs with the indicated concentrations of IL-4. n = three biologically independent samples. (j) Silver stain on SDS-PAGE gel of rCPL1-6xHis or rCPL1(Y160A)-6xHis purified from P. pastoris. Image is representative of three independent experiments. Data are presented as mean values +/− SD. *p < 0.05; **p < 0.01; ***p < 0.001; ****p < 0.0001 by one-way ANOVA with Bonferroni test.
Extended Data Figure 6.
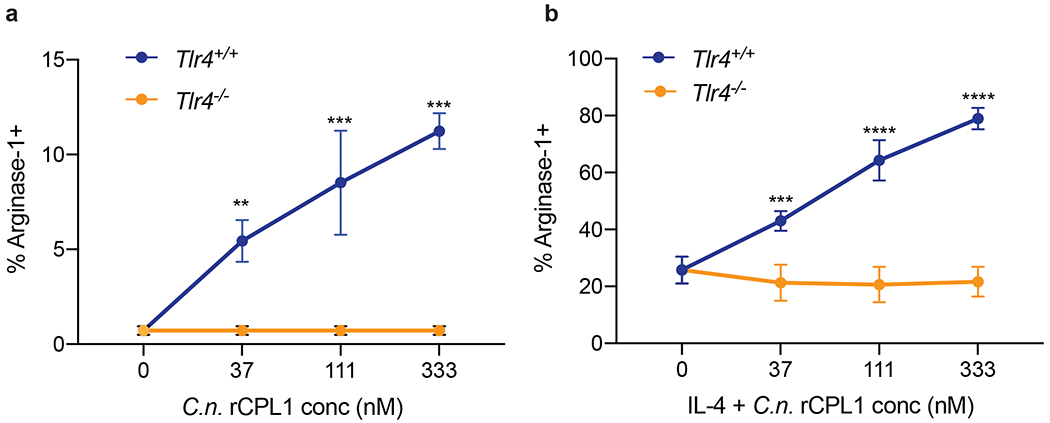
(a) Arginase-1 FACS in Tlr4+/+ or Tlr4−/− BMDMs stimulated for 24hrs with the indicated concentrations of rCPL1-6xHis purified from C.n. supernatants alone or in combination with IL-4 (10ng/ml) (b). n = three biologically independent samples. Data are presented as mean values +/− SD. *p < 0.05; **p < 0.01; ***p < 0.001; ****p < 0.0001 by one-way ANOVA with Bonferroni test.
Extended Data Figure 7.
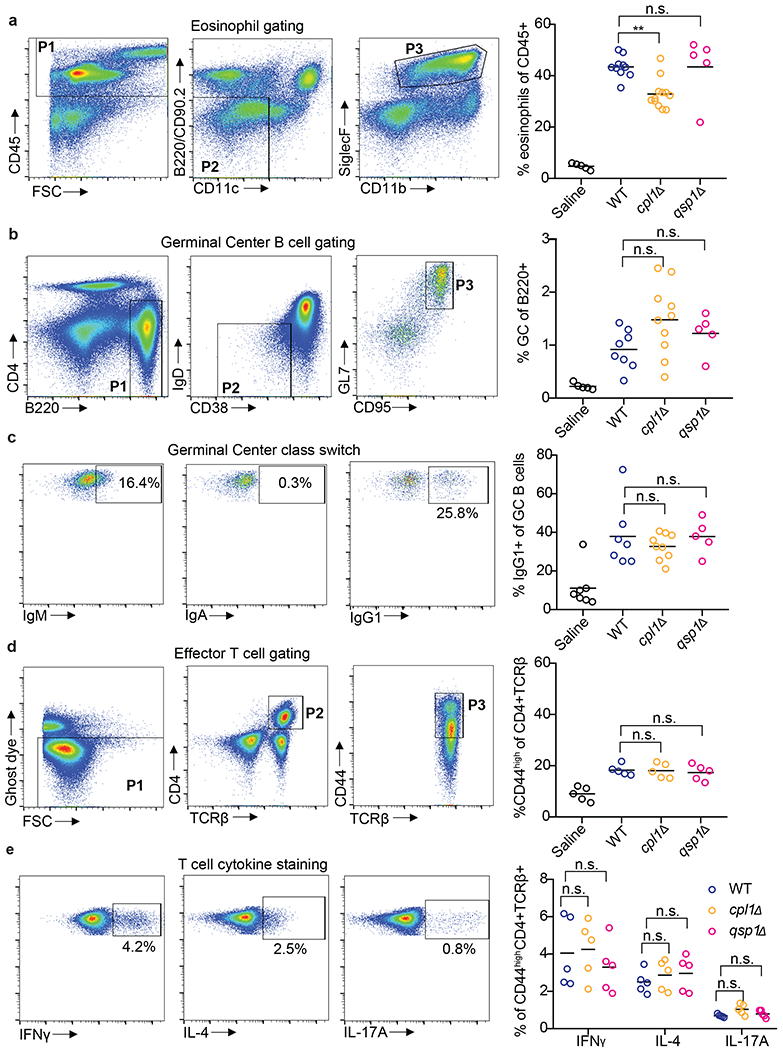
(a) Representative FACS gating and quantification of lung eosinophils after 10 days of intranasal infection with the indicated C.n. strains. (b) Representative FACS gating and quantification of mediastinal lymph node GC B cells. (c) Representative FACS gating and quantification of GC B cell antibody isotype. (d) Representative FACS gating and quantification of effector CD4+ T cells. (e) Representative FACS gating and quantification of cytokine production from effector CD4+ T cells after 4hrs of stimulation with PMA, Ionomycin, and GolgiSTOP. **p < 0.01 by one-way ANOVA with Bonferroni test.
Extended Data Figure 8.
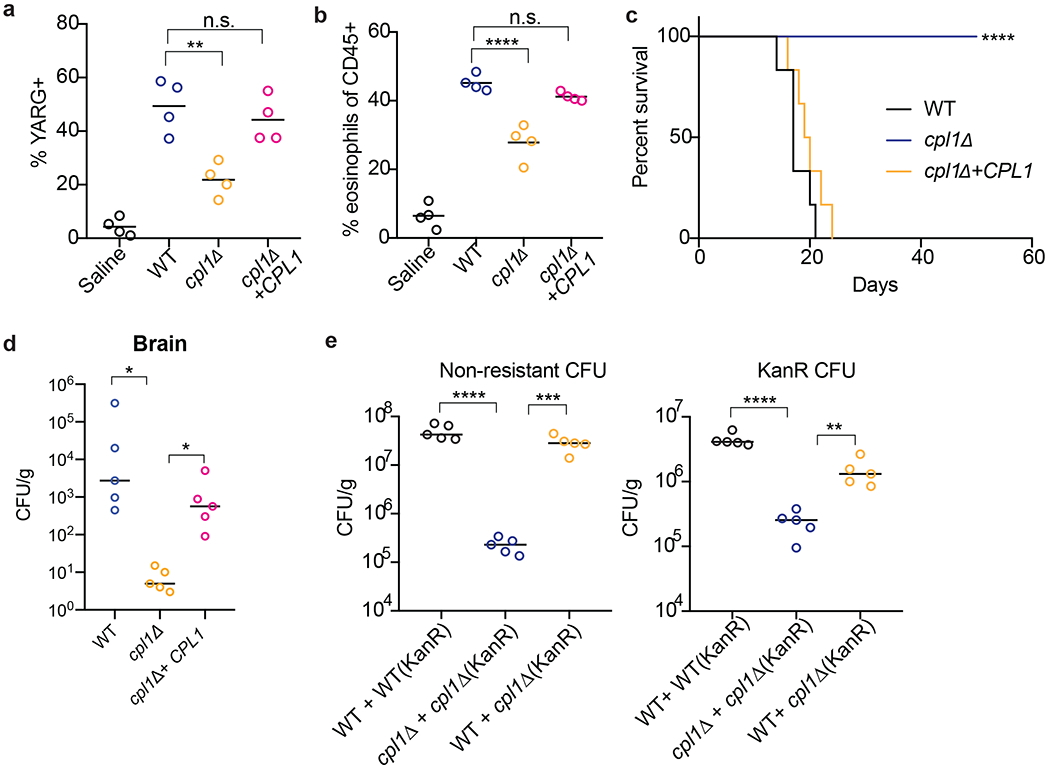
(a) Quantification of YARG expression by FACS in lung interstitial macrophages in mice infected for 10 days with 5x10⁴ CFU of the indicated strains. (b) Quantification of eosinophils in mice infected for 10 days with 5x10⁴ CFU of the indicated strains. (c) Kaplan-Meier survival curve analysis of mice infected with WT, cpl1Δ, or cpl1Δ+CPL1 C.n. (N=6 mice per group); ****p < 0.0001 by Mantel-Cox test. (d) Brain CFUs from mice infected with WT, cpl1Δ, or cpl1Δ+CPL1 C.n (5x10⁴ CFU) for 14 days. (e) Lung CFUs on G418-non-resistant (left) or -resistant (right) colonies from mice infected for 10 days with a 50:50 mix of the indicated strains.
Extended Data Figure 9.
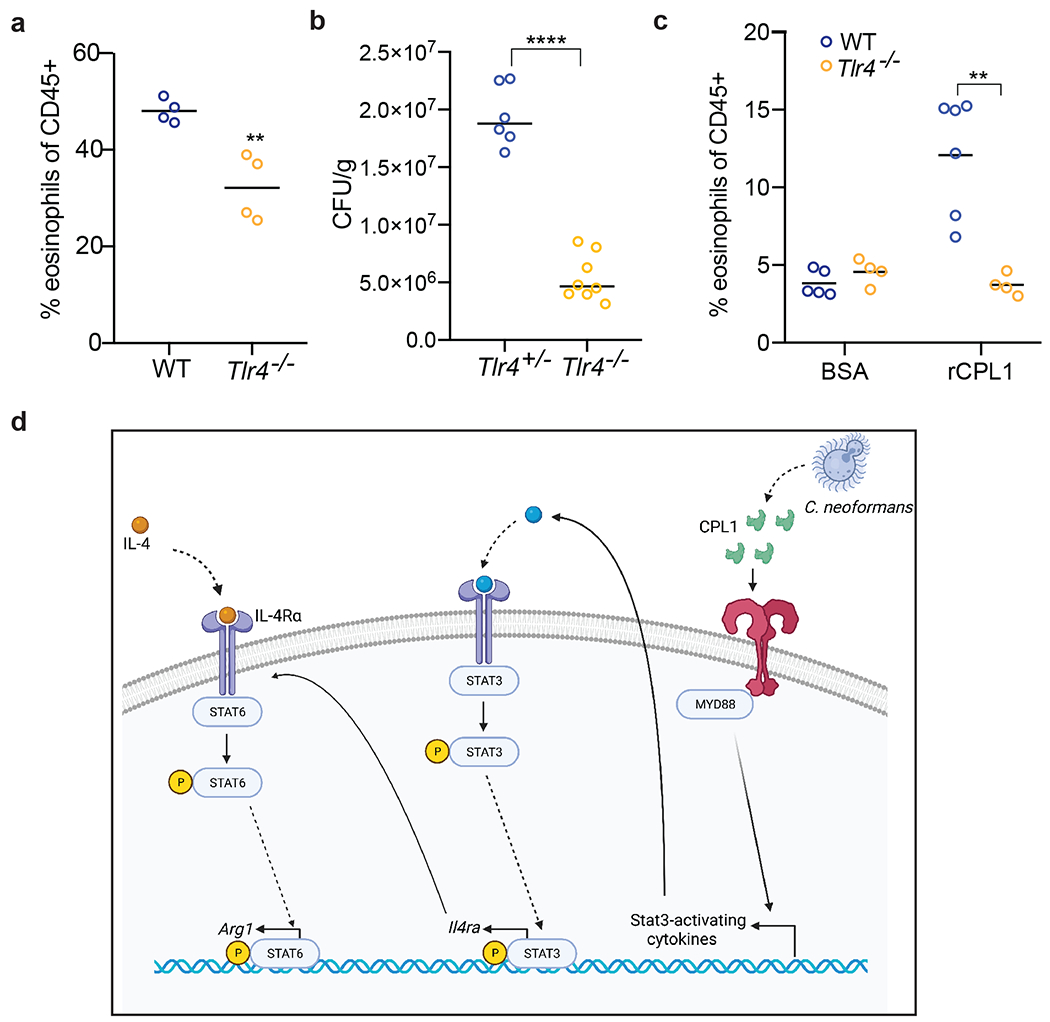
(a) Quantification of lung eosinophils in WT or Tlr4−/− mice infected for 10 days with 5x10⁴ CFU C. neoformans. (b) Lung CFUs from Tlr4+/− or Tlr4−/− mice infected with wild type C.n. (5x10⁴ CFU) for 10 days (c) FACS quantification of lung eosinophils in WT (N=6 mice) or Tlr4−/− (N=4 mice) mice sensitized intranasally with rCPL1. (d) Model of how secreted CPL1 modulates the macrophage inflammatory state (created using Biorender.com). p < 0.05; **p < 0.01; ***p < 0.001; ****p < 0.0001 by one-way ANOVA with Bonferroni test.
Acknowledgements
We thank Prof. Gregory Barton for provision of Tlr2−/−, Tlr4−/−, and Tlr2−/−Tlr4−/− knockout mice, and Prof. Roberto Ricardo-Gonzalez for provision of Il4ra−/− and Stat6−/− mice. We thank Prof. Seemay Chou for advice on protein purification. We thank Prof. Jason Cyster and Prof. Emily Goldberg for critically reading the manuscript, and we thank them as well as Drs. Sandra Catania and Michael Boucher for discussions and advice.
Funding
Chan-Zuckerberg Biohub
National Institutes of Health grant
Jane Coffin Childs Memorial Fund for Medical Research Fellowship
Beckman Foundation
Footnotes
Competing Interests
The authors declare no competing interests.
Data Availability
The primary read files as well as expression count files for RNA-seq data in this paper are available to download from GEO (accession number GSE203483). Source data are provided with this paper.
References
- 1.Armstrong-James D, Meintjes G & Brown GD A neglected epidemic: fungal infections in HIV/AIDS. Trends Microbiol. 22, 120–127 (2014). [DOI] [PubMed] [Google Scholar]
- 2.Brown GD et al. Hidden killers: human fungal infections. Sci Transl Med 4, 165rv13–165rv13 (2012). [DOI] [PubMed] [Google Scholar]
- 3.Zhao Y, Lin J, Fan Y & Lin X Life Cycle of Cryptococcus neoformans. Annu Rev Microbiol 73, 17–42 (2019). [DOI] [PubMed] [Google Scholar]
- 4.Müller U et al. Abrogation of IL-4 receptor-α-dependent alternatively activated macrophages is sufficient to confer resistance against pulmonary cryptococcosis despite an ongoing T(h)2 response. Int Immunol 25, 459–470 (2013). [DOI] [PubMed] [Google Scholar]
- 5.Mueller U et al. IL-13 induces disease-promoting type 2 cytokines, alternatively activated macrophages and allergic inflammation during pulmonary infection of mice with Cryptococcus neoformans. J Immunol 179, 5367–5377 (2007). [DOI] [PubMed] [Google Scholar]
- 6.Wiesner DL et al. Chitin recognition via chitotriosidase promotes pathologic type-2 helper T cell responses to cryptococcal infection. PLOS Pathogens 11, e1004701 (2015). [DOI] [PMC free article] [PubMed] [Google Scholar]
- 7.Schulze B et al. CD4(+) FoxP3(+) regulatory T cells suppress fatal T helper 2 cell immunity during pulmonary fungal infection. Eur J Immunol 44, 3596–3604 (2014). [DOI] [PubMed] [Google Scholar]
- 8.Stenzel W et al. IL-4/IL-13-dependent alternative activation of macrophages but not microglial cells is associated with uncontrolled cerebral cryptococcosis. Am J Pathol 174, 486–496 (2009). [DOI] [PMC free article] [PubMed] [Google Scholar]
- 9.Trompette A et al. Allergenicity resulting from functional mimicry of a Toll-like receptor complex protein. Nature 457, 585–588 (2009). [DOI] [PMC free article] [PubMed] [Google Scholar]
- 10.Hammad H et al. House dust mite allergen induces asthma via Toll-like receptor 4 triggering of airway structural cells. Nat Med 15, 410–416 (2009). [DOI] [PMC free article] [PubMed] [Google Scholar]
- 11.Eisenbarth SC et al. Lipopolysaccharide-enhanced, toll-like receptor 4-dependent T helper cell type 2 responses to inhaled antigen. J. Exp. Med 196, 1645–1651 (2002). [DOI] [PMC free article] [PubMed] [Google Scholar]
- 12.Millien VO et al. Cleavage of fibrinogen by proteinases elicits allergic responses through Toll-like receptor 4. Science 341, 792–796 (2013). [DOI] [PMC free article] [PubMed] [Google Scholar]
- 13.Ademe M & Girma F Candida auris: From Multidrug Resistance to Pan-Resistant Strains. Infect Drug Resist 13, 1287–1294 (2020). [DOI] [PMC free article] [PubMed] [Google Scholar]
- 14.Wall G & Lopez-Ribot JL Current Antimycotics, New Prospects, and Future Approaches to Antifungal Therapy. Antibiotics (Basel) 9, 445 (2020). [DOI] [PMC free article] [PubMed] [Google Scholar]
- 15.Selin C, de Kievit TR, Belmonte MF & Fernando WG D. Elucidating the Role of Effectors in Plant-Fungal Interactions: Progress and Challenges. Front Microbiol 7, (2016). [DOI] [PMC free article] [PubMed] [Google Scholar]
- 16.Rajasingham R et al. Global burden of disease of HIV-associated cryptococcal meningitis: an updated analysis. Lancet Infect Dis 17, 873–881 (2017). [DOI] [PMC free article] [PubMed] [Google Scholar]
- 17.Mueller U et al. Lack of IL-4 receptor expression on T helper cells reduces T helper 2 cell polyfunctionality and confers resistance in allergic bronchopulmonary mycosis. Mucosal Immunol 5, 299–310 (2012). [DOI] [PubMed] [Google Scholar]
- 18.Kindermann M et al. Group 2 Innate Lymphoid Cells (ILC2) Suppress Beneficial Type 1 Immune Responses During Pulmonary Cryptococcosis. Front. Immunol. 0, (2020). [DOI] [PMC free article] [PubMed] [Google Scholar]
- 19.May RC, Stone NRH, Wiesner DL, Bicanic T & Nielsen K Cryptococcus: from environmental saprophyte to global pathogen. Nat Rev Microbiol 14, 106–117 (2016). [DOI] [PMC free article] [PubMed] [Google Scholar]
- 20.Vecchiarelli A Immunoregulation by capsular components of Cryptococcus neoformans. Med Mycol 38, 407–417 (2000). [DOI] [PubMed] [Google Scholar]
- 21.Liu OW et al. Systematic genetic analysis of virulence in the human fungal pathogen Cryptococcus neoformans. Cell 135, 174–188 (2008). [DOI] [PMC free article] [PubMed] [Google Scholar]
- 22.Homer CM et al. Intracellular Action of a Secreted Peptide Required for Fungal Virulence. Cell Host Microbe 19, 849–864 (2016). [DOI] [PMC free article] [PubMed] [Google Scholar]
- 23.Stergiopoulos I & de Wit PJGM Fungal effector proteins. Annu Rev Phytopathol 47, 233–263 (2009). [DOI] [PubMed] [Google Scholar]
- 24.Arras SDM, Chitty JL, Blake KL, Schulz BL & Fraser JA A Genomic Safe Haven for Mutant Complementation in Cryptococcus neoformans. PLoS One 10, (2015). [DOI] [PMC free article] [PubMed] [Google Scholar]
- 25.Brown JCS et al. Unraveling the Biology of a Fungal Meningitis Pathogen Using Chemical Genetics. Cell 159, 1168–1187 (2014). [DOI] [PMC free article] [PubMed] [Google Scholar]
- 26.Kumar P et al. Pbx proteins in Cryptococcus neoformans cell wall remodeling and capsule assembly. Eukaryot Cell 13, 560–571 (2014). [DOI] [PMC free article] [PubMed] [Google Scholar]
- 27.Kawakami K, Zhang T, Qureshi MH & Saito A Cryptococcus neoformans inhibits nitric oxide production by murine peritoneal macrophages stimulated with interferon-gamma and lipopolysaccharide. Cellular Immunology 180, 47–54 (1997). [DOI] [PubMed] [Google Scholar]
- 28.Gibbs KD et al. The Salmonella Secreted Effector SarA/SteE Mimics Cytokine Receptor Signaling to Activate STAT3. Cell Host Microbe 27, 129–139.e4 (2020). [DOI] [PMC free article] [PubMed] [Google Scholar]
- 29.Panagi I et al. Salmonella Effector SteE Converts the Mammalian Serine/Threonine Kinase GSK3 into a Tyrosine Kinase to Direct Macrophage Polarization. Cell Host Microbe 27, 41–53.e6 (2020). [DOI] [PMC free article] [PubMed] [Google Scholar]
- 30.Kasmi El, K. C. et al. Toll-like receptor-induced arginase 1 in macrophages thwarts effective immunity against intracellular pathogens. Nat. Immunol. 9, 1399–1406 (2008). [DOI] [PMC free article] [PubMed] [Google Scholar]
- 31.Deguine J & Barton GM MyD88: a central player in innate immune signaling. F1000Prime Rep 6, 97 (2014). [DOI] [PMC free article] [PubMed] [Google Scholar]
- 32.Lind NA, Rael VE, Pestal K, Liu B & Barton GM Regulation of the nucleic acid-sensing Toll-like receptors. Nat. Rev. Immunol 1–12 (2021). doi: 10.1038/s41577-021-00577-0 [DOI] [PMC free article] [PubMed] [Google Scholar]
- 33.Lancaster GI et al. Evidence that TLR4 Is Not a Receptor for Saturated Fatty Acids but Mediates Lipid-Induced Inflammation by Reprogramming Macrophage Metabolism. Cell Metab 27, 1096–1110.e5 (2018). [DOI] [PubMed] [Google Scholar]
- 34.Zanoni I et al. CD14 controls the LPS-induced endocytosis of Toll-like receptor 4. Cell 147, 868–880 (2011). [DOI] [PMC free article] [PubMed] [Google Scholar]
- 35.Hagar JA, Powell DA, Aachoui Y, Ernst RK & Miao EA Cytoplasmic LPS activates caspase-11: implications in TLR4-independent endotoxic shock. Science 341, 1250–1253 (2013). [DOI] [PMC free article] [PubMed] [Google Scholar]
- 36.Kayagaki N et al. Noncanonical Inflammasome Activation by Intracellular LPS Independent of TLR4. Science 341, 1246–1249 (2013). [DOI] [PubMed] [Google Scholar]
- 37.Chevigné A & Jacquet A Emerging roles of the protease allergen Der p 1 in house dust mite-induced airway inflammation. J Allergy Clin Immunol 142, 398–400 (2018). [DOI] [PubMed] [Google Scholar]
- 38.Jacquet A Characterization of Innate Immune Responses to House Dust Mite Allergens: Pitfalls and Limitations. Front. Allergy 0, (2021). [DOI] [PMC free article] [PubMed] [Google Scholar]
- 39.Evren E, Ringqvist E & Willinger T Origin and ontogeny of lung macrophages: from mice to humans. Immunology 160, 126–138 (2020). [DOI] [PMC free article] [PubMed] [Google Scholar]
- 40.Makita N, Hizukuri Y, Yamashiro K, Murakawa M & Hayashi Y IL-10 enhances the phenotype of M2 macrophages induced by IL-4 and confers the ability to increase eosinophil migration. Int Immunol 27, 131–141 (2015). [DOI] [PubMed] [Google Scholar]
- 41.Price JV & Vance RE The macrophage paradox. Immunity 41, 685–693 (2014). [DOI] [PubMed] [Google Scholar]
- 42.Eastman AJ et al. Cryptococcal heat shock protein 70 homolog Ssa1 contributes to pulmonary expansion of Cryptococcus neoformans during the afferent phase of the immune response by promoting macrophage M2 polarization. J Immunol 194, 5999–6010 (2015). [DOI] [PMC free article] [PubMed] [Google Scholar]
- 43.Qiu Y et al. Immune modulation mediated by cryptococcal laccase promotes pulmonary growth and brain dissemination of virulent Cryptococcus neoformans in mice. PLoS One 7, e47853 (2012). [DOI] [PMC free article] [PubMed] [Google Scholar]
- 44.Wagener J, MacCallum DM, Brown GD & Gow NAR Candida albicans Chitin Increases Arginase-1 Activity in Human Macrophages, with an Impact on Macrophage Antimicrobial Functions. mBio 8, (2017). [DOI] [PMC free article] [PubMed] [Google Scholar]
- 45.Wang W et al. A small secreted protein triggers a TLR2/4-dependent inflammatory response during invasive Candida albicans infection. Nat Commun 10, –14 (2019). [DOI] [PMC free article] [PubMed] [Google Scholar]
- 46.Chun CD & Madhani HD Applying genetics and molecular biology to the study of the human pathogen Cryptococcus neoformans. Methods Enzymol 470, 797–831 (2010). [DOI] [PMC free article] [PubMed] [Google Scholar]
Methods References
- 47.Chun CD & Madhani HD Applying genetics and molecular biology to the study of the human pathogen Cryptococcus neoformans. Methods Enzymol 470, 797–831 (2010). [DOI] [PMC free article] [PubMed] [Google Scholar]
Associated Data
This section collects any data citations, data availability statements, or supplementary materials included in this article.
Data Availability Statement
The primary read files as well as expression count files for RNA-seq data in this paper are available to download from GEO (accession number GSE203483). Source data are provided with this paper.


