

Abstract
Delay discounting tasks measure the relation between reinforcer delay and efficacy. The present study established the association between delay discounting and classroom behavior and introduced a brief measure quantifying sensitivity to reward delays for school-aged children. Study 1 reanalyzed data collected by Reed and Martens (J Appl Behav Anal 44(1):1–18, https://doi.org/10.1901/jaba.2011.44-1, 2011) and found that 1-month delay choices predicted student classroom behavior. Study 2 examined the utility of the 1-month delay indifference point in predicting saving and spending behavior of second-grade students using token economies with two different token production schedules. Collectively, results showed (a) the 1-month delay indifference point predicted classroom behavior, (b) children who discounted less and had greater self-regulation, accrued and saved more tokens, and (c) a variable token production schedule better correlated with discounting than a fixed schedule. Implications are discussed regarding utility of a rapid discounting assessment for applied use.
Keywords: Delay discounting, Classroom, Sensitivity to reward delays, Token economy
Introduction
Delay discounting is a concept within behavioral economics that examines preferences between smaller/sooner and larger/later reinforcers (abbreviated as SSR and LLR, respectively). Accordingly, this concept presents applied implications for constructs such as “delay of gratification” (Mischel, 1983) or tolerance for delayed reinforcers. While behavioral economics researchers study the effects of reinforcer constraints on operant responses (Hursh & Roma, 2016)—typically measured in operant demand—behavioral economists have translated microeconomic concepts to study delay discounting. Delay discounting, defined as the systematic devaluation of reinforcement as a function of increasing temporal delays, quantifies a person’s operant sensitivity to delayed reinforcers. Studying delay discounting involves a variety of procedures, ranging from hypothetical choice arrangements to experiential tasks (see review in Reed et al., 2020); central to all discounting tasks is the measurement of responding toward either SSRs or LLRs.
Despite the apparent translational utility of delay discounting in bridging applied behavior analytic concepts and broader constructs outside behaviorism, this topic remains relatively under-researched within applied behavior analysis. Quantifying sensitivity to delayed reinforcement renders it especially conducive to understanding everyday behavior related to constructs such as impulsivity (for a critique of this term, though, see Strickland & Johnson, 2020), which are thought to be associated with myopic reinforcer preferences. Indeed, delay discounting is associated with many maladaptive outcomes of social importance [e.g., myriad health problems (Daugherty & Brase, 2010), psychiatric conditions (Amlung et al., 2019), cigarette smoking (Mitchell, 1999), drug and alcohol abuse (Richards et al., 1999), overeating (Weller et al., 2008), and gambling (Reynolds, 2006)] and findings have shown that these choice patterns are consistent across contexts (Odum, 2011a, 2011b). Shallow discounting is also associated with “delay of gratification,” or what some behavior scientists call “self-control,” which is the behavior of selecting the more advantageous LLR over a less advantageous SSR (Dixon & Tibbetts, 2009). Behavior analysts have thereby proposed that delay discounting may be a promising approach to understanding socially important behavior from an operant perspective, while using concepts and procedures more readily accepted and understood by mainstream psychology (see Critchfield & Kollins, 2001).
Outside of applied behavior analysis, the majority of research on delay discounting has been conducted in laboratory settings with adult populations completing hypothetical delay discounting tasks. Nevertheless, studies have shown that younger populations discount delayed rewards (Reed & Martens, 2011) and that discounting relates to real-world outcomes that are of interests to educators and clinicians. Researchers have shown that adolescents discount more compared to adults (Steinberg et al., 2009) and that greater delay discounting correlated with lower IQ (Dougherty et al., 2014) and lower educational attainment (Jaroni et al., 2004). A review of delay discounting studies with participants with a mean age of 12.99 years old or younger showed: (a) the majority of studies used hypothetical choices about money, (b) less than half of the assessments included visual aids for comprehension of choice options, and (c) only one study was conducted in a classroom setting (Staubitz et al., 2018).
In an applied behavior analytic example, Reed and Martens (2011) investigated delay discounting in a classroom setting and compared reinforcement delivered immediately after class or in 24 h when the students could exchange for backup reinforcers. The researchers found that for students with higher discounting rates, the delayed rewards were less effective in improving on-task behavior compared to immediate rewards. Given that younger populations discount delayed rewards, additional studies on delay discounting in an applied setting with younger populations are needed to translate the laboratory measures of delay discounting to a more naturalistic setting. The findings can help educators find the optimal use of rewards and schedules of reinforcement to promote delay of gratification in younger populations especially those at higher risk for poor long-term outcomes.
Further, delay discounting has clear implications for saving and spending behavior. People set a financial goal but often divert from their initial plan and spend money on smaller, immediately available goods or services at the expense of saving money for a more advantageous, delayed reward. One way to measure children’s saving and spending behavior is by using a classwide token economy system which mimics a real-world economy where consumers (i.e., students) and producers (i.e., teachers) interact to allocate limited resources (i.e., backup reinforcers). Students’ saving and spending behavior can be captured in this process, and researchers can thus use the data to relate it to delay discounting measure. A classwide token economy captures younger students’ spending and saving behavior because these behaviors start to evolve at a young age as children develop the ability to grasp the concept of “temptation” and the consequences of spending sooner on future opportunities (Sonuga-Barke & Webley, 1993). Children between ages of 6 and 12 years start to understand the value of saving and the association between saving and better future opportunity (Te’eni-Harari, 2016). At around 12 years of age, youth formulate and engage in more complex saving and spending strategies (Sherraden et al., 2011). Studies also found that saving behavior in adolescence was associated with adult saving (Ashby et al., 2011) and in general, older children save more money compared to younger children (Mischel & Mischel, 1983). A recent study showed that delay discounting is related to risky financial and household savings behavior for smokers (Snider et al., 2019); however, more studies are needed to understand the relation between delay discounting and saving and spending behavior of younger populations. Understanding children’s saving and spending behavior and relating it to delay discounting can broaden the scope of delay discounting and provide insight into its utility with children, which would inform researchers on the development of interventions aimed to improve long-term delay of gratification and financial decision making.
Despite the applicability of delay discounting measures across populations and behavioral problems, and implications for saving and spending behavior, the complex nature of deriving meaningful numbers impedes its widespread use among educators and clinicians (Critchfield & Reed, 2009). Typically, researchers would find several indifference points, which are points at which the value switches from the LLR to the SSR (i.e., the points at which the subjective values of LLR and SSR are equal; Reed et al., 2013), through delay discounting tasks with binary intertemporal choices and use them to find discounting parameters (e.g., k values; see Odum, 2011a, 2011b) through nonlinear modeling (see Gilroy et al., 2017) and area under the discounting curve (AUC; e.g., Myerson et al., 2001) to quantify sensitivity to reward delays. Finding the parameters and AUC involves mathematical equations and a certain level of knowledge in statistics and software (Motulsky & Christopoulis, 2006). Thus, a brief and rapid delay discounting assessment is warranted. The higher-order pattern of choice behavior observed in delay discounting occurs consistently across contexts for adults (Odum, 2011a, 2011b). Since this choice pattern is relatively stable across contexts, a brief assessment of sensitivity to reward delay could be a predictor for socially significant behavior across various contexts. The development of a brief assessment could be especially useful for children as it would measure delayed reward sensitivity across different contexts relevant to this population such as classroom behavior.
In response, the current study investigated a Brief Intertemporal Choice Task for applied settings that can be used to assess the degree of delayed reward sensitivity of younger populations. The overall goal was to evaluate the association between delayed reward sensitivity and classroom behavior in children and suggest the potential applied use of the findings. The original study plan included investigating the relation between student saving and spending behavior using a classwide token economy system and delay discounting measures with several indifference points. However, when schools closed as a response to the COVID-19 pandemic during the course of the study, the researchers were only able to complete the delay discounting task at 1-month delay and serendipitously found that the indifference point at 1-month delay may be enough to predict token economy saving and spending behavior for a younger population. Unexpected lines of research and findings like such refer to “discovery research” (Roane et al., 2003) and the serendipitous findings can be meaningful and noteworthy for the scientific community. Therefore, the primary goal of this study was to bridge the gap between basic and applied research on delay discounting by (a) reanalyzing the discounting task data from Reed and Martens (2011; Study 1 of this report), and (b) introducing a rapid assessment called the Brief Intertemporal Choice Task (BRIC Task) to assess the degree of sensitivity to reward delays in a younger population and measure how performance on this task predicts student saving and spending behavior (Study 2 of this report). A secondary goal was to determine individual differences in saving and spending patterns across the different token production schedules for school-aged children and to examine whether individual differences in children’s delay discounting were related to another measure of self-regulation behavior.
Study 1
The purpose of Study 1 was to reanalyze discounting task data from Reed and Martens (2011) to evaluate (a) test–retest reliability of indifference points associated with the 1 month delay value used in their assessment for all 46 participants in the classwide intervention (the published study only included discounting data for the 26 students whose data met inclusionary criteria for systematic discounting and were analyzed with nonlinear curve-fitting), (b) correlations between the 1 month delay indifference point and AUC of the overall discounting function, (c) analysis of ED50 of the k values from the 26 participants in the original study, and (d) correlations (for all 46 participants) between the 1 month delay indifference point and their primary dependent variable from the classwide token system: the difference in mean on-task behavior between immediate and delayed token exchanges.
Method
Discounting Data
As described in Reed and Martens (2011), the original study assessed delay discounting and on-task behavior for 46 sixth graders who averaged 12.10 (SD = 0.30) years of age and attended a rural public elementary school. All participants (a) did not have a formal disability classification, (b) were proficient in English, and (c) read independently based on teacher evaluations. The discounting procedure consisted of a rapid titration of binary choices between SSRs and LLRs (monetary; the magnitude of the undiscounted LLR was $100) across delays ranging from 1 day to 4 years. The researchers administered the discounting procedure to each participant twice, with each procedure separated by 1 week.
Delay discounting analyses in the original study were limited to the 26 participants meeting the following inclusionary criteria: “if the mean of the indifference points from the three shortest delay conditions exceeded the mean of the indifference points from the three longest delay conditions, with no more than … two instances of increasing indifference points across successive delays” (p. 8). The researchers fitted both the hyperbolic (Mazur, 1987) and hyperboloid discounting (Myerson & Green, 1995) models to render rates of discounting (i.e., k values) to these 26 participants’ discounting by fitting the mean of each participant’s indifference points of the two assessments to the hyperbolic and hyperboloid models. However, all 46 participants returned indifference points for all delays; thus, AUC (see original study) was available for all 46 participants, as well.
On-Task Behavior Direct Observation Data
The Reed and Martens study (2011) included direct observation of on-task behavior for all 46 participants under both immediate (following the 20-min observation) and delayed (24-h after observation) token exchange delays during a classwide intervention (see original study for specific details). The authors calculated the difference in off-task behavior between the two exchange delay phases of the intervention as a primary dependent variable.
Results and Discussion
Table 1 displays a summary of the findings of the reanalysis. Reanalysis of the 46 participants’ discounting data from the original Reed and Martens study (2011; i.e., data not reported in their original study) suggested the indifference points and AUC values did not pass the D’Agostino and Pearson normality test, indicating the need for nonparametric statistics. Further reanalysis yielded a median 1-month indifference point of $30.00 (IQR = 7.00 to 70.00) at Time 1, and a median of $50.00 (IQR = 6.25 to 80.00) at Time 2. The median AUC was 0.13 (IQR = 0.04 to 0.24) at Time 1, and a median of 0.12 (IQR = 0.02 to 0.29) at Time 2. The test–retest reliability of the 1-month indifference point was significantly strong, rs = 0.80, p < 0.001, N = 46 (a coefficient between 0.75 and 1.00 indicates “excellent” reliability and clinical significance; Cicchetti, 1994). Note that the reported rs for the 26 participants meeting criteria for systematic discounting in the original study was 0.81; thus, the data from all 46 participants are as reliable as those for the 26 participants subsample in the original study. Similarly, the test–retest reliability of AUC was significant and strong, rs = 0.83, p < 0.001, N = 46. Finally, correlations between the 1-month indifference point and AUC were significant and relatively strong at both Time 1 (rs = 0.45, p < 0.001, N = 46) and Time 2 (rs = 0.58, p < 0.001, N = 46). In sum, it appears the 1-month indifference point is reliable across 1 week, and is a sufficient proxy to an overall AUC.
Table 1.
Summary of reanalysis of Reed and Martens (2011)
| Measure | Time 1 | Time 2 |
|---|---|---|
| Median 1-month indifference point | $30 (IQR = 7.00 to 70.00) | $50.00 (IQR = 6.25 to 80.00) |
| Median AUC | 0.13 (IQR = 0.04 to 0.24) | 0.12 (IQR = 0.02 to 0.29) |
| Correlations between the 1-month indifference point and AUC | rs = .45*** | rs = .58*** |
| Correlations between the 1-month indifference point and the difference scores between immediate and delayed classroom contingencies | rs = − 0.33* | |
| Test–retest reliability of the 1-month indifference point | rs = 0.80*** | |
| ED50 | 34.27 days (SD = 40.14) | |
AUC area under the curve, ED effective delay
*p < .05; *** p < .001
Reed and Martens (2011) provided k values for the 26 participants meeting inclusion criteria for fitting discounting curves. At the time of their publication, they failed to explore a secondary analysis of discounting rate: ED50. Yoon and Higgins (2008) proposed that the inverse of k renders the “effective delay” (ED) associated with 50% discounting—this ED50 variable is convenient as it provides a simple delay-scaled metric associated with discounting. That is, ED50 permits a precise quantification of the delay (in time-based units like days/weeks) associated with a 50% reduction in the subjective value of delayed reinforcer, which provides an easily communicable metric of delayed reward sensitivity to non-behaviorists. Across the 26 participants’ data from Table 1 of Reed and Martens, ED50 was calculated for the 20 participants with nonzero k values; ED50 was normally distributed (according to the D’Agostino & Pearson test) and ranged from 0.54 to 100 days, with the mean ED50 equal to 34.27 days (SD = 40.14)—approximately equal to 1 month. That ED50 approximated 1 month lends further evidence that the 1-month delay is particularly useful in understanding school-aged students’ discounting and sensitivity to reward delays.
To evaluate the potential of a one-time indifference point at the 1-month delay serving as a proxy to sensitivity to reward delay in practice, researchers examined the correlation between the Time 1 indifference points and the difference scores between immediate and delayed classroom contingencies. The correlation was significant and moderate, rs = -0.33, p = 0.026, N = 46, suggesting that higher indifference points (i.e., higher valuation of a reward at 1-month delay) were associated with smaller sensitivity to classroom token delay contingencies. Simply put, participants who featured less differences in on-task behavior between immediate and delayed token exchange schedules also featured higher indifference points. Collectively, these data suggest the relationship between sensitivity to hypothetical 1-month monetary reward delays and classroom behavior in children.
In sum, the findings of this reanalysis suggest the 1-month delay from Reed and Martens’ discounting task (2011) appear to be reliable and predictive of classroom behavior. These findings lend promise to the potential use of a single delay discounting task as a rapid assessment of reinforcement delay sensitivity in school-aged children.
Study 2
The reanalysis of Reed and Martens (2011) showed that the indifference point at 1-month period significantly related to classroom behavior and adequately proxied participants’ sensitivity to reward delay. The primary purpose of Study 2 was to extend the findings of Study 1 by (a) examining how the 1-month delay from the discounting task predicts school-aged children’s spending and saving behavior in a classwide token economy, and (b) establishing a rapid assessment of reinforcement delay sensitivity in school-aged children, also called the Brief Intertemporal Choice Task (BRIC Task). The secondary purpose was to study individual differences for responding to two different token production schedules. Finally, because laboratory measures of delay of gratification have been linked to children’s self-regulation, or the capacity to resist a prepotent response (e.g., Jahromi et al., 2019), the researchers also investigated whether delay discounting was related to individual differences in teachers’ ratings of children’s self-regulation on a measure often used in mainstream psychology, the Behavior Rating Inventory of Executive Functioning 2 (BRIEF2; Gioia et al., 2015).
Method
Participants
Seventeen second graders (7 female and 10 male students) participated. The participants’ ages ranged from 7.08 to 7.92 (M = 7.54) years old. Four participants had Individualized Education Programs (IEP) with classifications of specific learning disability, autism spectrum disorder, language impairment, and other health impairment with the diagnosis of attention-deficit/hyperactivity disorder (ADHD). One participant qualified for a 504 plan. Of the 17 participants, seven received free/reduced lunch (i.e., an index of a participant’s family’s socio-economic status), and six participants qualified as English-Language Learners (ELL). Fifteen participants had experience with a classwide token economy system the prior school year. Two participants were new to the token economy system and the researcher conditioned tokens in the beginning of the year by pairing tokens with verbal praise and preferred activities and objects. One female participant who was both an ELL and received free/reduced lunch moved schools in the middle of the year. For this participant, we collected data for the first half of the study (i.e., fixed token production schedule and Behavior Rating Inventory of Executive Functioning 2 (BRIEF2) assessment) but did not for the second half of the study (i.e., the variable token production schedule and hypothetical delay discounting assessment). Put simply, we included 17 participants for the fixed token production schedule condition and BRIEF2 (i.e., secondary analysis) but 16 participants for the variable token production schedule condition and the BRIC Task (i.e., primary analysis). Prior to the study, all participants mastered learning money concepts involving bills and coins during math per the second-grade common core standard (2.MD.C.8) and mastered counting to 120 and comparing two two-digit numbers per the first-grade common core standard (1.NBT.A.1 and 1.NBT.B.3, respectively).
Setting and Materials
The study took place in a public elementary school located in a suburb outside of a large metropolitan area with grades from pre-school to second. All participants were in a second-grade classroom that used a Comprehensive Application for Behavior Analysis to Schooling (CABAS®, Accelerated Independent Learner program; Greer, 1994) model with 18 students, one head teacher, and two teaching assistants. The model incorporates a scientific approach to pedagogy, learning, curriculum, and classroom management, and all instruction is individualized to each student’s repertoire. All token economy sessions took place in the participants’ classroom throughout the day and trade-in took place at the end of each school day. The researchers conducted the BRIC Task at individual tables in the classroom during the school day and teachers completed the BRIEF2 during the same month other measures were collected.
Materials for the fixed and variable token production schedule conditions included various tangible prizes for the prize store (i.e., 16 different types of small toys and school supplies), seven plastic prize boxes with numbers 1, 3, 5, 10, 20, 50, and 100 attached, paper money called “criterion cash” with a picture of the school mascot on the tokens (11.0 by 5.6 cm), and token economy data sheets.
The researchers also used the Behavior Rating Inventory of Executive Functioning 2 (BRIEF2) Teacher Form as a formal measure of self-regulatory functions (Gioia et al., 2015). Past studies showed that poorer executive functioning skills related to less effective delay of gratification strategies such as more temptation-focused behaviors (Jahromi et al., 2019). The BRIEF2 is an assessment tool designed to be completed by an adult, typically a teacher, who has had extended contact with a child between the ages of 5 and 18 years old. The assessment consists of nine clinical scales (i.e., inhibit, self-monitor, shift, emotional control, initiate, working memory, plan/organize, organization of materials, and monitor) and two validity scales. Using a 3-point Likert-type scale ranging from “Never” to “Often,” teachers reported on how often specific behaviors have been a problem for the student (e.g., “Does not plan ahead for school assignments”). In this study, the researcher used a composite global score. Psychometrically, the BRIEF2 has been reported to have high internal consistency (αs = 0.80–0.98) and test–retest reliability (rs = 0.88 for teachers). The assessment uses normative data with a standardization sample (N = 3,603 total cases) matched by gender, age, ethnicity, and parent education level to US Census statistics (Gioia et al., 2015). In the present study, Cronbach’s alpha for the BRIEF2 was highly reliable (α = 0.94).
For the BRIC Task (delay discounting measure), the researcher used PowerPoint slides and a data sheet (Appendix A; from Critchfield & Atteberry, 2003 and Reed & Martens, 2011). Each PowerPoint slide consisted of a written direction, “Would you rather have,” on the top of the screen and had two boxes (7.62 cm X 7.62 cm) underneath it with the two reward values in each box. Each box represented a SSR value and a LLR monetary value. The researchers used the material and data sheet for only 1-month delay due to school closing as a response to the COVID-19 pandemic.
Procedure
Preference Assessment
The researcher used a multiple stimulus without replacement (DeLeon & Iwata, 1996) to identify highly preferred backup reinforcers for the token economy. The researcher rank ordered individual preferences, with the first rank being the most preferred. Once the researcher collected the preference-rank data for each participant, rank orders were averaged across participants. The researcher placed the most preferred item in the box with the highest value and the least preferred item in the box with the lowest value. There were seven boxes, wherein each box represented different costs (i.e., 1, 3, 5, 10, 20, 50, and 100 tokens).
Token Economy
The researcher conducted the study in a second-grade inclusion classroom using a classwide token economy system. A token economy system was used because tokens can function as an alternative approach to hypothetical choice or money (Reed et al., 2013; Staubitz et al., 2018) and are considered advantageous in that they bridge the delay between behavior and reinforcement (see Hackenberg, 2018)—an important concept in a delay discounting approach to treatment. A recent study that investigated delay discounting with a younger population suggested the need for further investigation in the use of alternative approaches or adaptations for children who may have difficulty understanding hypothetical constructs such as money or delay (Staubitz et al., 2018). Students in classrooms often earn reinforcers and backup reinforcers based on completion or performance—completion means when students earn tokens upon completing a task without consideration for accuracy (e.g., finishing a worksheet) while performance means when students earn tokens depending on completion and accuracy (e.g., completing a worksheet with 100% accuracy). Therefore, the researcher evaluated two different token production schedules, which is the rate at which delivery of tokens are made respective to the number of target behaviors emitted (Hackenberg, 2009; Kazdin & Bootzin, 1972), to evaluate the effects of the different earning schedules on students’ saving and spending behavior. The researcher termed the token production schedule “fixed” for completion because students earned a fixed number of tokens each day while “variable” for performance because the number of tokens earned depended on learning performance that day.
Fixed Token Production Schedule. In the fixed token production schedule, each participant received two criterion cash (i.e., tokens) per school day. Each participant received one criterion cash for reading and one for math at the end of each period contingent on completion of all activities for each period. Reading and math periods each lasted approximately 80 min every school day. At the end of each school day 20 min before dismissal time, the researcher called each participant to the prize store contingent on daily assignment completion. Then, the researcher asked, “How many criterion cash do you have today?” After the participant responded with the total number of criterion cash he or she possessed (i.e., remaining criterion cash from previous day plus those earned in the respective days), the researcher let the participant save or spend their criterion cash. If the participant decided to spend, he or she was allowed to select an item in accordance with the price of the item and the tokens the individual had earned. In other words, if the participant had seven criterion cash, he or she had the choice to go to 1, 3, or 5 prize box. Each participant was allowed to purchase one item per day at the end of the day. If the participant decided to save, he or she was allowed to keep the criterion cash earned on the respective day and previous days without exchanging the tokens for a prize. For each participant, the researcher recorded the total number of tokens and the number of tokens spent. The fixed token production schedule was in place for approximately 4 months during the fall semester (September to December).
Variable Token Production Schedule. The variable token production schedule procedure was identical to the fixed token production schedule, except that each participant received a variable number of tokens each day depending on the number of learning objectives met. The teachers scripted out the learning objectives for each subject (i.e., reading, writing, and math) prior to the study and modified them depending on each participant’s academic needs. For example, a participant could earn two tokens by demonstrating mastery of adding 2-digit numbers using a number line and expanded form strategy. Each participant received a minimum of 0 tokens and maximum of 10 per day. The variable token production schedule was in place for approximately 3 months during the spring semester (January to mid-March when the school closed due to the COVID-19 lockdown).
For each participant, the researcher obtained the mean balance and mean peak point per token production schedule. The mean balance represented an overall number of tokens a participant kept in his/her account reflecting the daily changes in savings or expense, and the mean peak point represented an overall maximum number of tokens a participant accumulated until he/she decided to trade in. The mean balance was calculated by adding the total number of tokens each participant had each day and dividing the sum by the total number of trade-in days. The mean peak point was calculated by adding the “peaks” of each phase and dividing the sum by the total number of trade-in days. The researcher defined a “peak point” as a number that had a smaller preceding and following number in the data string. For example, if a data set showed 2, 4, 6, 8, 4, 6, 8, 10, 2, 4, 6, 2, with each number representing the balance of each day, then the data would have three peaks: 8, 10, 6, and a mean peak point of 8 (range, 6 to 10).
Behavior Rating Inventory of Executive Functioning 2 (BRIEF2) Assessment
Former teachers of each participant completed the BRIEF2 Teacher Form. The former teachers have had at least 6 months of time spent together during the prior school year. The researcher added the scores for a global score. These scores were translated into normative T scores, which provided information about an individual’s scores relative to the scores to other respondents in the standardization sample (Gioia et al., 2015). Higher global score reflects more problems with self-regulation (Gioia et al., 2015).
Brief Intertemporal Choice Task (BRIC Task)
The researcher administered the BRIC Task to obtain the indifference point at 1-month delay from the discounting task. The researcher used hypothetical, monetary choices of SSR and LLR and asked each participant a series of questions with binary choices. For each question, the participant was required to choose one of two monetary choices that had a contrasting length of delay and size of reinforcer. The researcher manipulated the amount of SSR values while holding the 1-month LLR delay value constant to determine the points at which each participant changed his or her choice from the LLR to the SSR. There were 22 possible indifference points (Appendix A; from Critchfield & Atteberry, 2003 and Reed & Martens, 2011).
All participants started with a binary choice between SSR of $50 and LLR of $100. The researcher provided the vocal antecedent, “Would you rather have $50 right now or $100 in one month?” If the participant chose the $50 available now, the next trial consisted of a smaller amount of money available now against $100 available in one month. However, if the participant chose $100 in one month, the next trial consisted of a larger immediate monetary amount and the delayed $100. The researcher collected data on a data sheet with all possible choices (Appendix A; from Critchfield & Atteberry, 2003 and Reed & Martens, 2011). Then, the researcher derived the subjective value of the $100 (i.e., indifference point) in terms of smaller amount of money available immediately (see Critchfield & Atteberry, 2003; Reed & Martens, 2011).
Interobserver Agreement
A second observer independently collected data for the purpose of assessing interobserver agreement (IOA) of the delay discounting task. The researchers calculated trial-by-trial IOA by adding the number of binary choices in agreements, dividing by the total number of binary choices of agreements and disagreements and multiplying by 100%. The researchers obtained IOA data for 15 out of 16 BRIC Tasks (94%) with 100% agreement.
Results and Discussion
Analysis of BRIEF2 and the BRIC Task
Table 2 shows the Spearman’s rho correlation among the mean peak point, mean balance, GEC scores, and the indifference point at 1-month delay obtained through the BRIC Task. Given the skewed distribution (i.e., variance was not normally distributed on a bell curve) of the indifference point at 1-month delay and BRIEF2 scores, the researcher conducted a nonparametric Spearman’s rho correlations (rs) to determine whether students with higher mean peak point and mean balance have (a) higher indifference point at 1-month delay and (b) lower BRIEF2 global score. In the fixed token production schedule, there was a significant positive correlation between the indifference point and the mean balance (rs = 0.53, p = 0.04) but marginally significant with the mean peak point (rs = 0.49, p = 0.05). In the variable token production schedule, there was a significant positive correlation between the indifference point and the mean balance (rs = 0.56, p = 0.02) and the mean peak point (rs = 0.59, p = 0.02). Overall, students with higher indifference points were more likely to wait to exchange tokens (i.e., higher mean peak point and mean balance) in both fixed and variable token production schedules. Across both mean peak point and mean balance, the correlation was stronger in the variable token production schedule compared to the fixed schedule. In other words, students who discounted less saved and accrued more, and children’s performance on the BRIC Task had a strong relation with variable token production performances.
Table 2.
Correlations among mean peak point, mean balance, BRIEF2, and subjective value of $100 at 1-month delay
| Variable | 1 | 2 | 3 | 4 | 5 | 6 |
|---|---|---|---|---|---|---|
|
1. Mean B (Var) |
1 | |||||
| 2. Mean PP (Var) | .80** | 1 | ||||
| 3. Mean B (Fixed) | .55* | .73** | 1 | |||
| 4. Mean PP (fixed) | .67** | .76** | .96** | 1 | ||
| 5. BRIEF2 GEC | − .56* | − .51* | − .59* | − .73** | 1 | |
| 6. Subjective value of $100 at 1-month delay | .56* | .59* | .53* | 0.49 | − 0.27 | 1 |
B = Balance, PP peak point, Var variable token production schedule, Fixed fixed token production schedule, BRIEF2 GEC global executive composite score
*p < .05, ** p < .01
Students with higher GEC scores (i.e., reported to have more frequent self-regulation problems) were more likely to have a lower mean peak point and mean balance in both fixed and variable token production schedules. In the fixed token production schedule, there was a significant negative correlation between the GEC score and the mean balance (rs = − 0.59, p = 0.01) as well as the mean peak point (rs = − 0.73, p = 0.001). In a variable token production schedule, there was a significant negative correlation between the GEC score and the mean balance (rs = − 0.56, p = 0.02) as well as the mean peak point (rs = − 0.51, p = 0.046). Across both mean peak point and mean balance, the correlation was stronger in the variable token production schedule compared to a fixed schedule. Interestingly, there was not a significant correlation between the indifference point found by the BRIC Task and GEC score (rs = − 0.27, p = 0.31), highlighting that the BRIC Task may capture elements of the delay context unique from other self-regulatory measures. Overall, students with higher GEC scores were more likely to have lower mean peak point and mean balance in both fixed and variable token production schedules. Across both mean peak point and mean balance, the correlation was stronger in the variable token production schedule condition compared to a fixed schedule. In other words, students who have higher self-regulation save and accrue more tokens, and performance on the BRIC Task was highly correlated with variable token production performances. Collectively, higher executive functioning (i.e., better self-regulation) and higher indifference point at 1-month delay maps onto saving more.
Mean Peak Point and Mean Balance
Figure 1 shows descriptive data on the change of individual participants’ mean balance and peak point when the token production schedule changed from fixed to variable. All students, except for one in the mean peak point and two for mean balance, showed an increase in mean peak point and mean balance when the token production schedule changed from fixed to variable. In a fixed token production schedule, the classwide mean peak point was 12.47 (range 3.57–78.5) and classwide mean balance was 9.77 (range 2.93–51.12). In a variable token production schedule, the classwide mean peak point was 19.20 (range 6–64) and classwide mean balance was 15.70 (range 4.11–33.77).
Fig. 1.
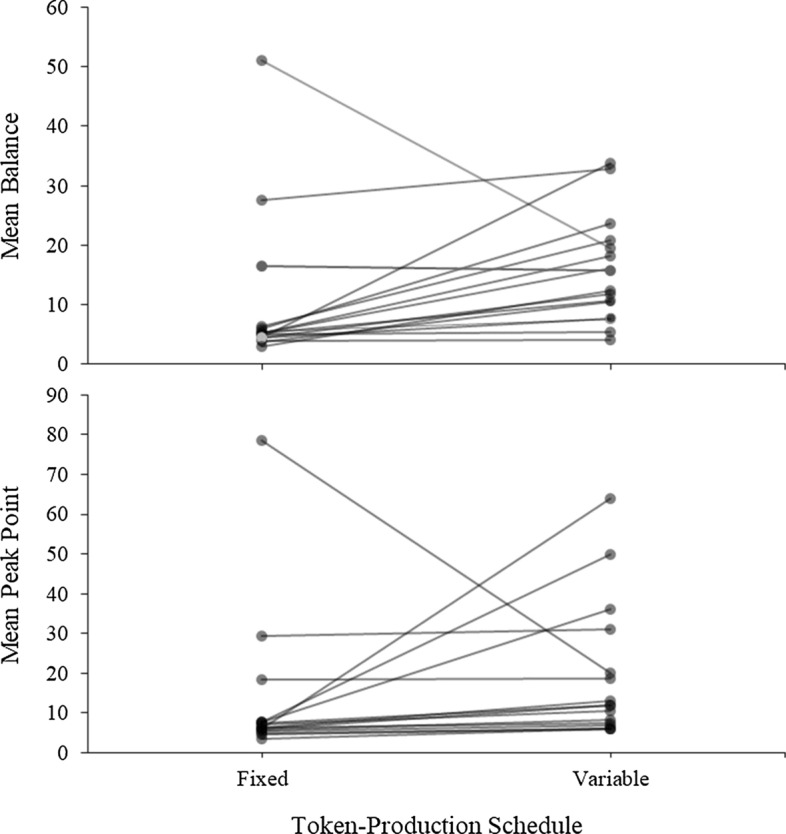
Individual Change of Mean Peak Point and Mean Balance When Token Production Schedule Changes. Note. This figure shows the individual participant’s change of mean balance and mean peak point when the token production schedule changes from fixed to variable
Overall, Study 2 showed that the BRIC Task was a unique evaluation and predicts actual student behavior in token economy systems. Some major findings include: (1) BRIC Task predicts classroom behavior, (2) students who discounted less and had higher self-regulation saved and accrued more tokens, (3) a variable token production schedule better represented saving and spending behavior compared to a fixed token production schedule, and (4) BRIC Task may capture a different element of the delay context than what is tapped by the BRIEF2, which captures a broader range of children’s self-regulation behaviors.
General Discussion
Delay of rewards is present in many settings including classrooms with younger children (Reed & Martens, 2011). This warrants the need for more translational studies on the application of delay discounting for younger population in applied settings (Staubitz et al., 2018). However, the complex nature of deriving meaningful numbers impedes its widespread use among educators and clinicians (Critchfield & Reed, 2009). The present study attempted to fill the gap in the literature pointed by Staubitz et al. (2018) and introduce a brief assessment of sensitivity to reward delays for children. While other discounting procedures for children show promise in research settings (e.g., Miller, 2019), the current approach leverages a larger body of existing research on the protocol and does not require specific technologies typically afforded to scientists (e.g., survey software).
First, the findings from the two studies demonstrated that the delay discounting task at 1-month delay is reliably associated with students’ classroom behavior including on-task behavior and saving and spending of tokens. The results extended the past literature by establishing the association between delay discounting and classroom behavior for younger students (Reed & Martens, 2011). Specifically, the study established an association between the indifference point at 1-month delay and classroom behavior and provided clear avenues for future research. Measuring how children respond to rewards at 1-month delay could function as a proxy to measuring children’s sensitivity to reward delay across different environments since choice making behavior observed in delay discounting is relatively stable across contexts (Odum, 2011a, 2011b). This is not to replace the existing methods to measure delay discounting, but rather add an alternative measure that individuals can use without deriving additional data. The BRIC Task can thereby serve as a valid, alternative tool to measure sensitivity to reward delays.
Second, students who discounted less and who were (a) reported by teachers to have higher self-regulation, and (b) saved and accrued more tokens. These findings suggest that hypothetical delay discounting assessments and those from mainstream psychology that capture self-regulation more broadly do show associations with meaningful behavior in applied settings. Critchfield and Kollins (2001) posed a question on whether hypothetical delay discounting assessments translate to or predict observable behaviors reinforced with real rewards. Similar to past studies, (Kirby & Marakovic, 1996; Reed & Martens, 2011; Richards et al., 1999), our findings showed an adequate level of correlation between hypothetical delay discounting task at 1-month delay for children and their responsiveness to delayed classroom rewards in two different token production schedules. Further, to the best of our knowledge, there has not been research that directly tested associations between school-aged children’s spending and saving behavior in token economies and discounting rate and teachers’ reports of self-regulation. Token economies are widely used across educational and clinical settings and have been identified as an effective evidence-based classroom management strategy (Simonsen et al., 2008). This means that the possible application of the findings is extensive.
Third, the pattern of descriptive results showed individual changes in response to token production schedule change. Individual students showed higher levels of saving under a variable token production schedule compared to a fixed one. It is possible that students were more motivated to save when they had the opportunity to earn tokens based on their performance. It should be noted that these data were only descriptive. Future studies may want to examine whether factors like student motivation are related to students’ sensitivity to rewards.
Implications for Future Research
There are several implications for future research. First, the present study suggests the role of the token production schedule or, in other words, response requirements in the preference of SSR or LLR. Past studies showed that preference for the LLR varies across populations and experimental conditions. Some researchers argued that organisms tend to value rewards available sooner rather than later (Hackenberg & Vaidya, 2003; Hyten et al., 1994) and others have argued that students tend to prefer LLR over SSR (DeLeon et al., 2014; Fienup et al., 2011; Ward-Horner et al., 2014). However, some of these studies did not directly manipulate the token production schedule or were not implemented in an applied setting (Hackenberg & Vaidya, 2003; Hyten et al., 1994), and some studies that investigated the response requirements did not use a token economy system (Fienup et al., 2011; Ward-Horner et al., 2014). Thus, future studies should investigate how manipulating the token production schedule in an applied setting affects individuals’ preference for SSR or LLR. From a broader social context, manipulation of the token production schedule may have direct implications on understanding financial decision making. Response requirements for earning a token (i.e., token production schedule) mimic the labor cost required to earn monetary profit. Investigating how different token production schedules map on to individuals’ preference for SSR and LLR may inform us on how these individuals prefer or allocate their responses to saving and spending money.
A second implication is the development of an intervention that promotes optimal choice making or behavior consistent with high delay of gratification in educational settings. Previously, researchers have taught individual optimal choice making by immediately delivering large magnitude reinforcers and then progressively increasing the delay across students with developmental disabilities (Vollmer et al., 1999), emotional and behavioral disorders (Staubitz et al., 2020), brain injury (Dixon et al., 2009), and ADHD (Binder et al., 2000). Research also showed that perceived importance of peer and parental attitudes toward saving money help explain children’s saving behavior (Te’eni-Harari, 2016). Given the possible role of peer influence on saving behavior and possibility of teaching optimal choice making behavior, adding a social competition element to this procedure may facilitate the process of improving delayed gratification for individuals with disabilities. For future studies, it may be worth investigating the effects of putting students in teams or competing against the teacher along with the fading procedure on optimal choice making behavior and saving and spending behavior.
Third, the BRIC Task may be particularly useful for studying sensitivity to reward delay of younger children because the assessment does not require researchers to exclude participants for analyses. In traditional delay discounting studies, participants not demonstrating a discounting effect (for definition, see Dixon et al., 2006) have been excluded from the final analyses [e.g., a study with adults excluded 15% of data (Critchfield & Atteberry, 2003) and a study with sixth graders only included 56% of data (Reed & Martens, 2011)]. The BRIC Task only involves one delay and does not require the participants to demonstrate a discounting effect. In turn, more participants, especially children beginning to understand the value of saving and long-term benefits (Te’eni-Harari, 2016) and are more likely to show variability in their discounting data, could be included in the analyses of studies relevant to sensitivity to reward delay.
Potential Application Ideas
One potential use of the brief assessment (BRIC Task) is for educators and clinicians to quantify sensitivity to reward delays or general level of self-regulation without involving complex mathematical equations and knowledge in statistics and software (Motulsky & Christopoulis, 2006). Specifically, our findings suggest that educators working in classrooms with younger populations could use the BRIC Task as a quick measure for individuals’ sensitivity to reward delays or self-regulation. An individual whose indifference point is larger is less sensitive to reward delays. In other words, the larger the indifference point is, the more likely an individual saves tokens for a backup reinforcer and has greater self-regulation. With such information, educators can arrange effective reward systems. If an individual scores higher in the BRIC Task (i.e., higher indifference point), educators could use leaner token production rate which requires greater number of responses to earn a reinforcer. If a student scores lower (i.e., lower indifference point), educators could utilize richer token production rate which requires smaller number of responses to earn a reinforcer and consider using delay fading of LLR to build delay of gratification. Then, educators could systematically fade the number of responses required to earn a reinforcer (i.e., progressively increase the number of responses) to facilitate delay of gratification. These individuals would also be more likely to spend the tokens warranting the need for more frequent token-earn schedule. It should be noted that all phases of the current study were administered and analyzed by the researchers. Therefore, while the BRIC Task has the potential to be applied to other settings, more replications and tests are needed to determine the generalizability of the findings across different applied settings and populations. A future research direction will be to test the social validity of the assessment across practitioners in order to evaluate the ease of use by clinicians and educators.
Further, a variable token production schedule (i.e., a schedule that allows individuals to earn tokens on based on performance) is recommended for greater saving behavior. Educators and clinicians should have clients or students earn tokens based on performance rather than completion to encourage saving token behavior. This way, educators can increase token saving, ensure that the client or student comes in contact with the LLR, and potentially enhance delay of gratification in a naturalistic setting. Thus, the saving behavior will come under the control of natural contingencies, facilitating generalization.
Limitations
The study is not without limitations. First, Study 2 included a small sample size. The study was conducted with 17 students in a single classroom. The small sample size may limit the results obtained from the correlations as well as the generalizability of the findings. However, the goal of the current study was to provide preliminary findings that could inform future research related to classroom behavior and delay discounting in younger children. Despite the small sample size and limitations, the current study provided preliminary findings that could lead to future research with participants recruited across different classrooms and schools.
Second, in the classwide token economy procedure, there were limited types of rewards in the prize store. There were 16 types of rewards in total, which resulted in two or three types of items in each prize box. The researcher addressed this limitation by diversifying the colors, shapes, sizes, patterns, and materials of the same item. For example, a yellow pencil used in the preference assessment would represent different colored and patterned pencils. The researcher also rotated the different types of items every two to three days to ensure that the students were not satiated. Moreover, given the natural classroom setting, school holidays and events were inevitable. The class did not have trade-in sessions on these days, and the researchers did not count these days for analysis to keep the data consistent across all students.
Further, there were limitations to the implementation of the assessments in Study 2. Initially, the researcher planned to conduct a full hypothetical delay discounting assessment with children but was unable to complete due to school closure as a response to the COVID-19 pandemic. The researchers serendipitously discovered that the 1-month delay can be sufficient enough to predict actual student behavior and inform individuals about school-aged children’s sensitivity to reward delays. While the serendipitous findings are noteworthy, the study would have benefited from doing a full delay discounting assessment. The researchers would have been able to compare the 1-month delay to other delays, further supporting the use of 1-month delay as a proxy for a full delay discounting assessment. Future studies should replicate the procedure with the complete assessment with eight indifference points to compare the delays using the same participant pool.
Additionally, in Study 2, the researchers used an average preference instead of individual preferences to identify backup reinforcers preference assessment. Some participants’ lowest-ranked items had a higher cost while some highest-ranked items were lower cost—when examining cost at an individual level. This means that there may have been limited reinforcing value of the backup reinforcers, which means that saving could have been a product of not finding any items valuable. However, 13 out of 17 participants (76%) selected the top-ranked reinforcer as their top-three choices, which means that the top-ranked reinforcer would have had the reinforcing effect for the majority of participants. The remaining four participants (24%) ranked the top-ranked reinforcer as 4th, 6th, 8th, and 8th out of 16 items. The lowest-ranked reinforcer, on the other hand, was selected as the bottom-three choices by only four out of 17 participants (24%), limiting the value of the item associated with low cost. While the top-ranked reinforcer had reinforcing value for most participants, the discrepancy between individual rank ordering and item price should be taken into consideration when interpreting the results. Future studies should also incorporate reinforcer assessments to ensure that preferred items functioned as reinforcers.
Another limitation is the lack of treatment fidelity data. Treatment fidelity ensures that the treatment was implemented as planned and eliminates threats to bias (Reichow et al., 2018). Future studies should incorporate a checklist for the token economy and BRIC Task procedures to ensure high levels of treatment fidelity. Also, addition of social validity measure that evaluates teacher preference for the BRIC Task over simple observations would have supplemented the findings regarding the utility of the BRIC Task in educational settings. This way, all consumers of the program contribute to the evaluation of acceptability and viability of the program goals, methods, and outcomes (Schwartz & Baer, 1991).
Lastly, implementation of fixed and variable schedule was not systematically manipulated, which may limit the comparison of the two token economy systems. Given that the study was conducted in an educational setting, the researcher implemented the same contingencies across all students in the same class as part of a classwide token economy system. Because the variable token production schedule condition was introduced a few months later, participants may have matured and engaged in more saving behavior since older children save more money compared to younger children (Mischel & Mischel, 1983). Additionally, the fixed token production schedule preceded the variable token production schedule for all participants. This means that the fixed token production schedule could have influenced student responding during the variable token production schedule. To address this problem, future studies should systematically manipulate the system to determine the effects of the different token production schedule on students’ saving and spending behavior.
Conclusion
Despite the limitations, the two studies demonstrated that the indifference point at 1-month delay can adequately predict classroom behavior and introduced a rapid and brief assessment tool to measure children’s sensitivity to reward delay. The study extended previous research by (a) establishing a translational utility of delay discounting measures to a naturalistic setting, (b) developing an alternative tool that warrants a widened use of delay discounting measures across fields, (c) experimentally demonstrating that children who discount less and have more self-regulation save and accrue more tokens, and (d) comparing the effects of different token production schedule on individual children. The findings may serve as the foundation for the possible future development of an intervention promoting optimal choice for younger population who are at higher risk for poor long-term outcomes.
Appendix
Example of the BRIC Task Data sheet (from Critchfield & Atteberry, 2003; Reed & Martens, 2011).
Note. Republished with permission from John Wiley & Sons.
Declarations
Conflict of interest
We have no known conflict of interest to disclose.
Ethical approval
We confirm that all procedures performed in studies involving human participants were in accordance with the ethical standards of the institutional and/or national research committee and with the 1964 Helsinki Declaration and its later amendments or comparable ethical standards.
Informed consent
The Teachers College, Columbia University IRB board reviewed and approved the study and noted that the informed consent process was not required as the study utilized secondary data.
Footnotes
Publisher's Note
Springer Nature remains neutral with regard to jurisdictional claims in published maps and institutional affiliations.
References
- Amlung M, Marsden E, Holshausen K, Morris V, Patel H, Vedelago L, Naish KR, Reed DD, McCabe RE. Delay discounting as a transdiagnostic process in psychiatric disorders: A meta-analysis. JAMA Psychiatry. 2019;76(11):1176–1186. doi: 10.1001/jamapsychiatry.2019.2102. [DOI] [PMC free article] [PubMed] [Google Scholar]
- Ashby JS, Schoon I, Webley P. Save now, save later? Linkages between saving behavior in adolescence and adulthood. European Psychologist. 2011;16(3):227–237. doi: 10.1027/1016-9040/a000067. [DOI] [Google Scholar]
- Binder LM, Dixon MR, Ghezzi PM. A procedure to teach self-control to children with attention deficit hyperactivity disorder. Journal of Applied Behavior Analysis. 2000;33(2):233–237. doi: 10.1901/jaba.2000.33-233. [DOI] [PMC free article] [PubMed] [Google Scholar]
- Cicchetti DV. Guidelines, criteria, and rules of thumb for evaluating normed and standardized assessment instruments in psychology. Psychological Assessment. 1994;6(4):284–290. doi: 10.1037/1040-3590.6.4.284. [DOI] [Google Scholar]
- Critchfield TS, Atteberry T. Temporal discounting predicts individual competitive success in a human analogue of group foraging. Behavioural Processes. 2003;64(3):315–331. doi: 10.1016/S0376-6357(03)00129-3. [DOI] [PubMed] [Google Scholar]
- Critchfield TS, Kollins SH. Temporal discounting: Basic research and the analysis of socially important behavior. Journal of Applied Behavior Analysis. 2001;34(1):101–122. doi: 10.1901/jaba.2001/34-101. [DOI] [PMC free article] [PubMed] [Google Scholar]
- Critchfield TS, Reed DD. What are we doing when we translate from quantitative models? The Behavior Analyst. 2009;32(2):339–362. doi: 10.1007/BF03392197. [DOI] [PMC free article] [PubMed] [Google Scholar]
- Daugherty JR, Brase GL. Taking time to be healthy: Predicting health behaviors with delay discounting and time perspective. Personality and Individual Differences. 2010;48(2):202–207. doi: 10.1016/j.paid.2009.10.007. [DOI] [Google Scholar]
- DeLeon IG, Chase JA, Frank-Crawford MA, Carreau-Webster AB, Triggs MM, Bullock CE, Jennett HK. Distributed and accumulated reinforcement arrangements: Evaluations of efficacy and preference. Journal of Applied Behavior Analysis. 2014;47(2):293–313. doi: 10.1002/jaba.116. [DOI] [PMC free article] [PubMed] [Google Scholar]
- DeLeon IG, Iwata BA. Evaluation of a multiple-stimulus presentation format for assessing reinforcer preferences. Journal of Applied Behavior Analysis. 1996;29(4):519–532. doi: 10.1901/jaba.1996.29-519. [DOI] [PMC free article] [PubMed] [Google Scholar]
- Dixon MR, Jacobs EA, Sanders S. Contextual control of delay discounting by pathological gamblers. Journal of Applied Behavior Analysis. 2006;39(4):413–422. doi: 10.1901/jaba.2006.173-05. [DOI] [PMC free article] [PubMed] [Google Scholar]
- Dixon MR, Tibbetts PA. The effects of choice on self-control. Journal of Applied Behavior Analysis. 2009;42(2):243–252. doi: 10.1901/jaba.2009.42-243. [DOI] [PMC free article] [PubMed] [Google Scholar]
- Dougherty DM, Charles NE, Mathias CW, Ryan SR, Olvera RL, Liang Y, Acheson A. Delay discounting differentiates pre-adolescents at high and low risk for substance use disorders based on family history. Drug and Alcohol Dependence. 2014;143(1):105–111. doi: 10.1016/j.drugalcdep.2014.07.012. [DOI] [PMC free article] [PubMed] [Google Scholar]
- Fienup DM, Ahlers AA, Pace G. Preference for fluent versus disfluent work schedules. Journal of Applied Behavior Analysis. 2011;44(4):847–858. doi: 10.1901/jaba.2011.44-847. [DOI] [PMC free article] [PubMed] [Google Scholar]
- Gilroy SP, Franck CT, Hantula DA. The discounting model selector: Statistical software for delay discounting applications. Journal of the Experimental Analysis of Behavior. 2017;107(3):388–401. doi: 10.1002/jeab.257. [DOI] [PubMed] [Google Scholar]
- Gioia, G. A., Isquith, P. K., Guy, S. C., & Kenworthy, L. (2015). Behavior Rating Inventory of Executive Function®, 2nd ed. (BRIEF®2). PAR Inc.
- Greer RD. A systems analysis of the behaviors of schooling. Journal of Behavioral Education. 1994;4(3):255–264. doi: 10.1007/BF01531981. [DOI] [Google Scholar]
- Hackenberg TD. Token reinforcement: A review and analysis. Journal of the Experimental Analysis of Behavior. 2009;91(2):257–286. doi: 10.1901/jeab.2009.91-257. [DOI] [PMC free article] [PubMed] [Google Scholar]
- Hackenberg TD. Token reinforcement: Translational research and application. Journal of Applied Behavior Analysis. 2018;51(2):393–435. doi: 10.1002/jaba.439. [DOI] [PubMed] [Google Scholar]
- Hackenberg TD, Vaidya M. Determinants of pigeons’ choices in token-based self-control procedures. Journal of the Experimental Analysis of Behavior. 2003;79(2):207–218. doi: 10.1901/jeab.2003.79-207. [DOI] [PMC free article] [PubMed] [Google Scholar]
- Hursh SR, Roma PG. Behavioral economics and the analysis of consumption and choice. Managerial and Decision Economics. 2016;37(4–5):224–238. doi: 10.1002/mde.2724. [DOI] [Google Scholar]
- Hyten C, Madden GJ, Field DP. Exchange delays and impulsive choice in adult humans. Journal of the Experimental Analysis of Behavior. 1994;62(2):225–233. doi: 10.1901/jeab.1994.62-225. [DOI] [PMC free article] [PubMed] [Google Scholar]
- Jahromi LB, Chen Y, Dakopolos AJ, Chorneau A. Delay of gratification in preschoolers with and without autism spectrum disorder: Individual differences and links to executive function, emotion regulation, and joint attention. Autism. 2019;23(7):1720–1731. doi: 10.1177/1362361319828678. [DOI] [PubMed] [Google Scholar]
- Jaroni JL, Wright SM, Lerman C, Epstein LH. Relationship between education and delay discounting in smokers. Addictive Behaviors. 2004;29(6):1171–1175. doi: 10.1016/j.addbeh.2004.03.014. [DOI] [PubMed] [Google Scholar]
- Kazdin AE, Bootzin RB. The token economy: An evaluative review. Journal of Applied Behavior Analysis. 1972;5(3):243–372. doi: 10.1901/jaba.1972.5-343. [DOI] [PMC free article] [PubMed] [Google Scholar]
- Kirby KN, Marakovic NN. Delay discounting probabilistic rewards: Rates decrease as amounts increase. Psychonomic Bulletin and Review. 1996;3(1):100–104. doi: 10.3758/BF03210748. [DOI] [PubMed] [Google Scholar]
- Mazur JE. An adjusting procedure for studying delayed reinforcement. In: Commons ML, Mazur JE, Nevin JA, Rachlin H, editors. Quantitative analyses of behaviour, the effect of delay and of intervening events on reinforcement value. Erlbaum; 1987. pp. 55–73. [Google Scholar]
- Miller JR. Comparing rapid assessments of delay discounting with real and hypothetical rewards in children. Journal of the Experimental Analysis of Behavior. 2019;111(1):48–58. doi: 10.1002/jeab.493. [DOI] [PubMed] [Google Scholar]
- Mischel W. Delay of gratification as process and as person variable in development. In: Magnusson D, Allen VP, editors. Human development: An interactional perspective. Academic Press; 1983. pp. 149–165. [Google Scholar]
- Mischel HN, Mischel W. The development of children’s knowledge of self-control strategies. Child Development. 1983;54(3):603–619. doi: 10.2307/1130047. [DOI] [Google Scholar]
- Mitchell SH. Measures of impulsivity in cigarette smokers and non-smokers. Psychopharmacology (berl) 1999;146(4):455–464. doi: 10.1007/pl00005491. [DOI] [PubMed] [Google Scholar]
- Motulsky HJ, Christopoulis A. Fitting models to biological data using linear and nonlinear regression: A practical guide to curve fitting. GraphPad Software; 2006. [Google Scholar]
- Myerson J, Green L. Discounting of delayed rewards: Models of individual choice. Journal of the Experimental Analysis of Behavior. 1995;64(3):263–276. doi: 10.1901/jeab.1995.64-263. [DOI] [PMC free article] [PubMed] [Google Scholar]
- Myerson J, Green L, Warusawitharana M. Area under the curve as a measure of discounting. Journal of the Experimental Analysis of Behavior. 2001;76(2):235–243. doi: 10.1901/jeab.2001.76-235. [DOI] [PMC free article] [PubMed] [Google Scholar]
- Odum AL. Delay discounting: I'm a k, you're a k. Journal of the Experimental Analysis of Behavior. 2011;96(3):427–439. doi: 10.1901/jeab.2011.96-423. [DOI] [PMC free article] [PubMed] [Google Scholar]
- Odum AL. Delay discounting: Trait variable? Behavioural Processes. 2011;87(1):1–9. doi: 10.1016/j.beproc.2011.02.007. [DOI] [PMC free article] [PubMed] [Google Scholar]
- Reed DD, Naudé GP, Gelino BW, Amlung M. Behavioral economic considerations of novel addictions and nonaddictive behaviour: Research and analytic methods. In: Sussman S, editor. Cambridge handbook of substance and behavioral addictions. Cambridge University Press; 2020. pp. 73–86. [Google Scholar]
- Reed DD, Niileksela CR, Kaplan BA. Behavioral economics: A tutorial for behavior analysts in practice. Behavior Analysis in Practice. 2013;6(1):34–54. doi: 10.1007/BF03391790. [DOI] [PMC free article] [PubMed] [Google Scholar]
- Reed DD, Martens BK. Temporal discounting predicts student responsiveness to exchange delays in a classroom token system. Journal of Applied Behavior Analysis. 2011;44(1):1–18. doi: 10.1901/jaba.2011.44-1. [DOI] [PMC free article] [PubMed] [Google Scholar]
- Reichow B, Barton EE, Maggin DM. Development and applications of the single-case design risk of bias tool for evaluating single-case design research study reports. Research in Developmental Disabilities. 2018;79:53–64. doi: 10.1016/j.ridd.2018.05.008. [DOI] [PubMed] [Google Scholar]
- Reynolds B. A review of delay-discounting research with humans: Relations to drug use and gambling. Behavioural Pharmacology. 2006;17(8):651–667. doi: 10.1097/FBP.0b013e3280115f99. [DOI] [PubMed] [Google Scholar]
- Richards JB, Zhang L, Mitchell SH, de Wit H. Delay or probability discounting in a model of impulsive behavior: Effect of alcohol. Journal of the Experimental Analysis of Behavior. 1999;71(2):121–143. doi: 10.1901/jeab.1999.71-121. [DOI] [PMC free article] [PubMed] [Google Scholar]
- Roane HS, Fisher WW, McDonough EM. Progressing from programmatic to discovery research: A case example with the overjustification effect. Journal of Applied Behavior Analysis. 2003;36(1):35–46. doi: 10.1901/jaba.2003.36-35. [DOI] [PMC free article] [PubMed] [Google Scholar]
- Schwartz IS, Baer DM. Social validity assessments: Is current practice state of the art? Journal of Applied Behavior Analysis. 1991;24(2):189–204. doi: 10.1901/jaba.1991.24-189. [DOI] [PMC free article] [PubMed] [Google Scholar]
- Sherraden MS, Johnson L, Guo B, Elliott W. Financial capability in children: Effects of participation in a school-based financial education and savings program. Journal of Family and Economic Issues. 2011;32(3):385–399. doi: 10.1007/s10834-010-9220-5. [DOI] [Google Scholar]
- Simonsen B, Fairbanks S, Briesch A, Myers D, Sugai G. Evidence-based practices in classroom management: Considerations for research to practice. Education and Treatment of Children. 2008;31(3):351–380. doi: 10.1353/etc.0.0007. [DOI] [Google Scholar]
- Snider SE, DeHart WB, Epstein LH, Bickel WK. Does delay discounting predict maladaptive health and financial behaviors in smokers? Health Psychology. 2019;38(1):21–28. doi: 10.1037/hea0000695. [DOI] [PMC free article] [PubMed] [Google Scholar]
- Sonuga-Barke, E., & Webley, P. (1993). Children’s saving: A study in the development of economic behavior. Routledge. https://doi-org.ezproxy.cul.columbia.edu/10.4324/9781315109824
- Staubitz JL, Lloyd BP, Reed DD. A summary of methods for measuring delay discounting in young children. The Psychological Record. 2018;68(2):239–253. doi: 10.1007/s40732-018-0292-1. [DOI] [Google Scholar]
- Staubitz JL, Lloyd BP, Reed DD. Effects of self-control training for elementary students with emotional and behavioral disorders. Journal of Applied Behavior Analysis. 2020;53(2):857–874. doi: 10.1002/jaba.634. [DOI] [PubMed] [Google Scholar]
- Steinberg L, Graham S, O’Brien L, Woolard J, Cauffman E, Banich M. Age differences in future orientation and delay discounting. Child Development. 2009;80(1):28–44. doi: 10.1111/j.1467-8624.2008.01244.x. [DOI] [PubMed] [Google Scholar]
- Strickland JC, Johnson MW. Rejecting impulsivity as a psychological construct: A theoretical, empirical, and sociocultural argument. Psychological Review. 2020 doi: 10.1037/rev0000263. [DOI] [PMC free article] [PubMed] [Google Scholar]
- Te'eni-Harari T. Financial literacy among children: The role of involvement in saving money. Young Consumers. 2016;17(2):197–208. doi: 10.1108/YC-01-2016-00579. [DOI] [Google Scholar]
- Vollmer TR, Borrero JC, Lalli JS, Daniel D. Evaluating self-control and impulsivity in children with severe behavior disorders. Journal of Applied Behavior Analysis. 1999;32(4):451–466. doi: 10.1901/jaba.1999.32-451. [DOI] [PMC free article] [PubMed] [Google Scholar]
- Ward-Horner JC, Pittenger A, Pace G, Fienup DM. Effects of reinforcer magnitude and distribution on preference for work schedules. Journal of Applied Behavior Analysis. 2014;47(3):623–627. doi: 10.1002/jaba.133. [DOI] [PubMed] [Google Scholar]
- Weller RE, Cook EW, III, Avsar KB, Cox JE. Obese women show greater delay discounting than healthy-weight women. Appetite. 2008;51(3):563–569. doi: 10.1016/j.appet.2008.04.010. [DOI] [PubMed] [Google Scholar]
- Yoon JH, Higgins ST. Turning k on its head: Comments on use of an ED50 in delay discounting research. Drug and Alcohol Dependence. 2008;95(1–2):169–172. doi: 10.1016/j.drugalcdep.2007.12.011. [DOI] [PMC free article] [PubMed] [Google Scholar]