Abstract
Since its discovery in inflammatory macrophages, itaconate has attracted much attention due to its antimicrobial and immunomodulatory activity1–3. However, instead of investigating itaconate itself, most studies used derivatized forms of itaconate and thus the role of non-derivatized itaconate needs to be scrutinized. Mesaconate, a metabolite structurally very close to itaconate, has never been implicated in mammalian cells. Here we show that mesaconate is synthesized in inflammatory macrophages from itaconate. We find that both, non-derivatized itaconate and mesaconate dampen the glycolytic activity to a similar extent, whereas only itaconate is able to repress tricarboxylic acid cycle activity and cellular respiration. In contrast to itaconate, mesaconate does not inhibit succinate dehydrogenase. Despite their distinct impact on metabolism, both metabolites exert similar immunomodulatory effects in pro-inflammatory macrophages, specifically a reduction of interleukin (IL)-6 and IL-12 secretion and an increase of CXCL10 production in a manner that is independent of NRF2 and ATF3. We show that a treatment with neither mesaconate nor itaconate impairs IL-1β secretion and inflammasome activation. In summary, our results identify mesaconate as an immunomodulatory metabolite in macrophages, which interferes to a lesser extent with cellular metabolism than itaconate.
Macrophages are fundamental components of innate immunity and play pivotal roles in both, the pro-inflammatory stage to combat infection, and the immunomodulatory stage to resolve inflammation and to restore tissue homeostasis4. Macrophage activation is accompanied by tightly controlled intracellular metabolic reprogramming in which the synthesis of the tricarboxylic acid (TCA) cycle-derived metabolite itaconate via the inducible enzyme aconitate decarboxylase 1 (ACOD1, also known as immune-responsive gene 1 protein, IRG1) is a hallmark1,5. Itaconate competitively inhibits succinate dehydrogenase (SDH) activity, mechanistically underlying the accumulation of succinate in lipopolysaccharide (LPS)-stimulated macrophages6–8. Surprisingly, itaconate has recently also been spotlighted as a novel modulator of macrophage immune responses. The anti-inflammatory properties of itaconate were first observed in IRG1-deficient macrophages in which inflammatory cytokines were increased9. Dimethyl itaconate (DMI) and 4-octyl-itaconate (4-OI), chemically esterified derivatives of itaconate with presumably higher intracellular delivery efficiency, potently reduced secretion of IL-1β, IL-6, IL-10 and IL-12p70 as well as nitric oxide and reactive oxygen species production in LPS-stimulated mouse macrophages2,9. Mechanistically, DMI and 4-OI alkylate reactive thiol groups of multiple targets including KEAP1, ATF3, GAPDH and aldolase A, all leading to reduced inflammatory responses in macrophages2,3,10,11. However, a concern that these derivatives may act differently is emerging, because DMI and 4-OI cannot be metabolized to itaconate in macrophages2,12 and both derivatives display much stronger electrophilicity than itaconate2,13. Recent studies even suggest that itaconate may inhibit inflammasome activation and IL-1β secretion13,14. Despite these findings, the immunometabolic role of non-derivatized itaconate in macrophages is still enigmatic.
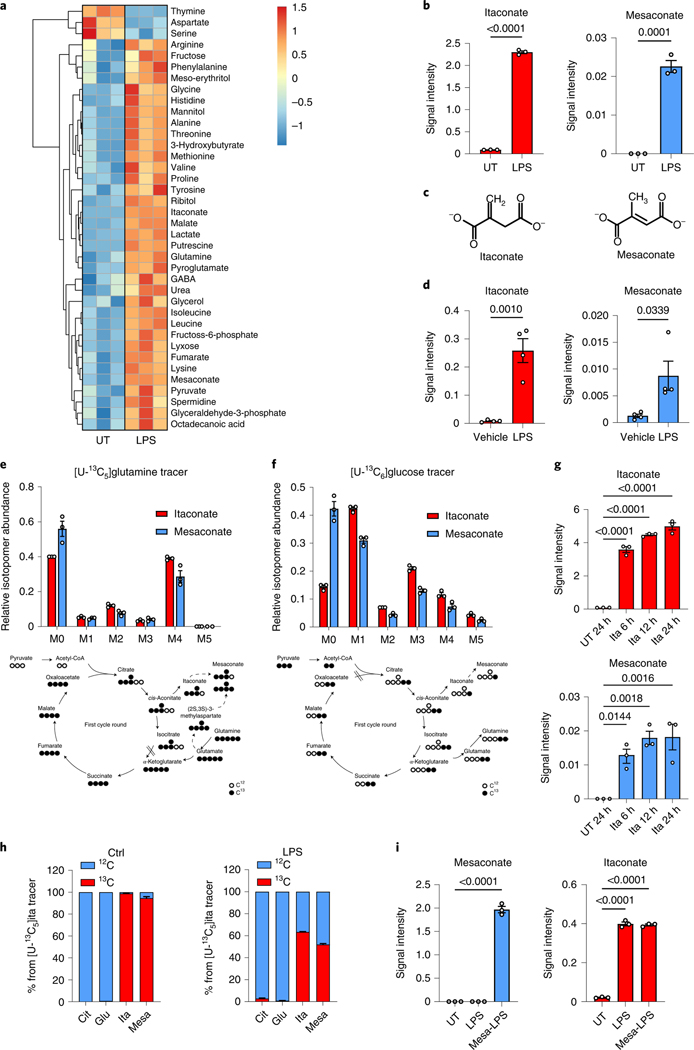
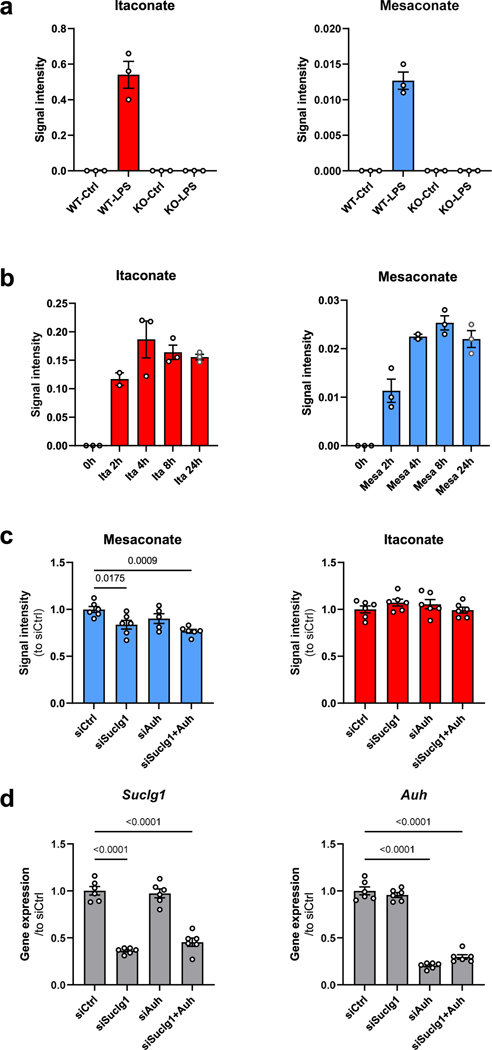
To investigate metabolic changes during macrophage activation, we performed a non-targeted metabolomics analysis of LPS-stimulated mouse macrophage RAW264.7 cells, in which we noticed a strong induction of mesaconate by LPS (Fig. 1a,b). Mesaconate is an isomer of itaconate, and differs in the position of one proton and the double bond (Fig. 1c). Although the intracellular concentration of mesaconate was much lower than that of itaconate, we were astonished by its LPS-dependent synthesis pattern. Further, we observed mesaconate production in mouse peritoneal cells (containing macrophages and infiltrating monocytes15) after intraperitoneal injection of LPS (Fig. 1d). A previous study described synthesis of mesaconate from glutamate in Escherichia coli via 3-methylaspartate16. To test this pathway in mammalian macrophages, we applied a fully 13C-enriched uniformly labelled 13C [U-13C]glutamine tracer in LPS-stimulated RAW264.7 cells and determined mass isotopomer distributions of downstream metabolites. Surprisingly, fully labelled mesaconate (M5) was absent (Fig. 1e), indicating mesaconate was not synthesized via 3-methylaspartate in macrophages. Instead, we observed M4 and M2 mass isotopomers of mesaconate, suggesting mesaconate synthesis from glutamine via the TCA cycle and itaconate metabolism (Fig. 1e). In support, the mass isotopomer distribution of mesaconate was very similar to that of itaconate, except that itaconate was slightly higher enriched (Fig. 1e), providing evidence that itaconate is the precursor of mesaconate. To further validate this, we applied a [U-13C]glucose tracer in LPS-stimulated RAW264.7 cells and mesaconate again displayed a similar enrichment pattern as itaconate and all isotopomer abundances (M1–M5) were lower than those of itaconate (Fig. 1f). Given that IRG1 catalyses itaconate synthesis from cis-aconitate1, we used IRG1-deficient mice and observed neither itaconate nor mesaconate production in bone marrow-derived macrophages (BMDMs; Extended Data Fig. 1a), supporting a precursor role of itaconate for mesaconate. To better understand the metabolic conversion of itaconate and mesaconate, we also supplemented exogenous itaconate to the culture of resting macrophages. Consistent with our previous study6, itaconate permeabilized into mouse macrophages efficiently (Fig. 1g and Extended Data Fig. 1b). Concomitantly, mesaconate appeared in a similar pattern after the exogenous application of itaconate (Fig. 1g), indicating synthesis from the itaconate taken up by the cells. Intriguingly, LPS stimulation was dispensable for an intracellular conversion of itaconate to mesaconate, implying independence of this metabolic pathway on a previous macrophage activation. Finally, we applied a U-13C-labelled itaconate tracer to confirm this biosynthetic pathway. Mesaconate was almost fully labelled in resting RAW264.7 cells (Fig. 1h), suggesting its generation from the itaconate tracer. We observed reduced enrichment in both itaconate and mesaconate after LPS stimulation (Fig. 1h), due to endogenously produced unlabelled itaconate/mesaconate. Based on these observations, we speculated a biochemical pathway via itaconyl-CoA and mesaconyl-CoA, catalysed by succinyl-CoA ligase and methylglutaconyl-CoA hydratase, as proposed by Nemeth et al.7. To validate this, we silenced both genes (Suclg1 and Auh) and observed a reduction of LPS-induced mesaconate accumulation (Extended Data Fig. 1c,d). The only partial reduction in mesaconate synthesis might be associated with the high abundance of Suclg1 expression, linked to its essential role in TCA cycle. Nevertheless, we cannot rule out the existence of an unknown isomerase directly converting itaconate to mesaconate. Next, we added mesaconate to the cell culture and observed an efficient uptake of mesaconate into RAW264.7 cells (Fig. 1i). Notably, we did not observe any increase of itaconate in mesaconate-treated cells, suggesting that the mesaconate taken up by the cells was not metabolized into itaconate (Fig. 1i). In summary, the above results demonstrate that mesaconate is synthesized from itaconate in a unidirectional manner in macrophages.
Fig. 1 |. Mesaconate is endogenously synthesized from itaconate in macrophages.
a, Non-targeted intracellular metabolome of mouse macrophage RAW264.7 cells in the absence or presence of 10 ng ml−1 LPS for 24 h. b, Signal intensity of intracellular itaconate and mesaconate in RAW264.7 cells. c, Chemical structure of itaconate and mesaconate. d, Intracellular levels of both metabolites in peritoneal cells isolated from mice intraperitoneally injected with 1 mg per kg body weight of LPS for 24 h. e,f, Mass isotopomer distribution of itaconate and mesaconate in RAW264.7 cells incubated with [U-13C5]glutamine (e) or [U-13C6]glucose (f) tracer for 24 h. Atom transitions for TCA cycle metabolites and potential mesaconate biosynthesis are indicated below. g, Intracellular levels of itaconate and mesaconate in RAW264.7 cells treated with 10 mM exogenous itaconate at the indicated time points. h, Carbon contribution of supplemented [U-13C5]itaconate to intracellular itaconate and mesaconate and mass isotopomer distribution of both metabolites in RAW264.7 cells incubated with [U-13C5]itaconate tracer for 24 h in the absence or presence of LPS. i, Intracellular levels of itaconate and mesaconate in RAW264.7 cells pretreated with 10 mM exogenous mesaconate for 4 h before 3 h LPS stimulation. Data are presented as a representative heat map showing z-scores of the data by row, from three independent experiments (a), the mean ± s.e.m. calculated from (b and e–i) n = 3 biological independent replicates from a representative experiment of two (e–g and i) or three (b and h) independent experiments or (d) n = 4 mice. UT, untreated control. P values were calculated by one-way analysis of variance (ANOVA) with Dunnet’s post hoc test (g and i) or unpaired t-test (b and d) and overlayed on respective comparisons.
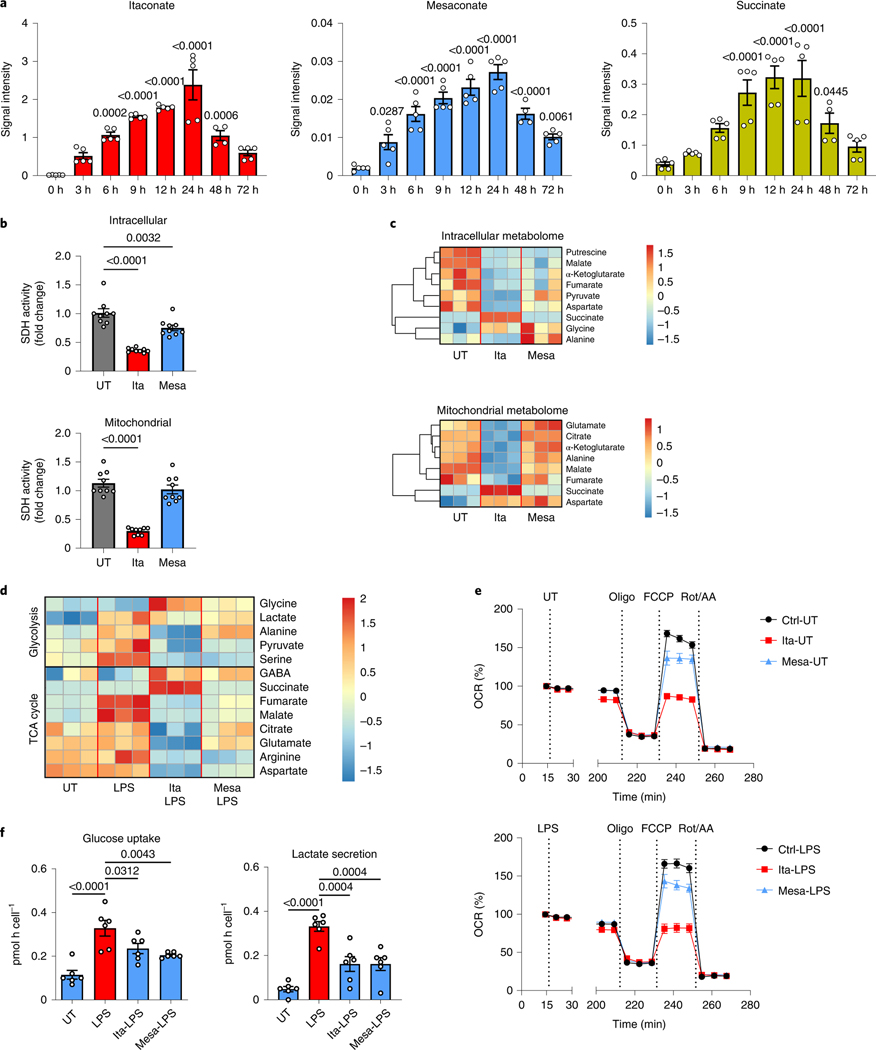
To study the dynamics of LPS-stimulated itaconate and mesaconate production and to estimate their effects on SDH activity, we recorded a time course of intracellular metabolites in macrophages. Both itaconate and mesaconate exhibited a similar synthesis pattern, indicating a rapid conversion of itaconate into mesaconate (Fig. 2a). Previously, we and others demonstrated that itaconate competitively inhibits SDH activity, leading to succinate accumulation6,8,9. In consistency, succinate accumulated in an itaconate-dependent manner (Fig. 2a). To investigate if mesaconate impairs SDH activity as well, we performed 13C-isotope tracing in RAW264.7 cells to inspect SDH activity by evaluating the ratio of M4 fumarate and M4 succinate mass isotopomers. As expected, itaconate markedly reduced SDH activity, both in whole cells and in fractionated mitochondria (Fig. 2b). However, this was barely seen in mesaconate-treated whole cells and not at all in mitochondria, exhibiting inability of mesaconate to inhibit SDH activity.
Fig. 2 |. impact of mesaconate and itaconate on macrophage metabolism.
a, Intracellular levels of itaconate, mesaconate and succinate in RAW264.7 cells stimulated with 10 ng ml−1 LPS for the indicated periods. b,c, Intracellular and mitochondrial SDH activities (b) and metabolomes (c) of RAW264.7 cells incubated with 10 mM itaconate or mesaconate for 6 h. d, Intracellular metabolome of RAW264.7 cells pretreated with 10 mM itaconate or mesaconate for 4 h before 3 h LPS stimulation. e, Oxygen consumption rate (OCR) of RAW264.7 cells pretreated with 10 mM itaconate or mesaconate for 4 h before 3 h LPS stimulation, followed by a sequential addition of oligomycin (Oligo), FCCP and rotenone plus antimycin A (Rot/AA). All values were normalized to the measurement time point 1 (immediately before LPS injection) of each well. Unnormalized results are shown in Extended Data Fig. 2b,c. f, Glucose uptake and lactate secretion of mouse BMDMs pretreated with 10 mM itaconate or mesaconate for 4 h before 21 h LPS stimulation. Data are shown as the mean ± s.e.m. calculated from n = 5 biological replicates from two independent experiments (a; except n = 4 for 48 h), n = 9 biological replicates from three independent experiments (b) or n = 6 mice from five independent experiments (f); a representative heat map showing z-scores of the data by row, from three independent experiments (c and d); and the mean ± s.e.m. calculated from n = 10 biological replicates from a representative result of three independent experiments (e). P values were calculated by one-way ANOVA with Dunnet’s post hoc test and overlayed on respective comparisons.
To examine the metabolic impact of both metabolites, we added 10 mM itaconate (reported itaconate concentration in activated macrophages1) or mesaconate to the culture medium of macrophages, and profiled intracellular and mitochondrial metabolism. In resting RAW264.7 cells, itaconate supplementation reduced a number of TCA cycle metabolites (α-ketoglutarate, malate and fumarate), while succinate was increased, in accordance with our previous findings6,17 (Fig. 2c). All these effects were potentiated in the mitochondrial metabolome, suggesting that the metabolic impact of itaconate mainly occurs in mitochondria. Mesaconate treatment resulted in a weaker reduction of intracellular TCA cycle metabolites and showed almost no effect on mitochondrial metabolites when compared to itaconate (Fig. 2c). Of note, mesaconate induced succinate accumulation neither in whole cells nor in mitochondria. This indicated again that mesaconate does not inhibit SDH activity.
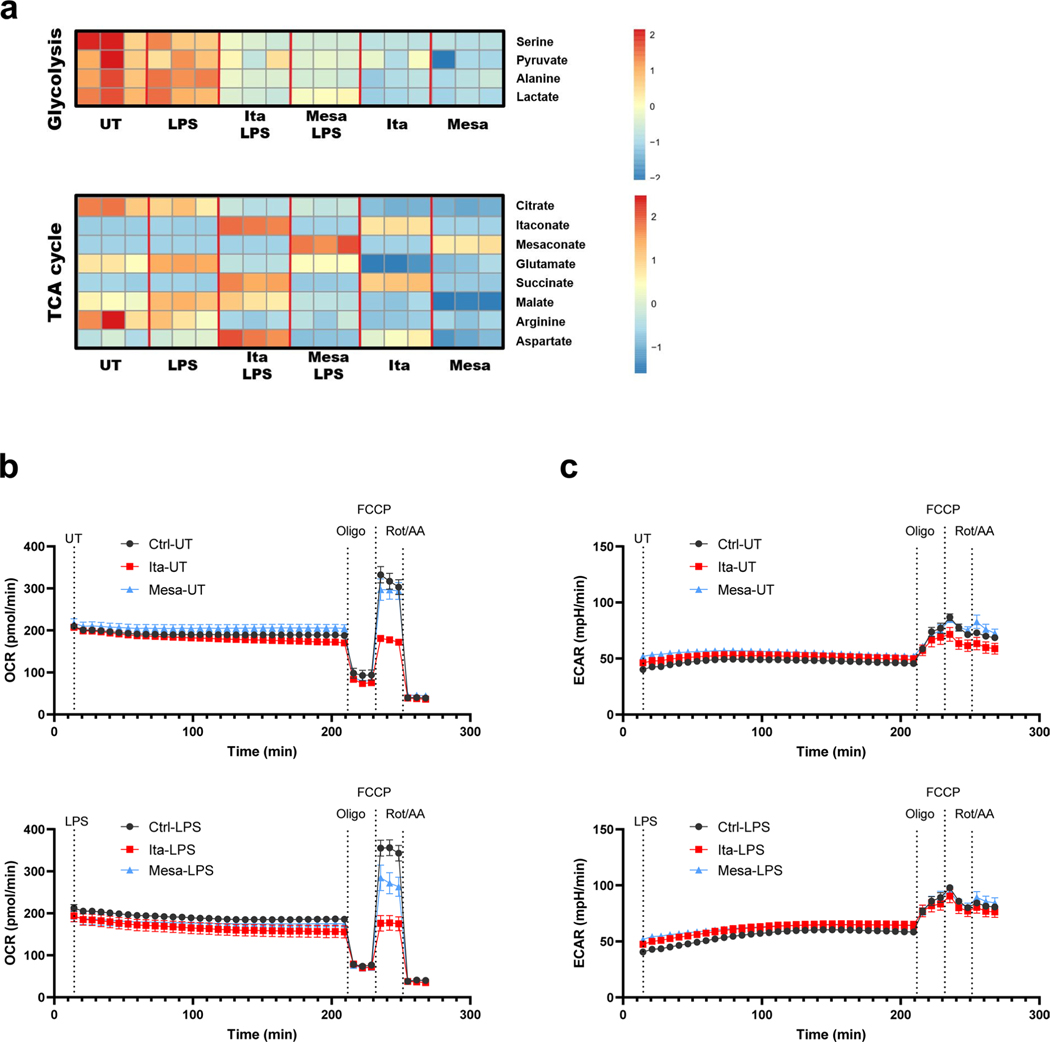
Increased glycolysis and a reprogrammed TCA cycle characterize the metabolic adaptation of inflammatory macrophages5. In LPS-activated RAW264.7 cells, the levels of glycolytic intermediates including pyruvate, lactate and serine were reduced by both itaconate and mesaconate (Fig. 2d). Interestingly, alanine was decreased by itaconate and unchanged by mesaconate, indicating again that itaconate affects mainly mitochondrial metabolism. TCA cycle metabolites (citrate, malate, fumarate, glutamate and aspartate) were potently reduced by itaconate but only moderately attenuated by mesaconate (Fig. 2d). Again, succinate only accumulated in itaconate-treated cells, which was also observed in primary human macrophages (Extended Data Fig. 2a). To profile dynamic effects of both metabolites on oxidative phosphorylation and cellular respiration, we pretreated RAW264.7 cells with itaconate and mesaconate for 4 h and then injected LPS in a Seahorse biochemical analyser. In line with the metabolomics result, itaconate potently inhibited respiration, while mesaconate only exerted a slight inhibition (Fig. 2e). Because RAW264.7 cells are of cancerous origin and such cells are characterized by a high glycolytic activity to maintain proliferation, we further examined the inhibiting effects of itaconate and mesaconate on glycolysis in primary mouse BMDMs. Both itaconate and mesaconate are permeable to BMDMs (Extended Data Fig. 1b) and they attenuated LPS-induced glucose uptake and lactate secretion (Fig. 2f) to a similar extent. In summary, both itaconate and mesaconate inhibited glycolysis, whereas they manifested distinct impacts on TCA cycle and cellular respiration.
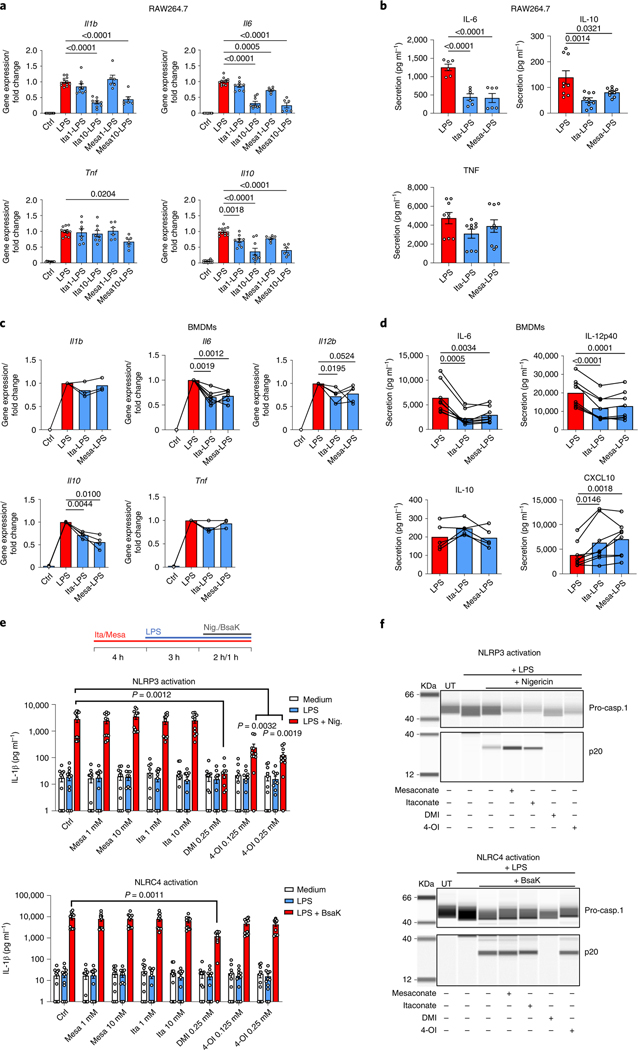
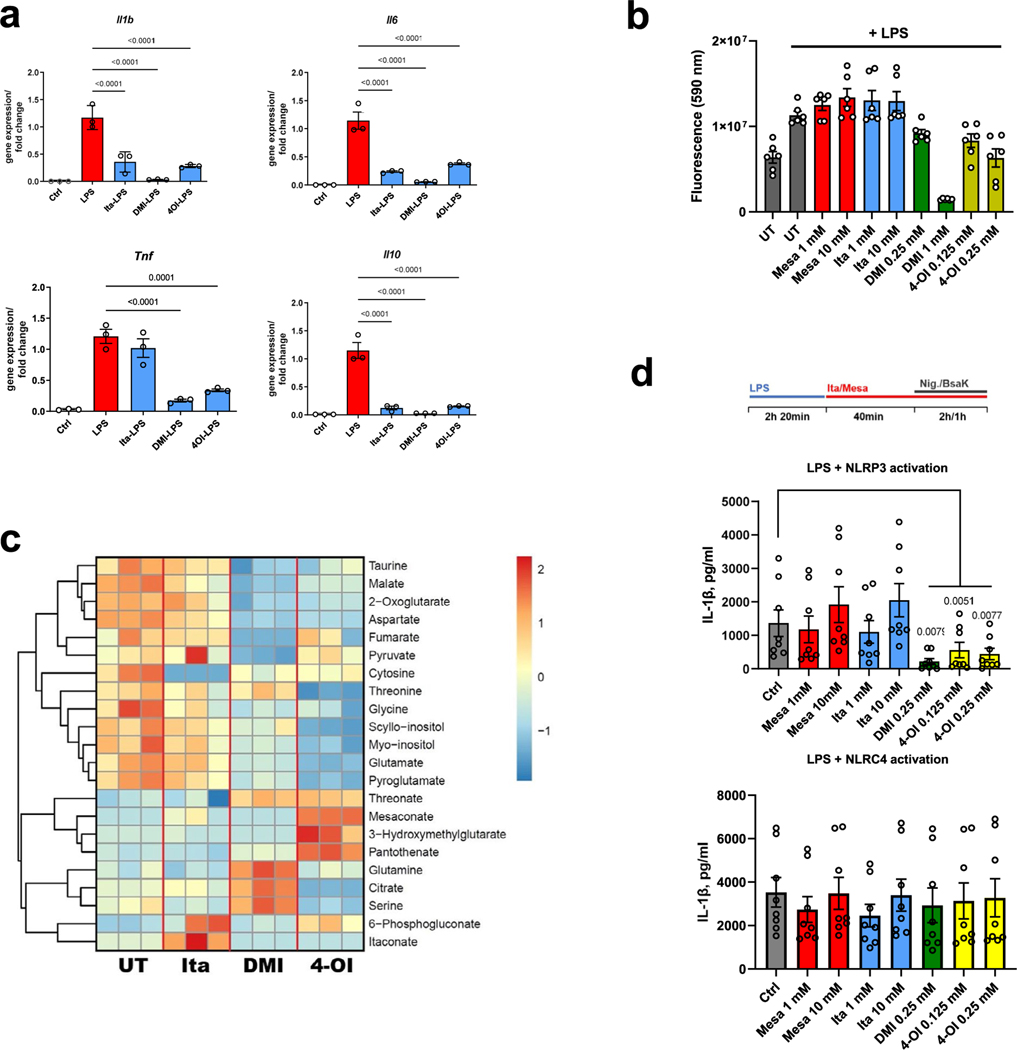
The itaconate derivatives DMI and 4-OI have been demonstrated to be anti-inflammatory in macrophages2,3,18. Recently, Swain et al. showed that itaconate also inhibited IL-1β secretion13. We next tried to verify itaconate’s anti-inflammatory effects and to explore if mesaconate exhibits similar effects. Pretreatment of RAW264.7 cells with 10 mM itaconate or mesaconate reduced LPS-induced expression of Il1b, Il6 and Il10 (Fig. 3a) and secretion of IL-6 and IL-10 (Fig. 3b). DMI and 4-OI additionally reduced Tnf expression (Extended Data Fig. 3a). Notably, DMI and 4-OI tended to be more toxic to the cells (Extended Data Fig. 3b). With an intracellular metabolomics analysis, we found no itaconate production at all following application of 1 mM DMI and 4-OI in RAW264.7 cells (Extended Data Fig. 3c). Indeed, DMI and 4-OI exerted a much more drastic impact on intracellular metabolites than itaconate when all these metabolites were applied at the same concentration (Extended Data Fig. 3c), which might be associated with their high toxicity. Hence, our results manifest that mesaconate has an anti-inflammatory effect equal to non-derivatized itaconate in RAW264.7 cells, and argue against the previous hypothesis that itaconate derivatives act similarly as itaconate in terms of their metabolic or immunomodulatory effects.
Fig. 3 |. Both non-derivatized itaconate and mesaconate are immunomodulatory in macrophages.
a,b, Cytokine expression (a) and secretion (b) of RAW264.7 cells pretreated with 10 mM itaconate or mesaconate for 4 h before 3 h (a) or 21 h (b) of LPS stimulation. c,d, Cytokine expression (c) and secretion (d) of BMDMs pretreated with 10 mM itaconate or mesaconate for 4 h before 3 h (c) or 21 h (d) LPS stimulation. e, IL-1β in supernatants of BMDMs treated with indicated concentrations of mesaconate, itaconate, DMI or 4-OI, LPS stimulation as well as NLRP3 or NLRC4 inflammasome activation with nigericin (10 μM) or a mixture of BsaK (100 ng ml−1) and protective antigen (1 μg ml−1), respectively, following a pretreatment protocol as indicated. f, Western blots of pro-caspase-1 and cleaved caspase-1 (p20) in supernatants of BMDMs treated as in e. Data are presented as: the mean ± s.e.m. calculated from n = 12 (Ctrl, LPS), 9 (Ita1/10) or 6 (Mesa1/10) biological replicates pooled from three independent experiments (a); the mean ± s.e.m. calculated from n = 6 (IL-6) or 9 (IL-10 and TNF) biological replicates pooled from two to three independent experiments (b); the mean with overlayed data of individual mice pooled from n = 3–8 mice (each data point represent a mouse) from at least two independent experiments, and conditions from individual mice are connected with a line (c and d); the mean ± s.e.m. calculated from n = 11 mice from four independent experiments (e); representative images are from three independent experiments (f). P values were calculated by one-way ANOVA with Dunnet’s post hoc test (a, b and e) or paired t-test (paired by each mouse; c and d) and overlayed on respective comparisons.
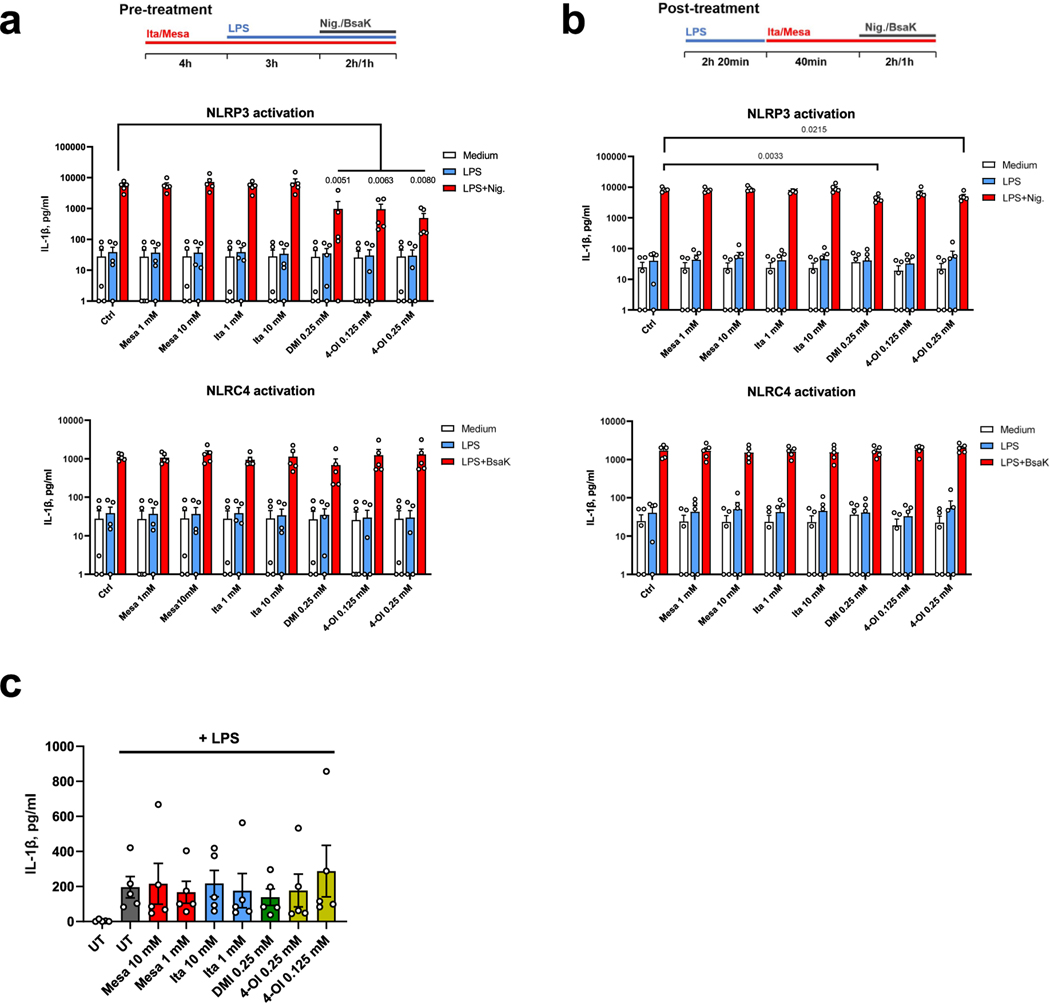
We next attempted to validate the anti-inflammatory effects of itaconate and mesaconate in mouse BMDMs. Expression of LPS-induced Il6, Il10 and Il12b, and secretion of IL-6 and IL-12p40 were all reduced by pretreatment with itaconate or mesaconate (Fig. 3c,d). Unlike in RAW264.7 cells, Il1b expression was unaffected in BMDMs (Fig. 3c). To validate if itaconate or mesaconate impairs inflammasome activation and thus decreases IL-1β secretion, we additionally treated BMDMs with nigericin or BsaK to activate the NLRP3 or NLRC4 inflammasome, respectively19,20. Interestingly, pretreatment with itaconate or mesaconate did not reduce IL-1β secretion in BMDMs treated with nigericin or BsaK (Fig. 3e). In agreement with aforementioned studies13,14,18, both DMI and 4-OI reduced IL-1β secretion after NLRP3 activation with nigericin. In addition, we found DMI but not 4-OI diminished IL-1β release following NLRC4 activation (Fig. 3e). Concomitantly, both itaconate derivatives abrogated caspase-1 cleavage, a marker of inflammasome activation, while non-derivatized itaconate and mesaconate did not (Fig. 3f). We also adopted a post-treatment protocol18, in which LPS priming was performed before the addition of both metabolites. Whereas DMI and 4-OI again inhibited NLRP3 inflammasome-dependent IL-1β secretion, itaconate and mesaconate remained unable to impair IL-1β secretion (Extended Data Fig. 3d). As DMI and 4-OI are designed for enhanced cellular permeability, a relatively lower entry rate of itaconate (and possibly mesaconate) might account for the observed ineffectiveness. We also investigated human monocyte-derived macrophages (MDMs) and whole blood, where neither itaconate nor mesaconate reduced IL-1β secretion (Extended Data Fig. 4a–c). Swain et al. have shown that itaconate increases LPS-induced interferon (IFN)-β production in mouse macrophages13, but we could not determine any secreted IFN-β in the medium of LPS-treated BMDMs. Instead, LPS-induced CXCL10 secretion was elevated by both itaconate and mesaconate (Fig. 3d). As CXCL10 is a chemokine downstream of the IFN-β signalling pathway, it is possible that IFN-β was produced but in levels below our detection limit.
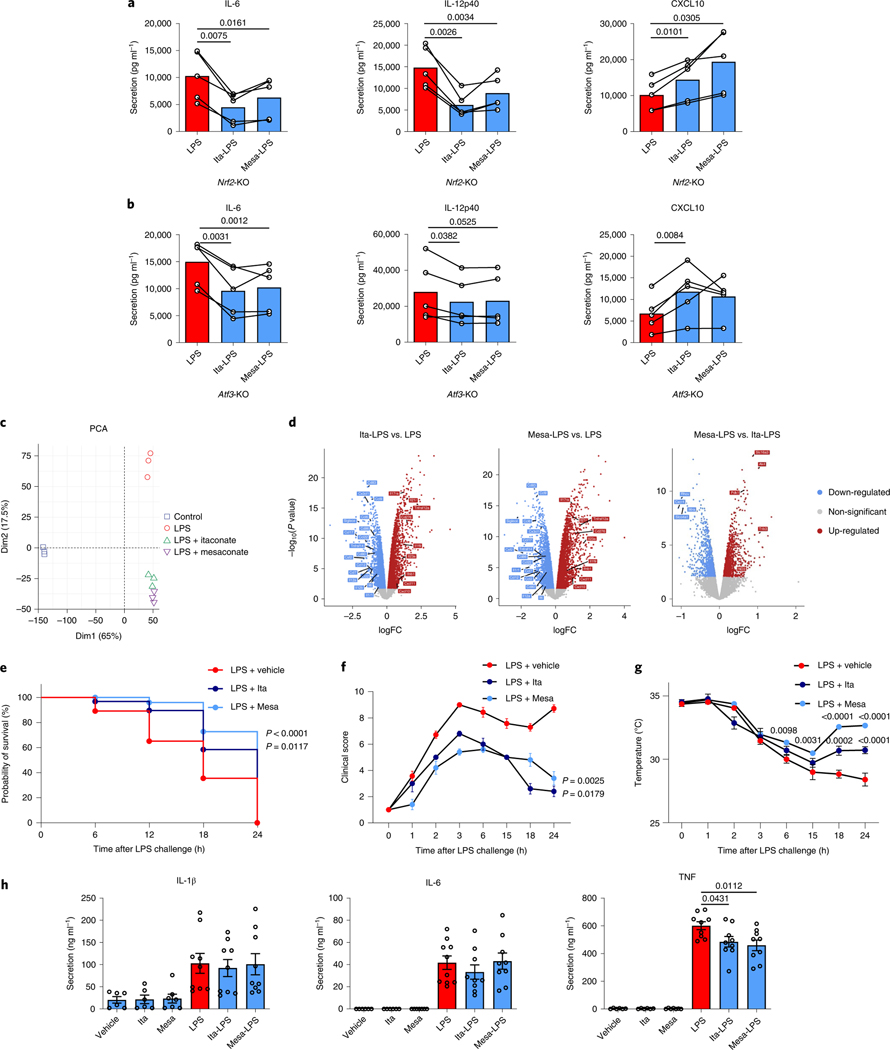
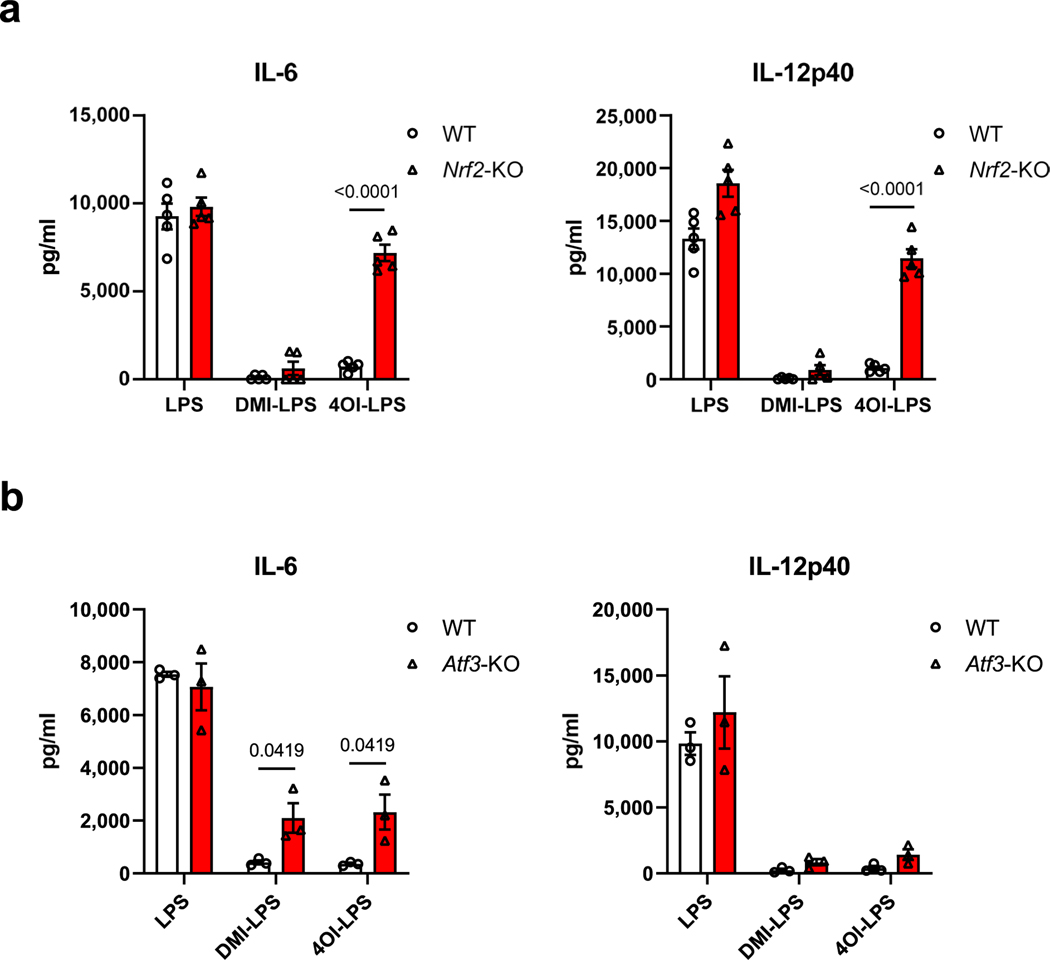
Mills et al. demonstrated that the effects of 4-OI on cytokine production are NRF2 dependent2, whereas Swain et al. argued that non-derivatized itaconate has a milder electrophilicity insufficient to alkylate KEAP1 and thus unable to activate NRF2 (ref. 13). To determine the NRF2 dependency of itaconate and mesaconate for cytokine production, we replicated our experiments in NRF2-deficient BMDMs. Both metabolites still reduced the secretion of IL-6 and IL-12p40 and increased CXCL10 secretion in NRF2-deficient BMDMs (Fig. 4a), disfavouring an NRF2 dependency. In agreement with Mills et al.2, we confirmed that the anti-inflammatory effect of 4-OI is indeed dependent on NRF2 (Extended Data Fig. 5a). Because Bambouskova et al. demonstrated an IκBζ–ATF3-dependent mechanism of DMI to reduce IL-6 secretion3, we next attempted to investigate its applicability to the non-derivatized itaconate or mesaconate. In ATF3-deficient BMDMs, the effects of both metabolites on cytokine production were unaltered (Fig. 4b). Consistent with Bambouskova et al.3, we observed a partial dependence of DMI and 4-OI on ATF3 to reduce IL-6 secretion (Extended Data Fig. 5b). Hence, we conclude that neither itaconate nor mesaconate are dependent on NRF2 or ATF3 for their immunomodulatory mechanism. The moderate electrophilicity of both metabolites is likely to underlie this discrepancy because DMI and 4-OI exhibit a much higher electrophilicity.
Fig. 4 |. itaconate and mesaconate modulate cytokine production in NRF2- and ATF3-deficient macrophages, and protect mice from LPs-induced sepsis.
a,b, Cytokine secretion of Nrf2-knockout (KO) (a) and Atf3-KO (b) BMDMs pretreated with 10 mM itaconate or mesaconate for 4 h before LPS stimulation for 21 h. c,d, Transcriptomic analysis with PCA (c) and volcano plots (d) of RNA-seq data from wild-type BMDMs pretreated with 10 mM itaconate or mesaconate for 4 h before 10 ng ml−1 LPS stimulation for 3 h. e–h, Itaconate and mesaconate protect from LPS-induced sepsis: survival curve (e), clinical score (f), body temperature (g) and plasma cytokines (h) in mice intraperitoneally injected with 250 mg per kg body weight itaconate or mesaconate for 2 h, followed by 30 mg (e) or 2.5 mg (f–h) per kg body weight LPS for 24 h. Data are presented as: a,b, the mean with data of individual mice from n = 5 mice (each data point represents a mouse) from two (a) or three (b) independent experiments, and conditions from individual mice are connected with a line; the relative distribution of overall transcriptome of different groups (c); x axis for the log-fold change (logFC) between two groups, y axis for the P value of corresponding comparisons, and the colouring is generic for P < 0.05 (d); probability of survival calculated from n = 20 mice per group, a representative result from two independent experiments (e); the mean ± s.e.m. was calculated from n = 7 mice for LPS + vehicle, n = 5 mice for LPS + itaconate/mesaconate, representative from three independent experiments (f and g); the mean ± s.e.m. calculated from n = 6 mice for no-LPS conditions and n = 9 mice for LPS conditions, pooled from two independent experiments (h). P values were calculated by paired t-test (paired by each mouse; a and b), an exact test based on the dispersion generated by the quantile-adjusted conditional maximum likelihood (qCML) method (d), curve comparison with log-rank (Mantel–Cox) test (e), one-way ANOVA with Dunnet’s post hoc test (f for curve mean and h) or two-way ANOVA with Dunnet’s post hoc test (g) and overlayed on respective comparisons.
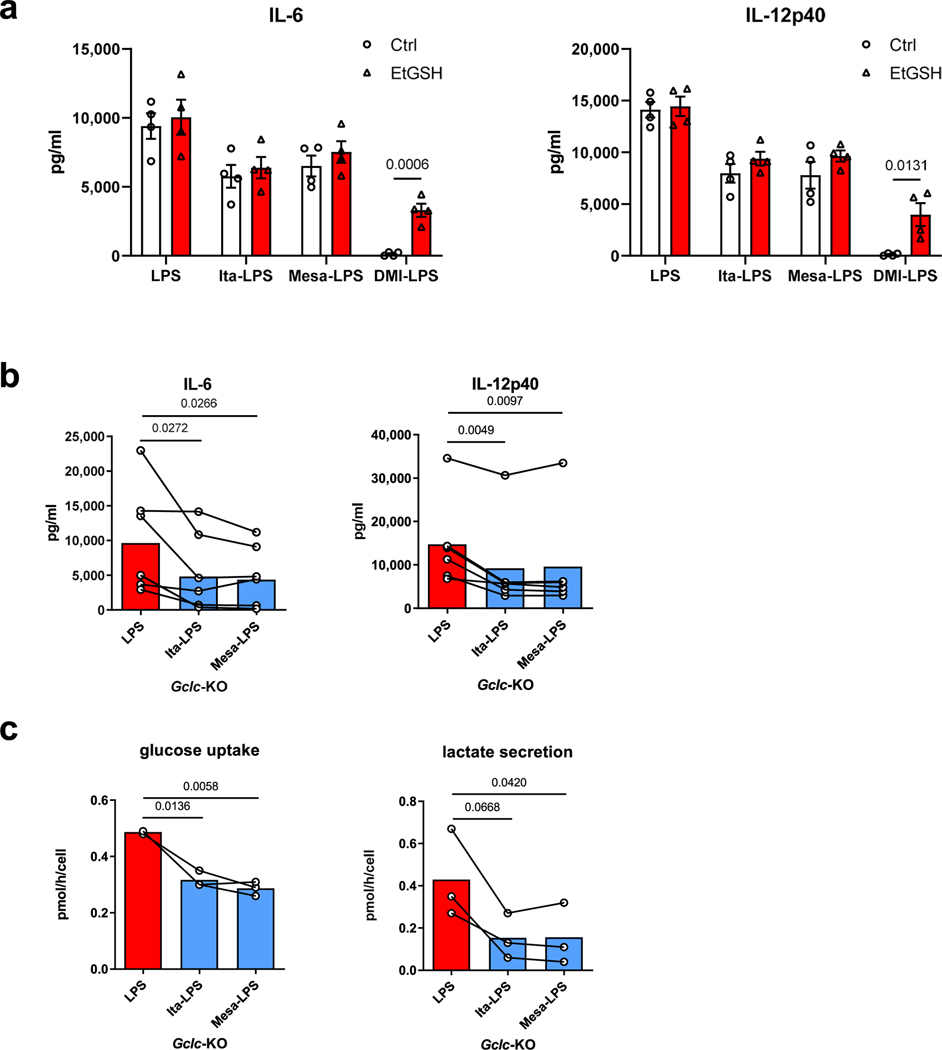
It was reported that itaconate and DMI bind to glutathione (GSH), which is able to buffer intracellular electrophilic stress3. Therefore, we wondered if intracellular GSH is involved in the immunomodulatory ability of itaconate and mesaconate. We first treated BMDMs with DMI, itaconate and mesaconate, in the presence or absence of cellular permeable GSH (EtGSH). Whereas we confirmed that EtGSH neutralizes the inhibitory effects of DMI on cytokine release, it didn’t impact the immunomodulatory effect of itaconate and mesaconate (Extended Data Fig. 6a). Next, we used Gclc-knockout BMDMs in which GSH production is absent. We observed unaltered effects of itaconate or mesaconate on IL-6 and IL-12p40 secretion as well as on glucose uptake and lactate secretion (Extended Data Fig. 6b,c), implying GSH is not involved in the immunomodulatory mechanism of both metabolites.
To obtain a more comprehensive view of the impact of itaconate and mesaconate on macrophages, we performed RNA-sequencing (RNA-seq) analysis. A principal-component analysis (PCA) revealed a high-degree of transcriptomic similarity of BMDMs pretreated with itaconate and mesaconate compared to BMDMs stimulated with LPS alone (Fig. 4c). Both itaconate and mesaconate decreased the expression of most chemokines and a variety of cytokines, along with a potential to attenuate antigen presentation and T cell stimulation (Fig. 4d). Both metabolites also increased the expression of Cxcl10, Ifnb1, Il23a and Il17ra (Fig. 4d), supportive of the immunomodulatory concept rather than simply anti-inflammatory, and the idea of an enhanced IFN-β–CXCL10 pathway.
Given the potent immunomodulatory effects of non-derivatized itaconate and mesaconate, we asked whether these compounds are protective in a septic model. C57BL/6J mice administered with either metabolite 2 h before intraperitoneal injection of LPS exhibited a prolonged survival (Fig. 4e), a decreased clinical score (Fig. 4f) and an improved temperature regulation (Fig. 4g). Plasma TNF levels were reduced by both metabolites (Fig. 4h), inferring attenuated systemic inflammation.
In summary, we discovered that itaconate serves as the precursor for the biosynthesis of mesaconate in mouse macrophages, eliciting the investigation of mesaconate as a new immunometabolite. We further revealed that mesaconate differs to itaconate to affect TCA cycle and cellular respiration, whereas both share similar anti-glycolytic and immunomodulatory effects in pro-inflammatory macrophages (Extended Data Table 1). Because our results disfavour an implication of NRF2 or ATF3 in the immunomodulatory mechanism of itaconate and mesaconate, further studies are required to identify the intracellular target(s) of both metabolites. A substantial role of SDH can be ruled out as well, as mesaconate does not inhibit this enzyme. In a concurrent study, Chen et al. observed mesaconate accumulation in stimulated human macrophages21. The authors also demonstrated a decrease in cytokine production by itaconate, mesaconate and another itaconate isomer, citraconate, in influenza virus-infected macrophages, supporting the immunomodulatory roles of all these itaconate isomers.
Mesaconate is equally efficient to itaconate in terms of immunomodulatory effects, while it has less disturbance on the TCA cycle and cellular respiration, making it superior to itaconate regarding its therapeutic potential. This is further supported by the stronger protection of mesaconate against endotoxaemia. In light of the success of dimethyl fumarate, a metabolite approved for treatment of the chronic autoimmune diseases multiple sclerosis and psoriasis22,23, applications of mesaconate as an alternative treatment could be of high potential.
Methods
Experimental animals.
Nrf2−/− mice were purchased from The Jackson Laboratory (017009) and maintained in the animal facility at Department of Biomedicine, Aarhus University. Atf3−/− mice were obtained from T. Hai24 and maintained in the animal facility at the University of Tübingen. The Acod1−/− (also known as Irg1−/−) mice were generated by H. Koseki at the RIKEN Institute using stem cells purchased from the Knockout Mouse Project Repository (Irg1tm1a(KOMP)Wtsi; ref. 6) and maintained in the specific pathogen-free (SPF) facility of the University of Luxembourg. C57BL/6J mice were purchased from Charles River and served as wild-type controls for all three strains of knockout mice in the respective facilities. Gclcfl/fl mice were generated as described in work by ref. 25 and crossed with Lyz2-Cre-expressing mice (also known as LysMcre mice, obtained from P. Lang and were originally described by Clausen et al.26) to create myeloid-specific Gclc-deficient mice in the SPF facility of the Luxembourg Institute of Health, and Gclcfl/fl mice served as the control mice. For the in vivo LPS-induced septic model, C57BL/6J mice purchased from Janvier were maintained in the animal facilities of the University of Bonn and the in vivo experimental procedures were approved by the Animal Ethics Committee of the state of North Rhine-Westphalia, Germany. The LPS-induced septic model was also independently reproduced in Luxembourg Institute of Health under the approval from ‘Ministère de l’Agriculture, de la Viticulture et du Développement rural’ from the Luxembourg government. All mice were maintained in accordance with animal guidelines from local and university authorities, under specific pathogen-free conditions, 20–22 °C, 40–60% humidity and a 12-h light-dark cycle, and all experiments used 6- to 12-week-old male mice.
Cell culture.
Mouse macrophage RAW 264.7 cells (Sigma-Aldrich) were cultured in RPMI 1640 medium containing 10% heat-inactivated FBS. BMDMs were isolated from the leg bones of respective mouse strains and differentiated in DMEM medium supplemented with 10% heat-inactivated FBS and 25 ng ml−1 M-CSF (Miltenyi) for 7 d. Primary human MDMs were differentiated from monocytes isolated from human buffy coats provided by the blood donation service at the Klinikum Braunschweig and Universitätsklinikum Bonn using Biocoll (Bio&SELL) and CD14 microbeads (Miltenyi) in RPMI 1640 containing 10% heat-inactivated FBS and 50 U ml−1 M-CSF (ImmunoTool) for 5 d. Unless stated otherwise, cells were treated with various concentrations of itaconate, mesaconate, DMI or 4-OI (all from Sigma-Aldrich, and all metabolites were dissolved in cell culture medium adjusted to pH 7.4) for 4 h before 10 ng ml−1 LPS (Sigma-Aldrich) for 3 h or 21 h. Experiments using human blood cells were approved by the Ethics Committee of the Faculty 2 of the Technische Universität Braunschweig (approval no. FV-2020–07) and the Medical Faculty of the University of Bonn (approval no. 392/20). We obtained written informed consent from all participants.
siRNA-mediated gene silencing.
RAW264.7 cells were electroporated with SF Cell Line 4D-Nucleofector X kit (Lonza) in 4D-Nucleofector (Lonza). The following ON-TARGETplus SMARTpool siRNAs (Horizon Discovery) were applied for silencing: mouse Suclg1 (gene id: 56451) and mouse Auh (gene id: 11992). siRNA ON-TARGETplus non-targeting pool (Horizon Discovery) served as the control (siCtrl). Following electroporation, cells were seeded in 12-well plates (0.5 million cells per well) for 24 h and then treated with 10 ng ml−1 LPS for 24 h, before metabolite extraction and RNA isolation.
Stable isotope tracing.
The tracer medium was prepared in SILAC RPMI 1640 Flex Media without glucose and glutamine (Thermo Fisher Scientific) with [U-13C6]glucose (final concentration of 11.1 mM) plus non-labelled glutamine (final concentration of 2 mM) or [U-13C5]glutamine (final concentration of 2 mM) plus non-labelled glucose (final concentration of 11.1 mM; both tracers from Cambridge Isotope Laboratories). Cells were first cultured in standard RPMI, which was then replaced by tracer medium, and cells were further incubated for 24 h to reach isotopic steady state. For [13C]itaconate studies, RAW264.7 cells were cultured in DMEM supplemented with 10% heat-inactivated FBS and 1 mM [U-13C5]itaconate (tracer was provided by the National Institutes of Health (NIH) Metabolite Standards Synthesis Core) for 24 h ± LPS (100 ng μl−1) before metabolite extraction. For further information regarding stable isotope-assisted metabolomics, see refs. 17,27.
Extraction of intracellular metabolites and total RNA.
Extraction was performed as previously described17,28. Briefly, macrophages cultured in 12-well plates were washed with 0.9% NaCl and then quenched with pre-cooled methanol (−20 °C, 0.25 ml per well). After adding an equal volume of 4 °C deionized water containing 1 μg ml−1 D6-pentanedioic acid (C/D/N Isotopes) as internal standard, cells were scraped and transferred to microcentrifuge tubes pre-added with 0.25 ml of pre-cooled (−20 °C) chloroform. The extracts were vortexed at 1,400 r.p.m. for 20 min at 4 °C and centrifuged at 17,000g for 5 min at 4 °C. Next, 0.3 ml of the upper aqueous phase was transferred into glass vials compatible with gas chromatography and then dried under vacuum at 4 °C in the CentriVap Concentration System (Labconco). The interphase of the cell extracts was collected for total RNA isolation using NucleoSpin RNA isolation kit (Macherey-Nagel).
Quantitative RT–PCR analysis.
cDNA synthesis was performed using Maxima H Minus cDNA Synthesis Master Mix (Thermo Fisher Scientific) and RT–qPCR was performed as previously described29. The following TaqMan Gene Expression Assays (Applied Biosystems) were used: Il1b (Mm00434228_m1), Il6 (Mm00446190_m1), Tnf (Mm00443258_m1), Il10 (Mm01288386_m1), Il12b (Mm01288989_m1), Suclg1 (Mm00451244_m1), Auh (Mm00479363_m1), Ppia (Mm02342430_g1) and Rpl27 (Mm01245874_g1).
Cytokine ELISA.
Cytokine concentration in cell culture supernatants was determined by ELISA using commercial kits from BioLegend or R&D systems according to the manufacturer’s protocol and the absorbances at 450/570 nm were measured with Tecan Spark Microplate reader.
GC–MS measurement and data analysis.
Gas chromatography–mass spectrometry (GC–MS) measurement of relative metabolite levels and isotopic enrichment was performed as described28, using an Agilent 7890B gas chromatograph equipped with a 30-m DB-35ms and a 5-m Duraguard capillary column (Agilent) for separation of derivatized metabolites, and an Agilent 5977B MSD system (Agilent) for measurement of metabolites. Briefly, dried metabolite extracts were derivatized with equal amounts of methoxylamine (20 mg ml−1 in pyridine) and MSTFA or MTBSTFA before injection into the GC–MS system. Measurements were carried out in either full scan mode or selected ion mode30. Processing of chromatograms and the calculation of mass isotopomer distributions as well as relative quantification of metabolites were performed using the Metabolite Detector software31.
Analysis of metabolites from fractionated mitochondria.
RAW 264.7 cells were seeded in six-well plates at 3 × 10⁵ cells per well and incubated for 48 h. Permeabilization and assessment of mitochondrial metabolism was performed as previously reported32,33. Briefly, cells were washed with PBS and selective permeabilization of the cytosolic membrane was achieved by the addition of 40 μM digitonin for 2 min. After three consecutive washing steps with mitochondria buffer (2 mM KH2PO4, 120 mM KCl, 3 mM HEPES, 1 mM EGTA and 3 g l−1 fatty-acid-free BSA; pH 7.2), non-labelled pyruvate and U-13C5-labelled glutamine were added to the in situ fractionated mitochondria. After 30 min of incubation, mitochondrial metabolites were extracted using the chloroform/methanol/water extraction protocol and measured by GC–MS (described above).
Metabolic measurement by YSI and Seahorse.
Glucose uptake and lactate secretion were determined by measuring the concentration of glucose and lactate in cell culture supernatants and control media in a YSI 2950D Biochemistry Analyzer, and quantification was achieved by measuring respective standards. OCR was determined using a Seahorse XF-96 Analyzer (Agilent). Briefly, 2 × 10⁴ RAW 264.7 cells were plated and incubated overnight on Seahorse XF-96 Cell Culture Microplates (Agilent). On the second day, cell culture media were changed to Seahorse XF RPMI media (Agilent) containing 10 mM glucose, 2 mM glutamine and 10 mM itaconate or mesaconate, and then cells were incubated for 4 h. After loading to the Seahorse XF-96 Analyzer, a sequential in situ incubation of components was performed as follows: 10 ng ml−1 LPS for 3 h, 1.5 μM oligomycin (Agilent) for 18 min, 1 μM FCCP (Agilent) for 18 min and 0.5 μM rotenone plus 0.5 μM antimycin A (Agilent) for 18 min. OCR data were analysed with Wave software (Agilent).
Cell viability assay.
Cell viability was assessed using the CellTiter-Blue Cell Viability Assay (Promega). Briefly, 1 × 10⁵ BMDMs per well were seeded on a 96-well plate overnight. The next day, medium was replaced with fresh medium containing different concentrations of itaconate, mesaconate, DMI or 4-OI for 4 h, followed by stimulation with LPS (10 ng ml−1) overnight. Afterwards, supernatants were removed and 1× CellTiter-Blue reagent in medium was added for 40–60 min at 37 °C and then fluorescence (560Ex/590Em) was measured using the SpectraMax i3x Multi-Mode Detection System (Molecular Devices).
Inflammasome activation and caspase-1 immunoblotting.
In total, 1 × 10⁵ mouse BMDMs or human MDMs were seeded on 96-well plates overnight. For pre-incubation experiments, cells were treated with itaconate, mesaconate, DMI or 4-OI for 4 h, then LPS (10 ng ml−1) priming for 3 h and subsequent activation of NLRP3 or NLRC4 inflammasome by nigericin (10 μM) or a mixture of BsaK (100 ng ml−1) and protective antigen (1 μg ml−1), respectively. For post-incubation experiments, cells were primed with LPS (10 ng ml−1) for 2 h 20 min. Then, medium was replaced with medium containing itaconate, mesaconate, DMI or 4-OI for 40 min, followed by activation of NLRP3 or NLRC4 inflammasome by nigericin (10 μM) or a mixture of BsaK (100 ng ml−1) and protective antigen (1 μg ml−1), respectively. Supernatants were collected 120 min (NLRP3) or 60 min (NLRC4) after inflammasome activation and stored at −20 °C. Supernatants of BMDMs were used for immunoblotting analysis of caspase-1 cleavage using the automated Wes Simple Western system (ProteinSimple) according to the manufacturer’s instructions, and the anti-mouse-caspase-1 (p20; Casper-1, AG-20B-0042-C100, Adipogen) antibody.
Whole-blood assays.
Experiments using human whole blood were approved by the ethics committee of the medical faculty of the University of Bonn (approval no. 392/20). Blood was drawn from healthy anonymous volunteers into sodium citrate monovettes. Approximately 500 μl of whole blood was transferred to cryotubes and mixed with 500 μl of serum-free RPMI containing mesaconate (2.2 or 22 mM), itaconate (2.2 or 22 mM), DMI (0.55 or 2.2 mM) or 4-OI (0.175 or 0.55 mM) and incubated at 37 °C and 500 r.p.m. After 4 h, the blood was stimulated by addition of 100 μl of 11 ng ml−1 LPS and incubated at 37 °C and 500 r.p.m. overnight. The next day, cells were pelleted and supernatants were stored at −20 °C.
LPS-induced model of sepsis.
Mice were treated intraperitoneally with itaconate or mesaconate (250 mg per kg body weight) or vehicle control (PBS) for 2 h before intraperitoneal stimulation with LPS (O55:B5, Sigma; 30 mg per kg body weight) for 24 h. For clinical signs and body temperature regulation, mice received 2.5 mg per kg body weight LPS and were monitored at 1, 2, 3, 6, 15, 18 and 24 h after LPS injection. Clinical scores of septic shock were calculated based on fur appearance, level of consciousness, activity, responsiveness to stimulus, temperature change, physical conditions, diarrhoea and eye conditions. A combined score of 9 was defined as a humane endpoint for the experiment.
RNA-seq analysis.
Wild-type BMDMs were pretreated with 10 mM itaconate or mesaconate for 4 h before 10 ng ml−1 LPS stimulation for 3 h, followed by total RNA isolation using NucleoSpin RNA isolation kit (Macherey-Nagel). cDNA synthesis was performed and libraries were constructed using NEBNext Ultra II Directional RNA Library Prep Kit for Illumina at the Genome Analytics at Helmholtz Centre for Infection Research. Libraries were sequenced using a NovaSeq 6000 instrument (Illumina) generating 50-bp reads in paired-end mode. Reads mapping and differential expression analysis were performed using the galaxy platform (https://usegalaxy.org/)34. Reads were mapped to the mouse genome mm10 with Hisat2 (ref. 35). EdgeR was used to identify differential expression and calculate the P values with an exact test based on the dispersion generated by the quantile-adjusted conditional maximum likelihood (qCML) method36. PCA plots were generated in R using the fviz_pca toolkit in the factoextra package (https://cran.r-project.org/web/packages/factoextra/index.html). Volcano plots were generated using the galaxy platform. Gene-set enrichment was performed using the clusterProfiler package and visualized as ridge plots using KEGG (Kyoto Encyclopedia of Genes and Genomes) pathways37.
Statistical analysis.
All values are presented as means ± s.e.m. The different groups were compared by unpaired or paired two-tail Students t-test (for two groups) or one-way ANOVA with Dunnet’s post hoc test (for multiple groups). P values were determined with Prism 9.0 (GraphPad) or EdgeR (for RNA-seq analysis only) and P < 0.05 was considered statistically significant.
Reporting Summary.
Further information on research design is available in the Nature Research Reporting Summary linked to this article.
Data availability
Source data for all figures and extended data figures as well as RNA-seq data are deposited in the repository platform of Technische Universität Braunschweig at https://doi.org/10.24355/dbbs.084-202203091309-0. The uncropped images of all blots for Fig. 3f are provided in Supplementary Fig. 2. All other information is available from the corresponding author on reasonable request.
Extended Data
Extended Data Fig. 1 |. Mesaconate is endogenously synthesized from itaconate and cellularly permeable in mouse macrophages.
a. Intracellular itaconate and mesaconate of BMDMs from wildtype (WT) or IRG1-deficient (KO) mice stimulated with or without LPS for 24 h. b. Intracellular itaconate and mesaconate of BMDMs incubated with exogenous itaconate or mesaconate for the indicated time points. c. Intracellular itaconate and mesaconate of RAW264.7 cells transfected with indicated siRNA, followed with LPS stimulation for 24 h. d. Silencing efficiency of indicated genes from experiments shown in (c). Data are presented as mean ± SEM: a,b. calculated from n = 3 mice from a representative experiment of 2 independent experiments; c,d. n = 6 biological replicates pooled from 2 independent experiments. P values were calculated by one-way ANOVA with Dunnet post-test and overlayed on respective comparisons.
Extended Data Fig. 2 |. Mesaconate and itaconate exhibit different metabolic impacts in macrophages.
a. Intracellular metabolite levels of glycolysis and TCA cycle in human monocyte-derived macrophages pre-treated with 10 mM itaconate or mesaconate for 4 h prior to LPS stimulation for 3 h. b,c. Unnormalized oxygen consumption rate (OCR) and extracellular acidification rate (ECAR) from the experiment shown in Fig. 2e. Data are presented as mean ± SEM, and figures are representative of 3 independent experiments.
Extended Data Fig. 3 |. Both non-derivatized itaconate and mesaconate are immunomodulatory in mouse macrophages.
a. Cytokine expression of RAW264.7 cells pre-treated with 10 mM itaconate, 0.25 mM DMI or 0.125 mM 4-OI for 4 h prior to LPS stimulation for 3 h. b. Viability of BMDMs pre-treated with indicated concentrations of mesaconate, itaconate, DMI and 4-OI for 4 h prior to LPS stimulation overnight. c. Non-targeted intracellular metabolome of RAW264.7 cells treated with 1 mM itaconate, DMI or 4-OI for 6 h. d. IL-1β in supernatants of BMDMs treated with indicated concentrations of mesaconate, itaconate, DMI or 4-OI, LPS stimulation as well as NLRP3 or NLRC4 inflammasome activation with nigericin or a mixture of BsaK and protective antigen, respectively, following a post-treatment protocol as indicated at top. Data are shown as: a,b,d. mean ± SEM calculated from (a) n = 3 biological replicates from one representative experiment, (b) n = 6 biological replicates from 3 mice, (d) n = 8 mice from 3 independent experiments; c. a representative heatmap showing z-scores of the data by row, from 2 independent experiments; P values were calculated by one-way ANOVA with Dunnet post-test (a) or paired t test (d, paired by each mouse) and overlayed on respective comparisons.
Extended Data Fig. 4 |. itaconate derivatives impairs iL-1β secretion in human macrophages.
a,b. IL-1β in supernatants of human monocyte-derived macrophages treated with mesaconate, itaconate, DMI or 4-OI of indicated concentrations, LPS stimulation as well as NLRP3 or NLRC4 inflammasome activation by nigericin or a mixture of BsaK and protective antigen, respectively, following the pre- (a) or post-treatment protocol (b) as shown at the top. c. IL-1β in supernatants of human whole blood pre-treated with mesaconate, itaconate, DMI or 4-OI of indicated concentrations for 4 h prior to LPS stimulation overnight. Data are shown as mean ± SEM calculated from n = 5 donors. P values were calculated by one-way ANOVA with Dunnet post-test and overlayed on respective comparisons.
Extended Data Fig. 5 |. Dependency of DMi and 4-Oi on NRF2 and ATF3 for their anti-inflammatory effects in mouse BMDMs.
Cytokine secretion of BMDMs from wildtype (WT) and Nrf2-KO (a) or Atf3-KO (b) mice pre-treated with 0.25 mM DMI or 0.125 mM 4-OI for 4 h prior to LPS stimulation for 21 h. Data are shown as mean ± SEM calculated from n = 5 (a) or 3 (b) mice. P values were calculated by multiple unpaired t-test and overlayed on respective comparisons.
Extended Data Fig. 6 |. Effects of itaconate and mesaconate are independent of GsH.
a. Cytokine secretion of BMDMs from wildtype mice pre-treated with 10 mM itaconate or mesaconate, or 0.25 mM DMI, in the presence or absence of 1 mM cellular permeable GSH (EtGSH) for 4 h prior to LPS stimulation for 21 h. b,c. Cytokine secretion (b), glucose uptake and lactate secretion (c) of Gclc-deficient (Gclc-KO) BMDMs pre-treated with 10 mM itaconate or mesaconate for 4 h prior to LPS stimulation for 21 h. Data are shown as: a. mean ± SEM calculated from n = 4 mice; b,c. mean with individual mouse data pooled from n = 6 (b) or 3 (c) mice, and conditions from individual mouse are connected with a line. P values were calculated by multiple unpaired t-test (a) or paired t-test (b,c, paired by each mouse) and overlayed on respective comparisons.
Extended Data Table 1 |.
Overview of the immunometabolic effects of itaconate and mesaconate in mouse macrophages. SUCLG, succinate-CoA ligase; AUH, AU RNA-binding protein/enoyl-coenzyme A hydratase, also known as methylglutaconyl-CoA hydratase
| Itaconate | Mesaconate | |
| Synthesis (stimulant) | in LPS-stimulated macrophages | |
| Precursor | cis-aconitate | itaconate |
| Synthetic enzyme | IRG1(ACOD1) | SUCLG, AUH and others? |
| Effect on glycolysis | to reduce glycolysis | |
| Effect on SDH activity | to inhibit | no effect |
| Effect on respiration | to inhibit | to mildly reduce |
| Effect on cytokines | IL-6/IL-12 ⇩, CXCL10 ⇧ | |
| Dependence on NRF2 and ATF3 | no | |
Abbreviations: IRG1: Immunoresponsive gene 1, aka. Aconitate Decarboxylase 1 (ACOD1); SUCLG, Succinate-CoA Ligase; AUH: AU RNA binding protein/enoyl-Coenzyme A hydratase, aka. Methylglutaconyl-CoA hydratase; SDH: Succinate dehydrogenase.
Supplementary Material
Acknowledgements
This work is funded by the Deutsche Forschungsgemeinschaft (German Research Foundation) project HI1400/3–1 (to K.H.), SFB-1403 project 414786233 (to E.L.), SFB-1454 project 432325352 (to Z.A., E.L. and K.H.) and ImmunoSensation2 EXC2151 project 390873048 (to Z.A. and E.L.). D.B. is supported by the FNR-ATTRACT programme (A14/BM/7632103), and by the FNR-CORE (C18/BM/12691266). D.B. and C.D. receive funding through the FNRS-Televie programme (7.4597.19). We thank the NIH Common Fund Metabolite Standards Synthesis Core (NHLBI contract no. HHSN268201300022C) for providing isotopic labelled itaconate ([U-13C5]itaconate).
Footnotes
Competing interests
The authors declare no competing interests.
Additional information
Extended data is available for this paper at https://doi.org/10.1038/s42255-022-00565-1.
Supplementary information The online version contains supplementary material available at https://doi.org/10.1038/s42255-022-00565-1.
Peer review information Nature Metabolism thanks Ping-Chih Ho, Luke O’Neill and the other, anonymous, reviewer for their contribution to the peer review of this work. Primary Handling Editor: Isabella Samuelson, in collaboration with the Nature Metabolism team.
References
- 1.Michelucci A. et al. Immune-responsive gene 1 protein links metabolism to immunity by catalyzing itaconic acid production. Proc. Natl Acad. Sci. USA 110, 7820–7825 (2013). [DOI] [PMC free article] [PubMed] [Google Scholar]
- 2.Mills EL et al. Itaconate is an anti-inflammatory metabolite that activates Nrf2 via alkylation of KEAP1. Nature 556, 113–117 (2018). [DOI] [PMC free article] [PubMed] [Google Scholar]
- 3.Bambouskova M. et al. Electrophilic properties of itaconate and derivatives regulate the IκBζ–ATF3 inflammatory axis. Nature 556, 501–504 (2018). [DOI] [PMC free article] [PubMed] [Google Scholar]
- 4.Wynn TA, Chawla A. & Pollard JW Macrophage biology in development, homeostasis and disease. Nature 496, 445–455 (2013). [DOI] [PMC free article] [PubMed] [Google Scholar]
- 5.He W, Heinz A, Jahn D. & Hiller K. Complexity of macrophage metabolism in infection. Curr. Opin. Biotechnol 68, 231–239 (2021). [DOI] [PubMed] [Google Scholar]
- 6.Cordes T. et al. Immunoresponsive gene 1 and itaconate inhibit succinate dehydrogenase to modulate intracellular succinate levels. J. Biol. Chem 291, 14274–14284 (2016). [DOI] [PMC free article] [PubMed] [Google Scholar]
- 7.Nemeth B. et al. Abolition of mitochondrial substrate-level phosphorylation by itaconic acid produced by LPS-induced Irg1 expression in cells of murine macrophage lineage. FASEB J. 30, 286–300 (2016). [DOI] [PubMed] [Google Scholar]
- 8.Cordes T. & Metallo CM Itaconate alters succinate and coenzyme a metabolism via Inhibition of mitochondrial complex II and methylmalonyl-CoA mutase. Metabolites 11, 117 (2021). [DOI] [PMC free article] [PubMed] [Google Scholar]
- 9.Lampropoulou V. et al. Itaconate links inhibition of succinate dehydrogenase with macrophage metabolic remodeling and regulation of Inflammation. Cell Metab. 24, 158–166 (2016). [DOI] [PMC free article] [PubMed] [Google Scholar]
- 10.Liao ST et al. 4-Octyl itaconate inhibits aerobic glycolysis by targeting GAPDH to exert anti-inflammatory effects. Nat. Commun 10, 5091 (2019). [DOI] [PMC free article] [PubMed] [Google Scholar]
- 11.Qin W. et al. S-glycosylation-based cysteine profiling reveals regulation of glycolysis by itaconate. Nat. Chem. Biol 15, 983–991 (2019). [DOI] [PubMed] [Google Scholar]
- 12.ElAzzouny M. et al. Dimethyl itaconate is not metabolized into itaconate intracellularly. J. Biol. Chem 292, 4766–4769 (2017). [DOI] [PMC free article] [PubMed] [Google Scholar]
- 13.Swain A. et al. Comparative evaluation of itaconate and its derivatives reveals divergent inflammasome and type I interferon regulation in macrophages. Nat. Metab 2, 594–602 (2020). [DOI] [PMC free article] [PubMed] [Google Scholar]
- 14.Bambouskova M. et al. Itaconate confers tolerance to late NLRP3 inflammasome activation. Cell Rep. 34, 108756 (2021). [DOI] [PMC free article] [PubMed] [Google Scholar]
- 15.Ghosn EE et al. Two physically, functionally, and developmentally distinct peritoneal macrophage subsets. Proc. Natl Acad. Sci. USA 107, 2568–2573 (2010). [DOI] [PMC free article] [PubMed] [Google Scholar]
- 16.Wang J. & Zhang K. Production of mesaconate in Escherichia coli by engineered glutamate mutase pathway. Metab. Eng 30, 190–196 (2015). [DOI] [PubMed] [Google Scholar]
- 17.Meiser J. et al. Pro-inflammatory macrophages sustain pyruvate oxidation through pyruvate dehydrogenase for the synthesis of itaconate and to enable cytokine expression. J. Biol. Chem 291, 3932–3946 (2016). [DOI] [PMC free article] [PubMed] [Google Scholar]
- 18.Hooftman A. et al. The immunomodulatory metabolite itaconate modifies NLRP3 and inhibits inflammasome activation. Cell Metab. 32, 468–478 (2020). [DOI] [PMC free article] [PubMed] [Google Scholar]
- 19.Broz P. & Dixit VM Inflammasomes: mechanism of assembly, regulation and signalling. Nat. Rev. Immunol 16, 407–420 (2016). [DOI] [PubMed] [Google Scholar]
- 20.Mangan MSJ et al. Targeting the NLRP3 inflammasome in inflammatory diseases. Nat. Rev. Drug Disco. 17, 688 (2018). [DOI] [PubMed] [Google Scholar]
- 21.Chen F. et al. Citraconate inhibits ACOD1 (IRG1) catalysis, reduces interferon responses and oxidative stress, and modulates inflammation and cell metabolism. Nat. Metab [DOI] [PMC free article] [PubMed] [Google Scholar]
- 22.Kornberg MD et al. Dimethyl fumarate targets GAPDH and aerobic glycolysis to modulate immunity. Science 360, 449–453 (2018). [DOI] [PMC free article] [PubMed] [Google Scholar]
- 23.Montes Diaz G, Hupperts R, Fraussen J. & Somers V. Dimethyl fumarate treatment in multiple sclerosis: recent advances in clinical and immunological studies. Autoimmun. Rev 17, 1240–1250 (2018). [DOI] [PubMed] [Google Scholar]
- 24.Hartman MG et al. Role for activating transcription factor 3 in stress-induced beta-cell apoptosis. Mol. Cell. Biol 24, 5721–5732 (2004). [DOI] [PMC free article] [PubMed] [Google Scholar]
- 25.Chen Y. et al. Hepatocyte-specific Gclc deletion leads to rapid onset of steatosis with mitochondrial injury and liver failure. Hepatology 45, 1118–1128 (2007). [DOI] [PubMed] [Google Scholar]
- 26.Clausen BE, Burkhardt C, Reith W, Renkawitz R. & Forster I. Conditional gene targeting in macrophages and granulocytes using LysMcre mice. Transgenic Res. 8, 265–277 (1999). [DOI] [PubMed] [Google Scholar]
- 27.Weindl D. et al. Bridging the gap between non-targeted stable isotope labeling and metabolic flux analysis. Cancer Metab. 4, 10 (2016). [DOI] [PMC free article] [PubMed] [Google Scholar]
- 28.Sapcariu SC et al. Simultaneous extraction of proteins and metabolites from cells in culture. MethodsX 1, 74–80 (2014). [DOI] [PMC free article] [PubMed] [Google Scholar]
- 29.He W. et al. TLR4 triggered complex inflammation in human pancreatic islets. Biochim. Biophys. Acta Mol. Basis Dis 1865, 86–97 (2019). [DOI] [PubMed] [Google Scholar]
- 30.Battello N. et al. The role of HIF-1 in oncostatin M-dependent metabolic reprogramming of hepatic cells. Cancer Metab. 4, 3 (2016). [DOI] [PMC free article] [PubMed] [Google Scholar]
- 31.Hiller K. et al. MetaboliteDetector: comprehensive analysis tool for targeted and nontargeted GC/MS based metabolome analysis. Anal. Chem 81, 3429–3439 (2009). [DOI] [PubMed] [Google Scholar]
- 32.Nonnenmacher Y. et al. Analysis of mitochondrial metabolism in situ: combining stable isotope labeling with selective permeabilization. Metab. Eng 43, 147–155 (2017). [DOI] [PubMed] [Google Scholar]
- 33.Nonnenmacher Y, Palorini R. & Hiller K. Determining compartment-specific metabolic fluxes. Methods Mol. Biol 1862, 137–149 (2019). [DOI] [PubMed] [Google Scholar]
- 34.Afgan E. et al. The Galaxy platform for accessible, reproducible and collaborative biomedical analyses: 2018 update. Nucleic Acids Res. 46, W537–W544 (2018). [DOI] [PMC free article] [PubMed] [Google Scholar]
- 35.Kim D, Langmead B. & Salzberg SL HISAT: a fast spliced aligner with low memory requirements. Nat. Methods 12, 357–360 (2015). [DOI] [PMC free article] [PubMed] [Google Scholar]
- 36.Robinson MD, McCarthy DJ & Smyth GK edgeR: a Bioconductor package for differential expression analysis of digital gene expression data. Bioinformatics 26, 139–140 (2010). [DOI] [PMC free article] [PubMed] [Google Scholar]
- 37.Yu G, Wang LG, Han Y. & He QY clusterProfiler: an R package for comparing biological themes among gene clusters. OMICS 16, 284–287 (2012). [DOI] [PMC free article] [PubMed] [Google Scholar]
Associated Data
This section collects any data citations, data availability statements, or supplementary materials included in this article.
Supplementary Materials
Data Availability Statement
Source data for all figures and extended data figures as well as RNA-seq data are deposited in the repository platform of Technische Universität Braunschweig at https://doi.org/10.24355/dbbs.084-202203091309-0. The uncropped images of all blots for Fig. 3f are provided in Supplementary Fig. 2. All other information is available from the corresponding author on reasonable request.


