

Abstract
Atherosclerosis is an inflammatory disease of the artery walls and involves immune cells such as macrophages. Olfactory receptors (OLFRs) are G protein–coupled chemoreceptors that have a central role in detecting odorants and the sense of smell. We found that mouse vascular macrophages express the olfactory receptor Olfr2 and all associated trafficking and signaling molecules. Olfr2 detects the compound octanal, which activates the NLR family pyrin domain containing 3 (NLRP3) inflammasome and induces interleukin-1β secretion in human and mouse macrophages. We found that human and mouse blood plasma contains octanal, a product of lipid peroxidation, at concentrations sufficient to activate Olfr2 and the human ortholog olfactory receptor 6A2 (OR6A2). Boosting octanal levels exacerbated atherosclerosis, whereas genetic targeting of Olfr2 in mice significantly reduced atherosclerotic plaques. Our findings suggest that inhibiting OR6A2 may provide a promising strategy to prevent and treat atherosclerosis.
Olfactory receptors (OLFRs) (1) constitute the largest family of G protein–coupled receptors (GPCRs), with ~1100 genes in mice and ~400 in humans (2). Many OLFRs require the transporters Rtp1 and Rtp2 for surface expression (3). OLFRs couple through a specialized Gα subunit [Gαolf, encoded by G protein subunit alpha L (Gnal)] (4) to adenylate cyclase 3 (Adcy3) (5, 6). Some OLFRs are also expressed in nonolfactory tissues (7–9).
In atherosclerotic mice, plaques contain several phenotypically distinct macrophage subsets that behave differently (10, 11). In a transcriptomic study of vascular macrophages isolated from aortas of atherosclerosis-prone Apoe−/− mice, we unexpectedly detected expression of Olfrs, Gαolf (Gnal), Adcy3, Rtp1, Rtp2, and the cyclic nucleotide-gated (CNG) ion channel subunits Cnga1, Cnga2, Cnga3, Cnga4, and Cngb1 (12). Here, we focus on Olfr2, which binds medium-chain aliphatic aldehydes such as octanal with a median effective concentration (EC50) of ~10 μM (13–15). Octanal is produced by reduction of the carboxy group of octanoic acid or through lipid peroxidation during oxidative stress (16). We studied Olfr2 expression, function, regulation, and disease relevance in mice in vitro and in vivo and its human ortholog, OR6A2, in human macrophages.
In aortas explanted from Apoe−/− and wild-type (WT) mice, we measured Olfr2 (fig. S1, A and B) and Rtp1, Rtp2, Adcy3, Gnal, Cnga1, Cnga2, Cnga3, Cnga4, and Cngb1 mRNA expression by quantitative real-time polymerase chain reaction (qRT-PCR) (fig. S1A). Olfr2 expression increased in Apoe−/− mice after 2 weeks of eating a western diet (WD), which mimics the fat and calorie content in food consumed in western countries. Olfr2 expression did not change further at 4, 8, or 12 weeks (fig. S1B), although the canonical macrophage marker CD64 (Fcgr1) continued to increase (fig. S1C). Confocal microscopy and flow cytometry [fluorescence-activated cell sorting (FACS)] revealed Olfr2 protein expression in ~30% of vascular macrophages (Mφ) (Fig. 1A and figs. S2 and S3A). These data suggest that only a subset of vascular Mφ express Olfr2.
Fig. 1. Olfactory receptor 2 (Olfr2) is expressed in vascular macrophages (Mφ), bone marrow–derived macrophages (BMDMs), and human aortic macrophages.
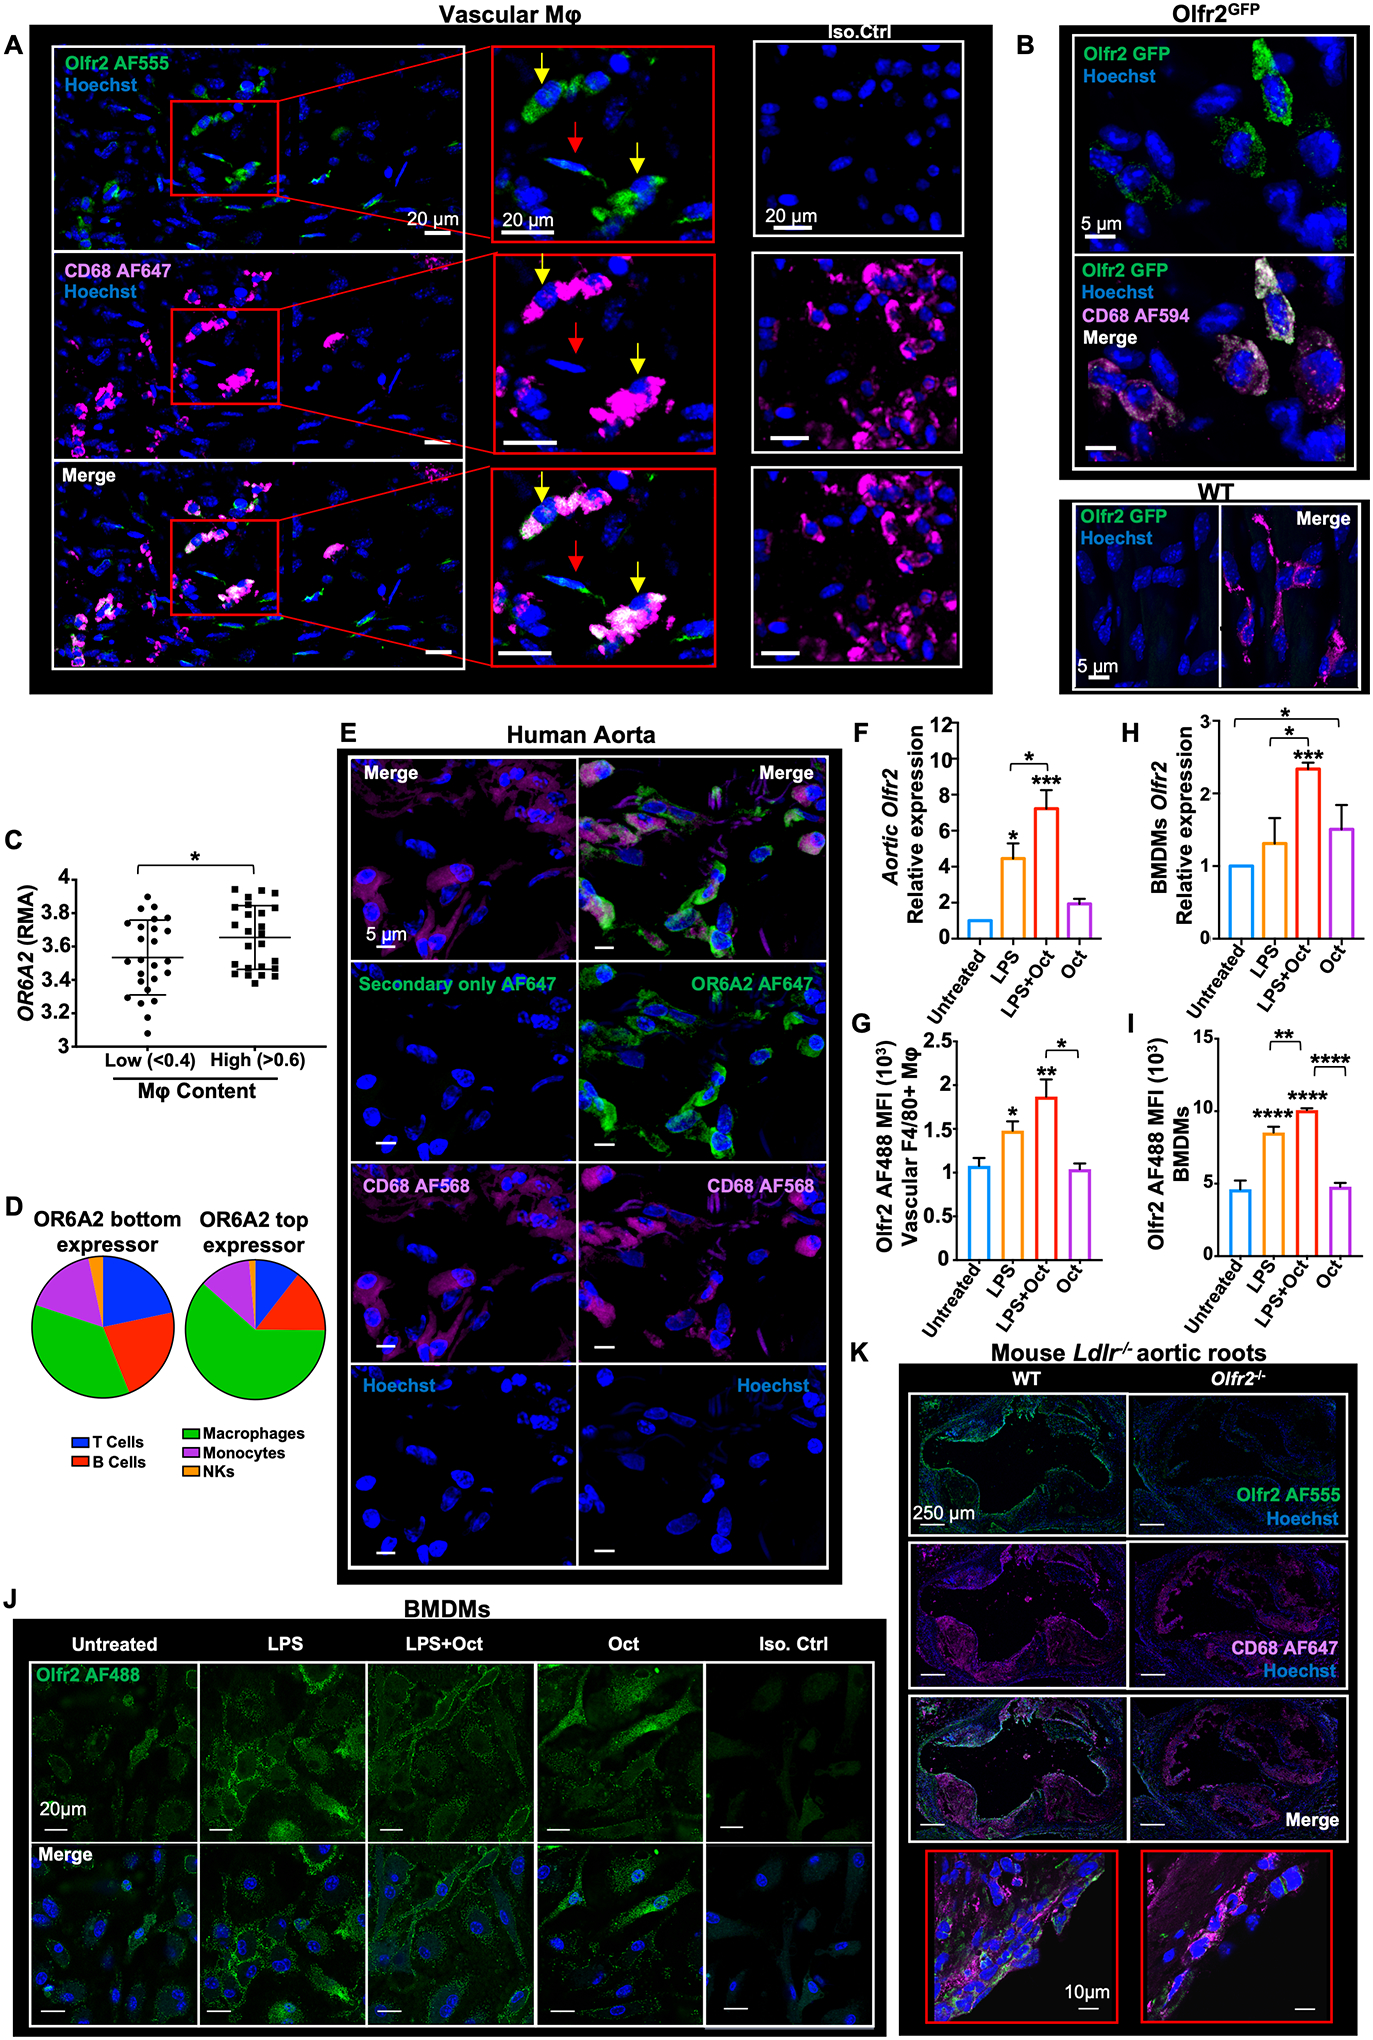
(A) Apoe−/− mice were fed a Western diet (WD) for 2 weeks. Confocal fluorescence micrographs are shown, depicting Olfr2 (green), CD68 (macrophage marker, magenta) immuno-reactivity, and Hoechst (blue) nuclear staining in whole-mount aorta. Olfr2+ CD68+ cells indicated with yellow arrows, Olfr2+ CD68− cells indicated with red arrows. Scale bars, 20 μm. (B) Olfr2GFP (green), CD68 (magenta), and Hoechst (blue) in whole-mount aorta from Olfr2GFP and WT mice. Scale bars, 5 μm. (C) OR6A2 expression measured by Affymetrix gene array (BiKE database, GSE21545) expressed as RMA (robust multi-array average; log scale) as a function of macrophage content ratio (low, <0.4, and high, >0.6; 50 subjects total) as determined by Cibersort. (D) Plaque composition extracted with Cibersort for representative OR6A2low (left) and OR6A2high (right) endarterectomy plaques. NKs, natural killer cells. (E) Human aorta from a surgical specimen, fixed and cut into transversal blocks. (Right column) Sections were stained for OR6A2 (AF647, green), CD68 (AF568, magenta), and nuclei (Hoechst, blue). (Left column) Control (no primary) for OR6A2 staining. 40× oil objective; scale bars, 5 μm. (F and G) Whole aortas were dissected from Apoe−/− mice fed a WD for 2 weeks or left untreated (vehicle control). Aortas were incubated with octanal (Oct, 10 μM), LPS (500 ng/ml), or both for 12 hours. (F) Aortic Olfr2 mRNA normalized to Gapdh, 2−ΔΔCT method. (G) Flow cytometry of Olfr2 expression in CD45+ live TCRβ− CD19− F4/80+ vascular Mφ, median fluorescence intensity (MFI), isotype control-subtracted (n = 5 mice per group). (H and I) BMDMs from Apoe−/− mice were left untreated (vehicle), incubated with octanal (Oct, 10 μM), LPS (500 ng/ml), or both for 12 hours. (H) Olfr2 mRNA normalized to Gapdh. (I) Flow cytometry of Olfr2 cell surface expression on live F4/80+ BMDMs. (J) Confocal microscopy of BMDMs visualizing Olfr2 expression (AF488, green); treatments as indicated above photomicrographs. Scale bars, 20 μm. (K) Aortic roots of chimeric WT Ldlr−/−and Olfr2−/− Ldlr−/− mice stained for Olfr2 (AF555, green), CD68 (AF647, magenta), and Hoechst (blue). Scale bars, 250 μm. High magnification in red boxes (60× oil objective; scale bars, 10 μm). Data are presented as mean ± SEM. *P < 0.05, **P < 0.01, ***P < 0.001, ****P <0.0001. P calculated by one-way analysis of variance (ANOVA) test, Tukey’s multiple comparisons test for (F) to (I), or unpaired t test with Welch correction for (C).
Sorted live CD45+ F4/80+ vascular macrophages from the aortas of Apoe−/− mice expressed Olfr2 mRNA (fig. S3B). Other cells, such as CD45− CD31+ endothelial cells (ECs) and CD45− CD31− cells including possible transdifferentiated smooth muscle cells (SMCs) (17, 18), also expressed some Olfr2 mRNA (fig. S3B). Olfr2GFP mice (19) showed green fluorescent protein (GFP) expression in vascular Mφ (Fig. 1B and fig. S3, C to E). CD45− CD31+ ECs also expressed some GFP, but at a lower level than macrophages (fig. S3, C to E). Antibody-based coexpression analysis showed that 80% (n = 177) of the identified cells expressing Olfr2 were CD68+ macrophages (fig. S3F), with the remaining 20% of cells (n = 43) being Olfr2+ CD68−. Other leukocytes in the aorta showed no detectable Olfr2 expression (fig. S4).
To address expression of OR6A2 (the human ortholog of mouse Olfr2), we analyzed the BiKE (Biobank of Karolinska Endarterectomy) dataset of human carotid endarterectomy samples (GSE21545) (20) showing expression of OR6A2, GNAL, CNGA1, CNGA3, CNGA4, CNGB1, RTP1, and ADCY3 mRNA (fig. S1D). OR6A2 mRNA expression increased with plaque macrophage content (Fig. 1, C and D). OR6A2 protein was detectable in human aorta and colocalized with the macrophage marker CD68 (Fig. 1E). Human monocyte-derived macrophages (hMDMs) also expressed mRNA for OR6A2 and all signaling components (fig. S1E). OR6A2 mRNA was strongly increased by lipopolysaccharide plus octanal (LPS+octanal; 10 μM) (fig. S5A). OR6A2 protein was detectable by FACS (fig. S5B) and confocal microscopy (fig. S5C).
Toll-like receptor 4 (TLR4) ligands have a known role in atherosclerosis (21). We observed Olfr2, Rtp1, and Rtp2 expression in vascular Mφ to be significantly increased after treatment with the TLR4 agonist LPS and further enhanced in the presence of octanal (10 μM) (Fig. 1, F and G, and fig. S1, F and G). Mouse bone marrow–derived macrophages (BMDMs) showed similar patterns of expression (Fig. 1, H to J, and fig. S1H). To test the impact of Olfr2 on atherosclerosis, we generated Olfr2−/− mice using CRISPR-Cas9 with a guide RNA targeting exon 1 (fig. S6A), resulting in complete absence of Olfr2 mRNA (fig. S6B). We confirmed that Olfr2 protein in BMDMs (fig. S6C), vascular Mφ (fig. S3A), and aortic root sections (Fig. 1K) was sharply reduced in Olfr2−/− mice. To test the functionality of Olfr2, we studied its proximal signaling cascade (6). In mouse BMDMs, LPS+octanal, but not LPS alone, increased cyclic adenosine monophosphate (cAMP), which was sharply reduced in Adcy3+/− cells (Fig. 2A). Adcy3 encodes the adenylate cyclase responsible for production of cAMP, which activates CNG channels. Ca2+ flux in BMDMs in response to octanal was sharply reduced in Olfr2−/− and Adcy3+/− BMDMs and by the CNG channel inhibitor l-cis-diltiazem (LCD) (22) (Fig. 2B). Taken together, these data show that Olfr2 is functional in mouse macrophages.
Fig. 2. Olfr2 ligation induces cAMP, Ca2+ flux, ROS, inflammasome activation, and IL-1 secretion in macrophages.
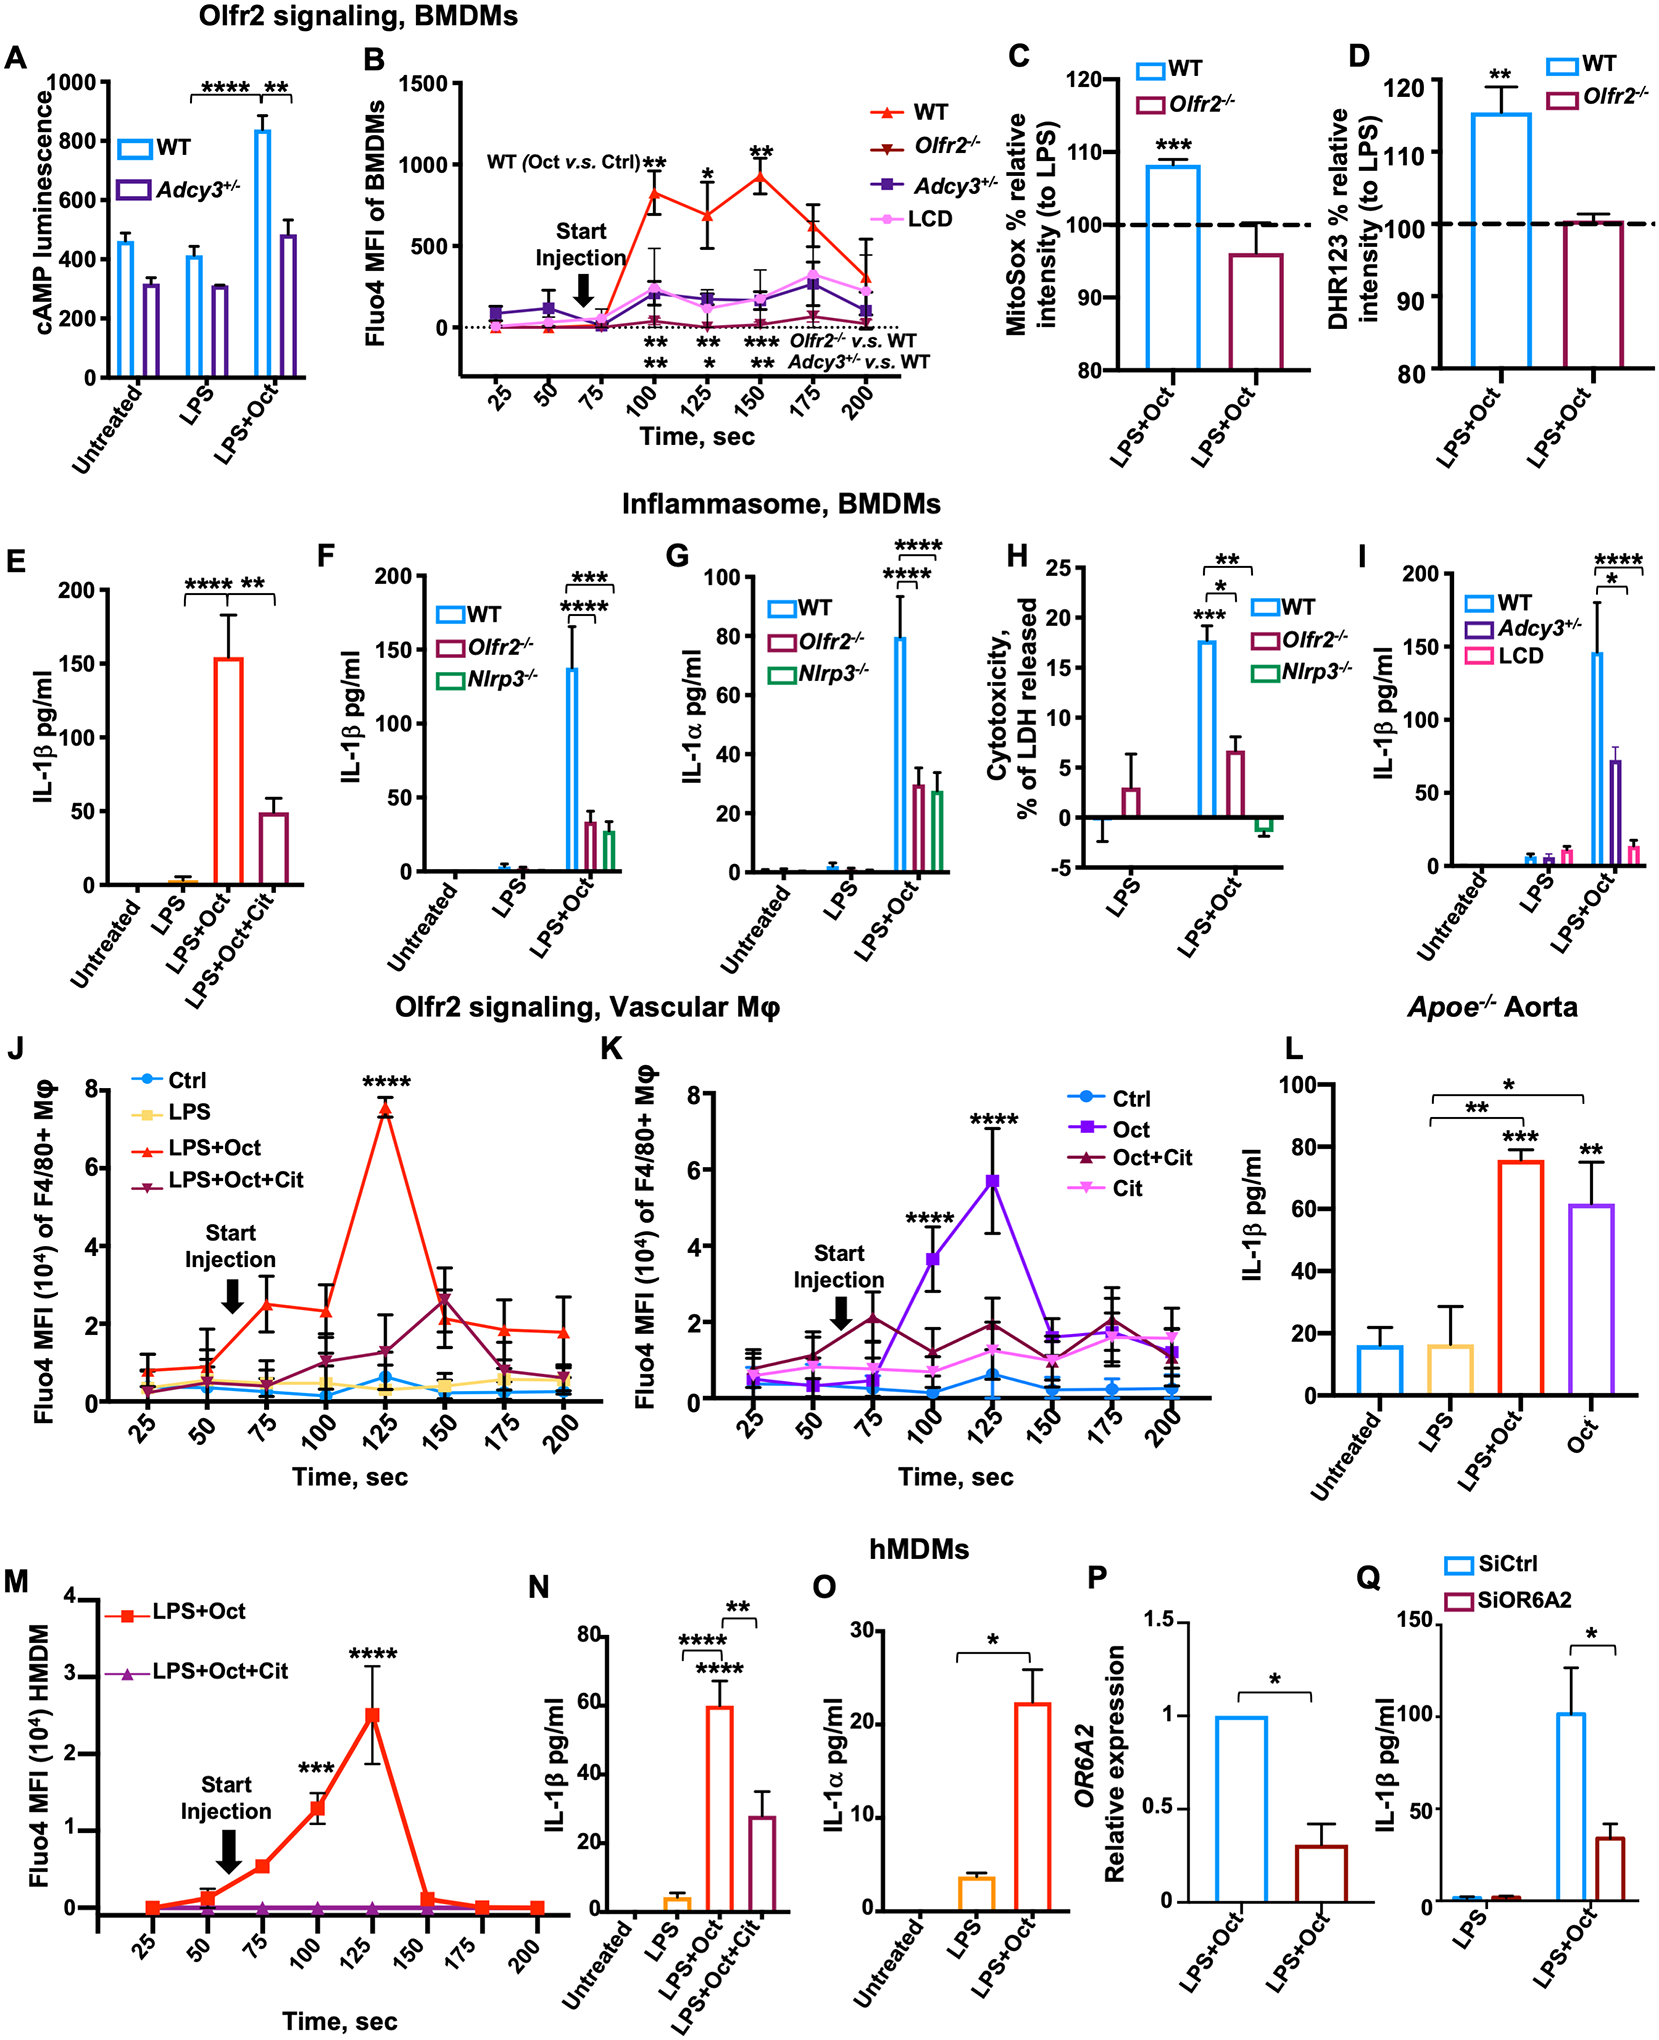
(A) cAMP in BMDMs from WT and Adcy3+/− mice assessed by cAMP glow assay. (B) Ca2+ flux in BMDMs from WT, Olfr2−/−, and Adcy3+/− mice or WT pretreated for 1 hour with l-cis-diltiazem (LCD, 100 μM). All cells were loaded with 2 μM Fluo-4, pretreated with LPS (100 ng/ml) for 1 hour, and then treated with octanal (10 μM) at “start injection.” Fluo-4 MFI averaged over 25-s intervals. Three biological replicates for each time point. (C and D) BMDMs from WT or Olfr2−/− mice were primed with LPS for 4 hours, treated with octanal (10 μM) for 8 hours, and then incubated with (C) 5 μM MitoSox for 30 min at 37°C or (D) 10 μM dihydrorhodamine 123 (DHR123) for 50 min at 37°C. ROS expressed as percent of response to LPS only. (E) BMDMs from WT mice treated with LPS (50 ng/ml) for 4 hours followed by octanal (Oct) or octanal and citral (Oct+Cit) for 8 hours. (F to H) BMDMs from WT, Olfr2−/−, and Nlrp3−/− mice treated with LPS (50 ng/ml) for 4 hours followed by octanal (Oct) for 8 hours. (F) IL-1β and (G) IL-1α protein in the supernatant by cytokine bead array. (H) Cytotoxicity by LDH release. (I) IL-1β secretion by BMDMs from WT mice, with or without pretreatment with 100 μM LCD for 1 hour, or Adcy3+/− mice. (J and K) Ca2+ in vascular macrophages. Freshly prepared mouse aortic cell suspensions were loaded with 2 μM Fluo-4, gated for CD45+ live dump channel–negative (TCRb−, CD19−) F4/80+ and analyzed by flow cytometry. Aortic macrophages were stimulated with LPS (100 ng/ml) for 1 hour (J) or not (K) and then treated with octanal (Oct, 10 μM), citral (Cit, 100 μM), neither (control, Ctrl), or both (Oct+Cit). (I) Mouse aortic cell suspensions from WT or Olfr2−/−, LPS prestimulated for 1 hour and treated with octanal (Oct, 10 μM) at 60 s after the start of acquisition. Fluo-4 MFI; SD calculated for 20 to 50 cells at each time point. (L) Whole aortas were untreated (vehicle) or incubated with octanal (10 μM), LPS (500 ng/ml), or both for 12 hours (n = 5 or 6 mice per group). IL-1β protein in supernatants of stimulated aortas by cytokine bead array. (M) hMDMs were loaded with 2 μM Fluo-4, pretreated with LPS for 1 hour, and then treated with octanal (10 μM) alone or combined with citral (100 μM, Cit) at “start injection.” Fluo-4 MFI averaged over 25-s intervals. Three biological replicates for each time point. (N) IL-1β and (O) IL-1α protein in supernatants of hMDM treated with LPS (50 ng/ml) for 4 hours, left untreated, or further treated, as indicated. (P and Q) hMDMs were transfected with OR6A2 siRNA or scrambled control siRNAs (SiCtrl) and treated with LPS+Oct for 12 hours. (P) OR6A2 mRNA normalized to GAPDH. (Q) IL-1β protein in silenced or control hMDM treated with LPS (10 ng/ml) for 4 hours and stimulated with octanal for 8 hours. Mean ± SEM. *P < 0.05, **P < 0.01, ***P < 0.001, ****P < 0.0001. P calculated by two-way ANOVA test, Tukey’s multiple comparisons for (A), (F) to (I), and (Q); one-way ANOVA test, Tukey’s multiple comparisons test for (C) to (E), (L), (N), and (O); unpaired t test with Welch correction for (B), (J), (K), (M), and (P).
RNA sequencing analysis of octanal-treated BMDMs showed that Olfr2 can activate oxidative stress pathways (fig. S7). Octanal triggered Olfr2-mediated production of mitochondrial and cytosolic reactive oxygen species (ROS) (Fig. 2, C and D). ROS can serve as signal 2 to trigger NLR family pyrin domain containing 3 (NLRP3) inflammasome formation and activation (23). LPS served as signal 1 (gene expression of inflammasome components) (fig. S7, A to C). NLRP3-dependent caspase-1 directly cleaves and activates interleukin (IL)–1β (24) and indirectly [through calpain and gasdermin D (GSDMD)] allows release of IL-1α (25). We tested the role of Olfr2 in NLRP3 inflammasome assembly and release of IL-1β, IL-1α, and lactate dehydrogenase (LDH). The release of IL-1β and IL-1α protein increased with octanal dose in LPS-primed BMDMs (fig. S8, A and B) and was inhibited by the Olfr2 inhibitor citral (13) (Fig. 2E and fig. S8D). Knocking out Olfr2 or Nlrp3 (Fig. 2, F and G) significantly reduced IL-1β and IL-1α release by ~80%. Knocking out Rtp1 and Rtp2 (fig. S8F) or blocking the Nlrp3 inflammasome with the small-molecule inhibitor MCC950 (26), or caspase 1 with VX-765 (27), or GSDMD with ouabain (28) (fig. S8, G to I) significantly reduced IL-1β secretion. LDH release was reduced in Olfr2−/− and Nlrp3−/− BMDMs (Fig. 2H). Blocking the CNG calcium channels by LCD (Fig. 2I) or using the calcium chelator BAPTA-AM (fig. S8J) blocked IL-1β release. In Adcy3+/− BMDMs, IL-1β release was also significantly reduced (Fig. 2I). Octanal promoted calcium flux in vascular macrophages in freshly explanted Apoe−/− aortas with (Fig. 2J) or without (Fig. 2K) LPS, but not in other leukocytes and CD45− cells (fig. S9, A to C). Vascular macrophages from Ldlr−/− mice receiving Olfr2−/− bone marrow and fed a high-cholesterol diet (HCD) for 8 weeks showed no calcium flux after octanal (fig. S10A). HCD is used to induce atherosclerosis in Ldlr−/− mice. Atherosclerotic Apoe−/− aortas showed increased release of IL-1β in response to octanal alone without LPS (Fig. 2L), showing that endogenous TLR ligands (21) are sufficient to allow octanal to induce IL-1β secretion. LPS treatment of atherosclerotic aortas boosted the octanal-mediated induction of other proinflammatory cytokines (fig. S10, B to I).
To translate these findings to human macrophages, we measured Ca2+ flux in hMDMs in response to LPS+octanal (Fig. 2M) and found Ca2+ flux to be completely abolished by citral (Fig. 2M). hMDMs secreted IL-1β (Fig. 2N) and IL-1α (Fig. 2O) in response to LPS+octanal. Knocking down OR6A2 by small interfering RNA (siRNA) significantly reduced OR6A2 mRNA expression (Fig. 2P) and IL-1β secretion in response to octanal (Fig. 2Q). Inhibition of caspase 1 (27) or GSDMD (28) (fig. S11, A and B) significantly reduced IL-1β secretion. TNF and IL6 mRNA and protein were also induced by LPS+octanal (fig. S11, C to H). Thus, upstream Olfr2 signaling in mouse BMDMs and vascular macrophages is similar to olfactory receptor signaling in olfactory epithelium (6), but Olfr2 ligation in mouse or OR6A2 ligation in human macrophages culminates in NLRP3-dependent IL-1α and IL-1β release.
Octanal is known to be produced from lipid peroxidation (16) and has been detected in oxidized low-density lipoprotein (oxLDL) (29). The octanal present in oxLDL activated Ca2+ flux in LPS-primed WT, but not Olfr2−/− BMDMs (fig. S9, E and F). To measure octanal in body fluids, tissues, and feces, we developed a 3-nitrophenylhydrazine derivatization (Fig. 3A) allowing detection of octanal by mass spectrometry. Plasma from WT C57BL/6 mice eating a chow diet (CD) contained just under 2 μM octanal, which was doubled by feeding a high-fat western diet (WD, Fig. 3B). Apoe−/− mouse plasma contained ~7 μM octanal, which was further increased to ~9 μM by feeding a WD (Fig. 3C). Similar results were obtained in Ldlr−/− mice (Fig. 3D). However, the WD does not contain more octanal than the CD (Fig. 3E), implying that the relevant octanal source was not directly from food.
Fig. 3. Octanal is present in mouse and human plasma and increases with high-fat diet.
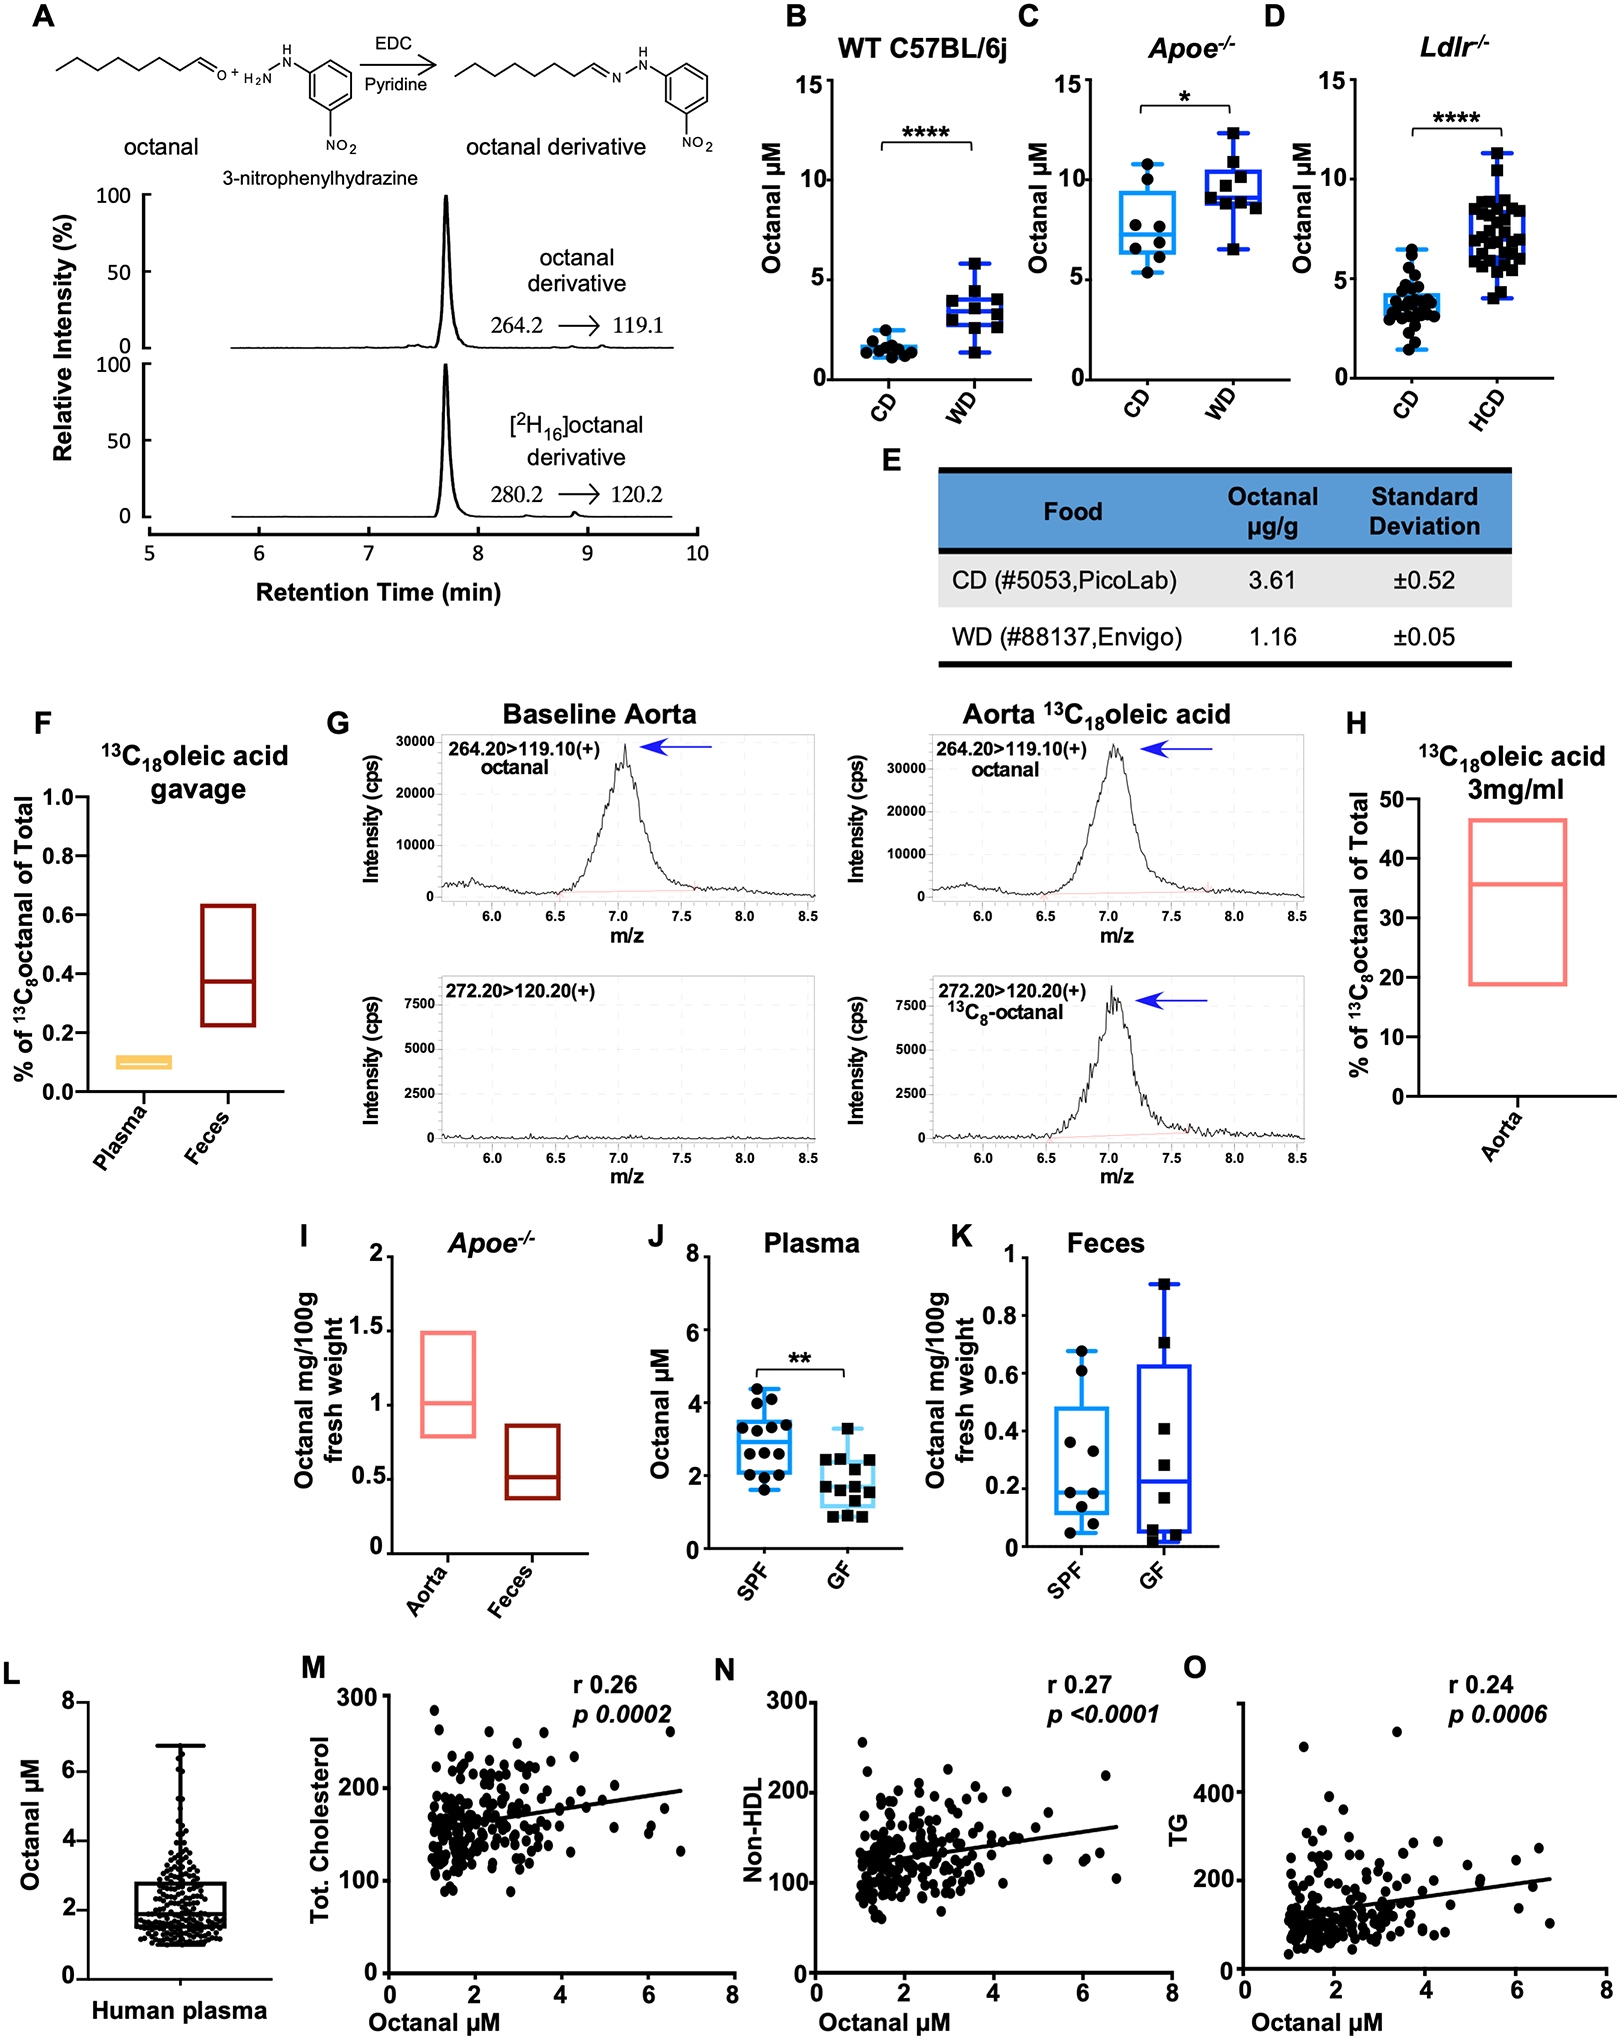
(A) Murine and human blood plasma was analyzed for octanal by derivatization and stable isotope dilution liquid chromatography with tandem mass spectrometry. [2H16] octanal was spiked into plasma before the derivatization reaction as internal standard. (B) Male WT C57BL/6J, (C) Apoe−/− and (D) Ldlr−/− mice were fed a chow diet (CD), western diet (WD), or high-cholesterol diet (HCD). Plasma was analyzed for octanal concentrations [n = 9 or 10 mice per group for (B) and (C), and n = 19 or 20 mice for (D)]. (E) Octanal concentration in pellets of CD and WD mouse food (n = 3 pellets). (F) Percentage of 13C8 octanal versus total octanal in blood plasma and feces of mice (n = 5 mice) gavaged with 3 mg 13C18 oleic acid. (G and H) 13C8 octanal detection in aorta harvested from Apoe−/− mice (n = 4 mice) and incubated with or without (baseline) 3 mg/ml 13C8 oleic acid for 12 hours. (G) Extracted chromatograms in positive-ion multiple reaction monitoring (MRM) mode of octanal (left) and 13C8 octanal (right) after reaction with 3-nitrophenylhydrazine with parent to daughter transitions, 264.2→119.1, 272.2→120.2, respectively. (H) 13C8 octanal, percent of total octanal detected in Apoe−/− mouse aortas. (I) Octanal in snap frozen aorta and feces from Apoe−/− mice on a CD (n = 3 mice each). Octanal in plasma (J) and feces (K) of germ-free (GF, n = 14) and conventional C57BL/6J (SPF, n = 14) mice. (L) Human blood plasma analyzed for octanal concentrations (n = 196 human specimens). Correlation of plasma octanal with (M) total cholesterol, (N) non-HDL cholesterol, and (O) triglycerides (TG). P values and correlation coefficients (r) were calculated by Spearman’s rank analysis. Data are presented as mean ± SEM, unless otherwise specified. *P < 0.05, **P < 0.01, ****P < 0.0001. P calculated by unpaired t test with Welch correction.
Lipid peroxidation of oleic acid can be a source of octanal (30, 31). To test this, we gavaged mice with 3 mg 13C18 oleic acid. After 24 hours, a small fraction of octanal in plasma (<0.1%) and feces (<1%) was 13C8 octanal (Fig. 3F and fig. S12, A to E), consistent with most oleic acid being endogenously produced in enterocytes by stearoyl-CoA desaturase-1 (SCD1) (32). Lipid peroxidation is known to occur in the atherosclerotic aorta (33). To determine whether octanal can be produced in situ in the vasculature, we cultured atherosclerotic Apoe−/− aortas in the presence of 3 mg/ml of 13C18 oleic acid for 12 hours. High levels (~35%) of 13C8 octanal in aorta were detected (Fig. 3, G and H), suggesting that octanal can derive from oleic acid in the atherosclerotic aorta. However, whether oxLDL is a major source of octanal is still not entirely clear.
Octanal was detected in atherosclerotic Apoe−/− aorta at an average concentration of 1 mg/100 g tissue fresh weight (Fig. 3I), comparable to ~75 μM. We also found octanal in feces of atherosclerotic Apoe−/− mice at a concentration of 0.5 mg/100 g fresh weight (Fig. 3I), comparable to ~18 μM. Thus, there is much more octanal in the aorta and feces than in plasma. Plasma octanal was significantly reduced in germ-free (GF) mice (Fig. 3J). However, feces from GF mice contained similar levels of octanal as feces from specific pathogen–free (SPF) controls (Fig. 3K), suggesting that gut microbiota are not needed for octanal production. To translate these findings to humans, we measured octanal in 196 subjects (tables S1 and S2) and found octanal levels similar to those in mice (Fig. 3L). Octanal was significantly positively correlated with total cholesterol, non–high-density lipoprotein (HDL) cholesterol, LDL, and triglycerides (Fig. 3, M to O, and table S2). These data support the idea that octanal could be relevant for atherosclerosis in both mice and humans.
To directly test the impact of octanal in vivo, we used three mouse models: Ldlr−/− mice reconstituted with Olfr2−/− or Rtp1/2dKO bone marrow, in each case compared with Ldlr−/− mice receiving WT bone marrow, and Apoe−/− mice treated with octanal. Apoe−/− mice fed a WD for 4 weeks were injected with octanal (10 μg per gram of body weight intraperitoneally) every 3 days for the last 4 weeks of the study (Fig. 4A), which more than doubled octanal levels in the plasma (Fig. 4B). En face lesion staining of aortic arches and cross sections of aortic roots (34) showed that octanal treatment more than doubled lesion size (Fig. 4, C to E). Octanal treatment induced a systemic increase of tumor necrosis factor (TNF) and IL-1β levels in the plasma (fig. S13A) but had no effect on total cholesterol, LDL cholesterol, HDL cholesterol, triglycerides, or other blood parameters (fig. S13B). Apoe−/− mice treated with citral (10 μg per gram of body weight, 12 injections over 4 weeks; fig. S14A) showed ~40% reduction in atherosclerotic lesion size (fig. S14, B and C) with no effect on body weight, lipids, or leukocytes (fig. S14D). These findings suggest that endogenous levels of octanal are sufficient to induce a pathophysiologically relevant activation of Olfr2 that exacerbates atherosclerosis, which is amplified by boosting octanal levels.
Fig. 4. Octanal supplementation exacerbates atherosclerosis, whereas genetic targeting of Olfr2 ameliorates atherosclerosis.
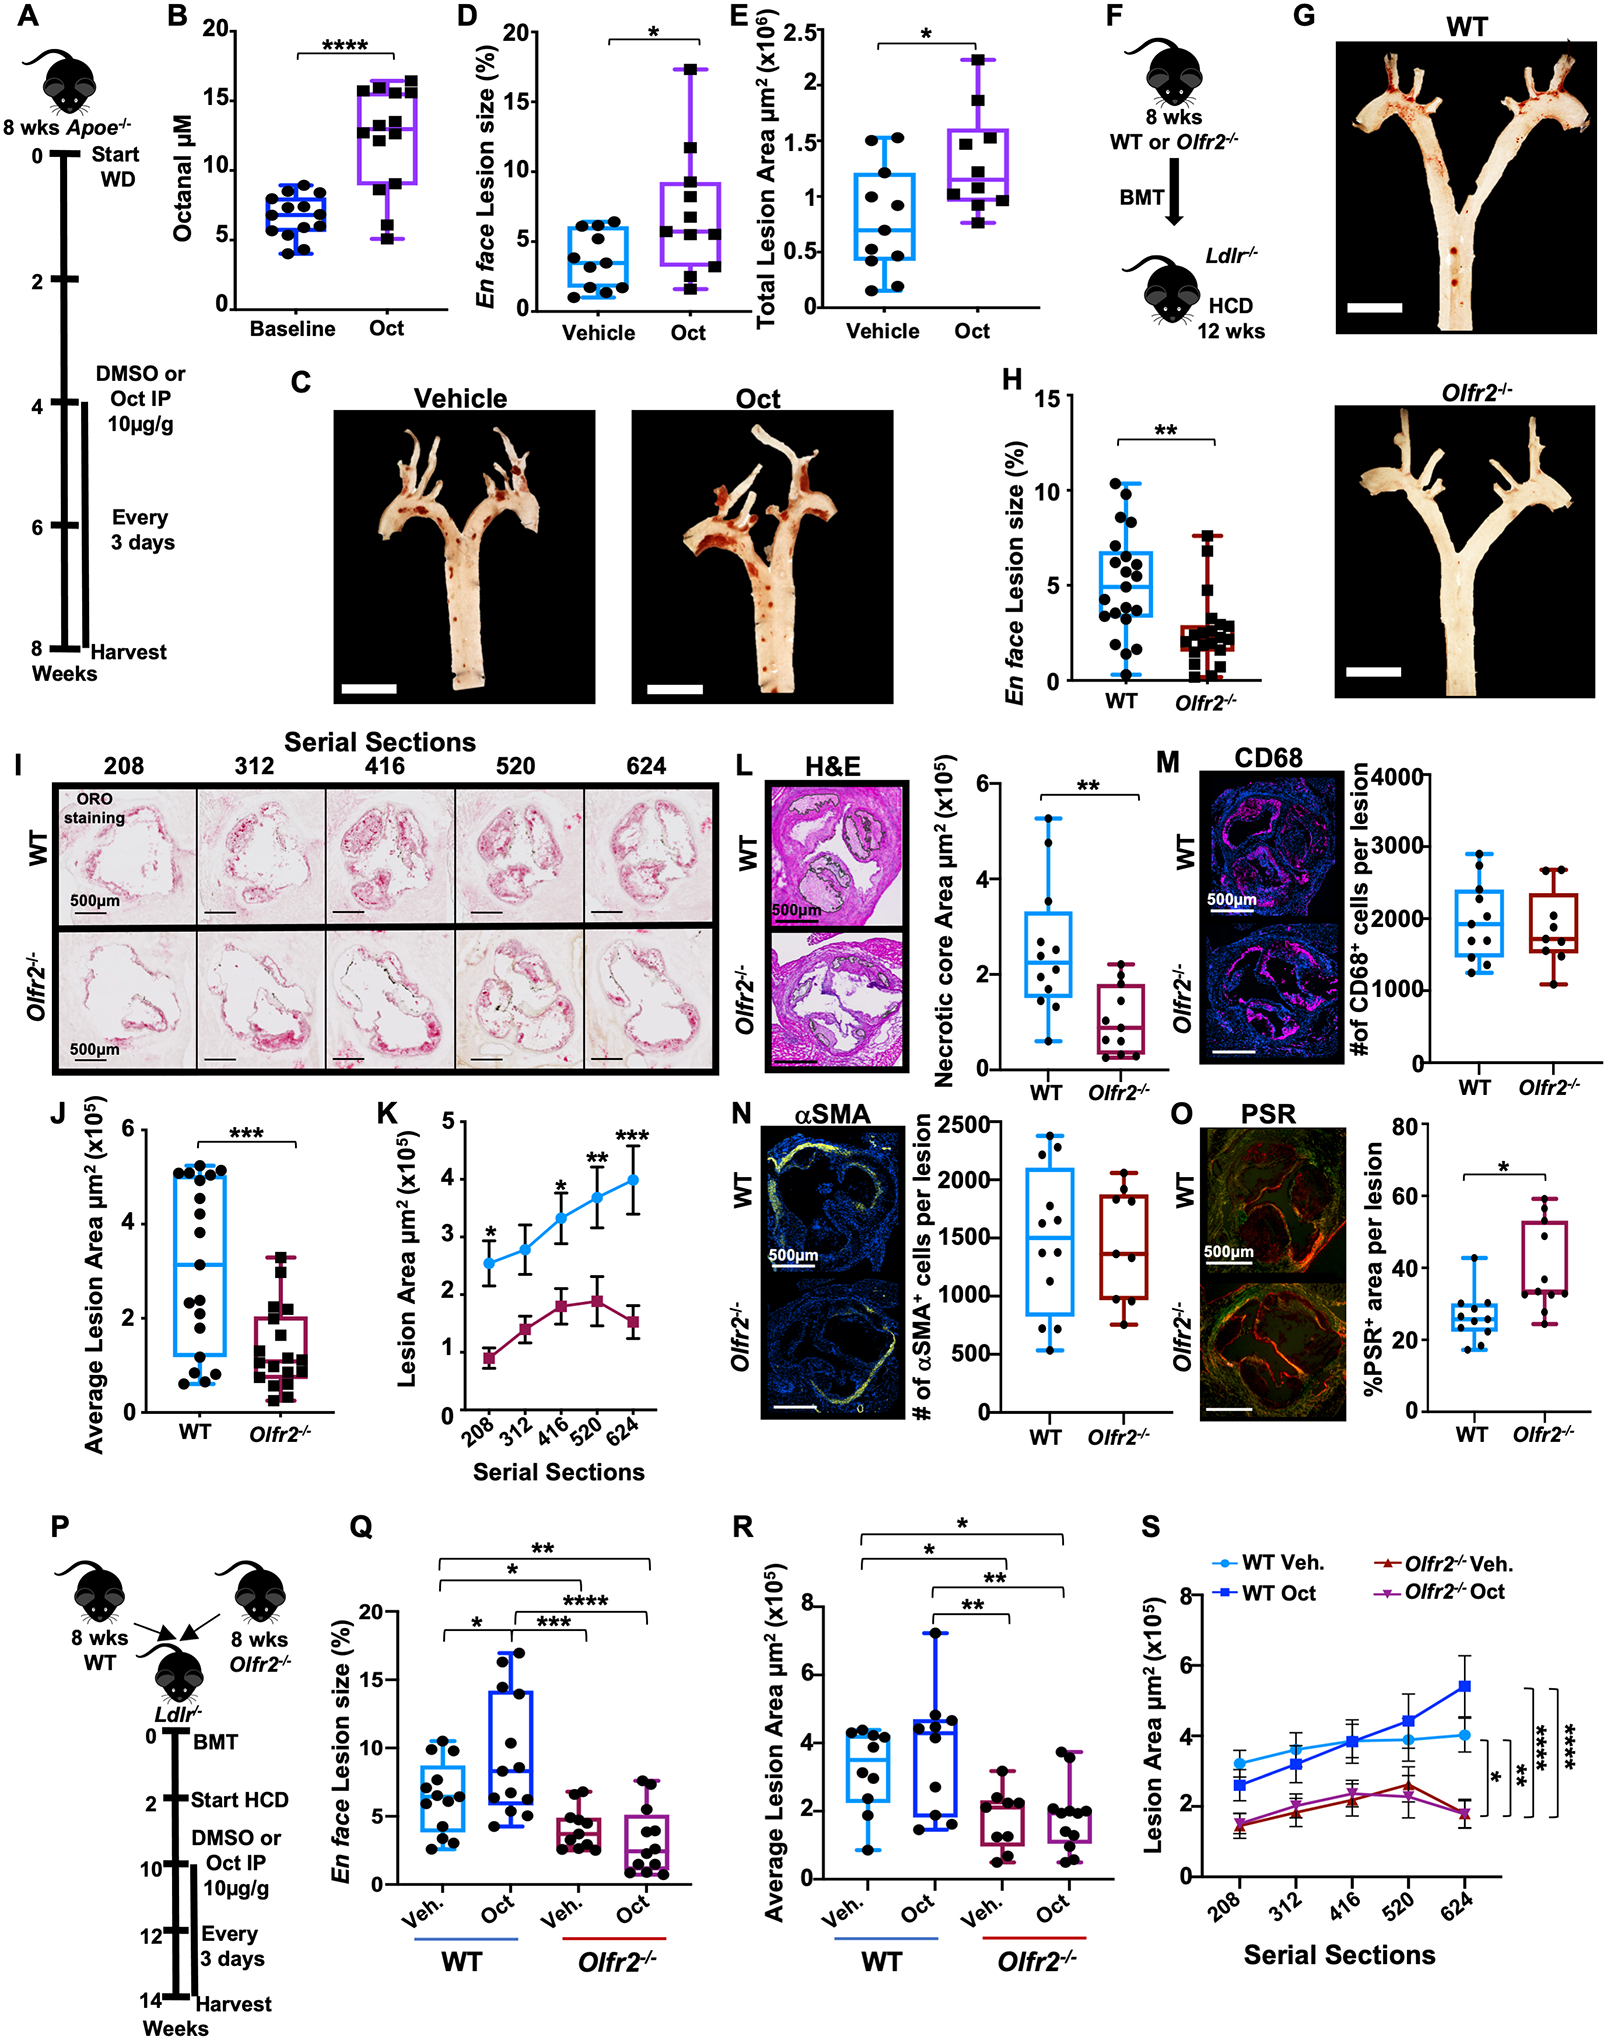
(A) Treatment protocol for (B) to (E). (B) Octanal in the plasma before treatment (baseline) and after 4 weeks of octanal treatment (n = 14 mice per group). (C) Pinned aortic arches of vehicle- or octanal-treated mice. Scale bars, 5 mm. (D) En face atherosclerotic lesion size in aortic arches, percent of area (n = 10 or 11 mice per group). (E) Plaque area (square micrometers) in aortic root serial sections from the same mice. (F) Treatment protocol for (G) to (O). Ldlr−/− mice (n = 19 or 20 mice per group) were lethally irradiated and reconstituted with WT or Olfr2−/− bone marrow and fed a HCD for 12 weeks. (G) Pinned aortic arches of chimeric WT Ldlr−/−and Olfr2−/− Ldlr−/− mice. Scale bars, 5 mm. (H) Aortic arch lesion size as percent of analyzed arch area. (I) Aortic root sections starting from the valve plane stained for Oil Red O (ORO), representative out of 100 sections analyzed per group (n = 19 or 20 mice per group; distance from valve plane in micrometers). Plaque area (square micrometers) for (J) total sections and (K) each aortic root section as a function of position (n = 19 or 20 mice per position). Root lesions (G) to (K) (n = 11 or 12 mice per group): (L) Necrotic core area per lesion, H&E. (M) Total number (#) of CD68+ (magenta) macrophages per lesion. (N) Total number of smooth muscle cells per lesion (αSMA+ cells, yellow; Hoechst, blue). (O) Collagen content by picrosirius red (PSR) and circular dichroism. Scale bars, 500 μm. (P) Treatment protocol for (Q) to (S). Ldlr−/− mice (n = 11 to 13 per group) were lethally irradiated and reconstituted with WT or Olfr2−/− bone marrow. Mice were fed a HCD for 8 weeks, injected every 3 days intraperitoneally with octanal (Oct, 10 μg per gram of body weight) or vehicle for the remaining 4 weeks of the study. (Q) Aortic arch lesions en face, percent of analyzed area. (R) Plaque area (square micrometers) quantification for root sections (n = 9 to 12 per group) and (S) each aortic root section as a function of position. Data are presented as mean ± SEM. *P < 0.05, **P < 0.01, ***P < 0.001, ****P < 0.0001. P calculated by two-way ANOVA and Tukey’s multiple comparisons test for (K) and (Q) to (S) [only the comparisons vehicle (Veh.) versus octanal (Oct.) for section 624 are reported; for the full comparison analysis, see fig. S17B] and unpaired t test with Welch correction for (B), (D), (E), (H), (J), and (L) to (O).
To directly test the impact of Olfr2 on atherosclerosis, we reconstituted Ldlr−/− mice with Olfr2−/− bone marrow (Fig. 4F). These mice developed ~50% smaller en face aortic lesions on a HCD than littermate controls reconstituted with WT bone marrow (Fig. 4, G and H). Body weight, blood lipids, and leukocyte counts were unaffected (fig. S15). From the same mice, we prepared serial sections of aortic roots (Fig. 4I), starting from the valve plane (34). Oil Red O positively stained lesion area was significantly larger in Ldlr−/− mice receiving WT bone marrow than those receiving Olfr2−/− bone marrow, measured as total lesion area (Fig. 4J) or as a function of the distance from the valve plane (Fig. 4K). The necrotic core area detected by hematoxylin and eosin (H&E) staining was significantly reduced in Olfr2−/− bone marrow recipient mice (Fig. 4L), accounting for most of the reduction in the atherosclerotic lesion size. Macrophage and smooth muscle content (Fig. 4, M and N) remained unchanged. Olfr2−/− lesions showed significantly increased collagen content (Fig. 4O).
Ldlr−/− mice lethally irradiated and reconstituted with bone marrow cells from Rtp1/2dKO mice (dKO, double knockout) (35) showed significantly reduced Olfr2 expression and aortic arch lesions compared with WT controls (fig. S16, A to C). Body weight, blood lipids, and leukocytes were unaffected (fig. S16D). Bone marrow transplanted Ldlr−/− mice fed a HCD and treated with octanal for 4 weeks (Fig. 4P) showed significantly increased lesion size en face (Fig. 4Q) in WT, but not Olfr2−/−, recipients. Atherosclerotic lesions en face and in aortic root serial sections (Fig. 4, Q to S) were significantly smaller in Olfr2−/− recipients, demonstrating that Olfr2 is a disease-relevant octanal receptor in vivo. Body weight, blood lipids, and leukocyte counts were unaffected (fig. S17).
Here, we have demonstrated that the octanal receptor Olfr2 in mouse and OR6A2 in human vascular macrophages in conjunction with TLR4 ligation induces inflammasome activation in response to octanal, leading to IL-1α and IL-1β protein production and secretion. This, together with other inflammatory cytokines, likely explains the large impact of Olfr2 in mouse models of atherosclerosis. The source of octanal appears to be lipid peroxidation from oleic acid, which is most pronounced in the atherosclerotic aorta. We propose that drug-like small molecules targeting OR6A2 and possibly other OLFRs may constitute novel therapeutic targets for the treatment, prevention, and reversal of atherosclerosis.
Supplementary Material
ACKNOWLEDGMENTS
We thank J. Miller for support maintaining the mouse colony; the histology core, in particular K. Dobaczewska and M. Meyer, for help with histology and immunostaining; and the flow cytometry core at the La Jolla Institute for Immunology.
Funding:
This work was supported by grants to M.Or. from the American Heart Association (AHA18POST34060251), the Tullie and Rickey Families SPARK Awards at La Jolla Institute, and the Conrad Prebys Foundation Award. H.W. was supported by Deutsche Forschungsgemeinschaft (GZ WI 4811/1-1). S.M. was supported by an Imaging Scientist grant from the Chan Zuckerberg Initiative. Z.F. was supported by grant R01 HL 145454 and AHA 18CDA34110426. L.E. was supported by grant NIH DK 120515. S.L.H. was supported in part by the National Institutes of Health and the Office of Dietary Supplements grants HL103866, HL126827, and DK106000. Z.W. was supported by NIH HL 130819. K.L. was supported by grants NIH HL 115232, 145241, HL088093, and a grant from Kyowa Kirin. The Aria-3 cell sorter was supported by the Shared Instrumentation Grant Program RR027366, and the Zeiss LSM 880 confocal microscope was funded by NIH S10OD021831.
Competing interests:
Z.W. and S.L.H. are named as co-inventors on pending and issued patents: US Patent 9,086,425 2016; US Patent 9,265,736 2018; US Patent 10,064,830 2019; US Patent App. 16/281,811 2020; US Patent 10,551,372 2021; US Patent 10,983,100 2021; and US Patent App. 16/965,629 held by the Cleveland Clinic relating to cardiovascular diagnostics and therapeutics, and they receive royalty payments for inventions or discoveries related to cardiovascular diagnostics or therapeutics from Cleveland Heart Lab, Quest Diagnostics, and Proctor & Gamble. S.L.H. also reports having been paid as a consultant by Proctor & Gamble and having received research funds from Proctor & Gamble and Roche. M.Or. and K.L. are named as co-inventors on US Patent App. 17/048,059 held by the La Jolla Institute for Immunology relating to cardiovascular diagnostics and therapeutics and may receive royalty payments for inventions or discoveries related to cardiovascular diagnostics or therapeutics. H.M. has received royalties from ChemCom. H.M has received research grants from Givaudan. H.M has received consultant fees from Kao. E.L. is a cofounder of and consultant to IFM Therapeutics. None of the other authors have any competing interests.
Footnotes
SUPPLEMENTARY MATERIALS
Data and materials availability:
All data generated and supporting the findings of this study are available in the paper or supplementary materials. Olfr2−/− mice are available upon request to K.L. The recipient will need to pay for shipping, and there is a fee for breeding, genotyping, and packing. Additional information and materials will be made available upon request to K.L.
REFERENCES AND NOTES
- 1.Buck L, Axel R, Cell 65, 175–187 (1991). [DOI] [PubMed] [Google Scholar]
- 2.Rouquier S, Blancher A, Giorgi D, Proc. Natl. Acad. Sci. U.S.A 97, 2870–2874 (2000). [DOI] [PMC free article] [PubMed] [Google Scholar]
- 3.Saito H, Kubota M, Roberts RW, Chi Q, Matsunami H, Cell 119, 679–691 (2004). [DOI] [PubMed] [Google Scholar]
- 4.Li F et al. , J. Neurosci 33, 7975–7984 (2013). [DOI] [PMC free article] [PubMed] [Google Scholar]
- 5.Silva Teixeira CS, Cerqueira NM, Silva Ferreira AC, Chem. Senses 41, 105–121 (2016). [DOI] [PubMed] [Google Scholar]
- 6.Antunes G, Simoes de Souza FM, Methods Cell Biol 132, 127–145 (2016). [DOI] [PubMed] [Google Scholar]
- 7.Ferrer I et al. , Front. Aging Neurosci 8, 163 (2016). [DOI] [PMC free article] [PubMed] [Google Scholar]
- 8.Lee SJ, Depoortere I, Hatt H, Nat. Rev. Drug Discov 18, 116–138 (2019). [DOI] [PubMed] [Google Scholar]
- 9.Li JJ et al. , PLOS ONE 8, e80148 (2013). [DOI] [PMC free article] [PubMed] [Google Scholar]
- 10.Cochain C et al. , Circ. Res 122, 1661–1674 (2018). [DOI] [PubMed] [Google Scholar]
- 11.Zernecke A et al. , Circ. Res 127, 402–426 (2020). [DOI] [PMC free article] [PubMed] [Google Scholar]
- 12.McArdle S et al. , Circ. Res 125, 1038–1051 (2019). [DOI] [PMC free article] [PubMed] [Google Scholar]
- 13.Araneda RC, Peterlin Z, Zhang X, Chesler A, Firestein S, J. Physiol 555, 743–756 (2004). [DOI] [PMC free article] [PubMed] [Google Scholar]
- 14.Li Y et al. , ACS Chem. Biol 9, 2563–2571 (2014). [DOI] [PMC free article] [PubMed] [Google Scholar]
- 15.Araneda RC, Kini AD, Firestein S, Nat. Neurosci 3, 1248–1255 (2000). [DOI] [PubMed] [Google Scholar]
- 16.Rizzo WB, Biochim. Biophys. Acta Mol. Cell Biol. Lipids 1841, 377–389 (2014). [DOI] [PMC free article] [PubMed] [Google Scholar]
- 17.Feil S et al. , Circ. Res 115, 662–667 (2014). [DOI] [PubMed] [Google Scholar]
- 18.Bennett MR, Sinha S, Owens GK, Circ. Res 118, 692–702 (2016). [DOI] [PMC free article] [PubMed] [Google Scholar]
- 19.Bozza T, Feinstein P, Zheng C, Mombaerts P, J. Neurosci 22, 3033–3043 (2002). [DOI] [PMC free article] [PubMed] [Google Scholar]
- 20.Folkersen L et al. , Mol. Med 18, 669–675 (2012). [DOI] [PMC free article] [PubMed] [Google Scholar]
- 21.Miller YI, Future Cardiol 1, 785–792 (2005). [DOI] [PubMed] [Google Scholar]
- 22.Camarena V et al. , eLife 6, e29750 (2017). [DOI] [PMC free article] [PubMed] [Google Scholar]
- 23.Yaron JR et al. , Cell Death Dis 6, e1954 (2015). [DOI] [PMC free article] [PubMed] [Google Scholar]
- 24.Swanson KV, Deng M, Ting JP, Nat. Rev. Immunol 19, 477–489 (2019). [DOI] [PMC free article] [PubMed] [Google Scholar]
- 25.Tsuchiya K et al. , Cell Rep 34, 108887 (2021). [DOI] [PubMed] [Google Scholar]
- 26.Coll RC et al. , Nat. Med 21, 248–255 (2015). [DOI] [PMC free article] [PubMed] [Google Scholar]
- 27.McKenzie BA et al. , Proc. Natl. Acad. Sci. U.S.A 115, E6065–E6074 (2018). [DOI] [PMC free article] [PubMed] [Google Scholar]
- 28.Hu JJ et al. , Nat. Immunol 21, 736–745 (2020). [DOI] [PMC free article] [PubMed] [Google Scholar]
- 29.Esterbauer H, Wäg G, Puhl H, Br. Med. Bull 49, 566–576 (1993). [DOI] [PubMed] [Google Scholar]
- 30.Morales MTR, Rios JJ, Aparicio R, Agric J. Food Chem 45, 2666–2673 (1997). [Google Scholar]
- 31.Xu L, Yu X, Li M, Chen J, Wang X, Int. J. Food Prop 20 (suppl. 3), S2926–S2938 (2017). [Google Scholar]
- 32.Mukherjee P et al. , J. Lipid Res 59, 1818–1840 (2018). [DOI] [PMC free article] [PubMed] [Google Scholar]
- 33.Piotrowski JJ, Hunter GC, Eskelson CD, Dubick MA, Bernhard VM, Life Sci 46, 715–721 (1990). [DOI] [PubMed] [Google Scholar]
- 34.Daugherty A et al. , Arterioscler. Thromb. Vasc. Biol 37, e131–e157 (2017). [DOI] [PubMed] [Google Scholar]
- 35.Sharma R et al. , eLife 6, e21895 (2017). [Google Scholar]
Associated Data
This section collects any data citations, data availability statements, or supplementary materials included in this article.
Supplementary Materials
Data Availability Statement
All data generated and supporting the findings of this study are available in the paper or supplementary materials. Olfr2−/− mice are available upon request to K.L. The recipient will need to pay for shipping, and there is a fee for breeding, genotyping, and packing. Additional information and materials will be made available upon request to K.L.