

Abstract
Latrophilin‐3 (LPHN3) is a brain specific G‐protein coupled receptor associated with increased risk of attention deficit hyperactivity disorder (ADHD) and cognitive deficits. CRISPR/Cas9 was used to generate a constitutive knockout (KO) rat of Lphn3 by deleting exon 3, based on human data that LPHN3 variants are associated with some cases of ADHD. Lphn3 KO rats are hyperactive with an attenuated response to ADHD medication and have cognitive deficits. Here, we tested KO, heterozygous (HET), and wildtype (WT) rats to determine if there was a gene‐dosage effect. We tested the rats in home‐cage activity starting at postnatal day (P)35 and P50, followed by tests of egocentric learning (Cincinnati water maze [CWM]), spatial learning (Morris water maze [MWM]), working memory (radial water maze [RWM]), incidental learning (novel object recognition [NOR]), acoustic startle response (ASR) habituation, tactile startle response (TSR) habituation, prepulse modification of acoustic startle, shuttle‐box passive avoidance, conditioned freezing, and a mirror image version of the CWM. KO and HET rats were hyperactive. KO and HET rats had egocentric (CWM) and spatial deficits (MWM), increased startle response, and KO rats showed less conditioned freezing on contextual and cued memory; there were no effects on working memory (RWM) or passive avoidance. The selective gene‐dosage effect in Lphn3 HET rats indicates that Lphn3 exhibits dominate expression on functions where it is most abundantly expressed (striatum, hippocampus) but not on behaviors mediated by regions of low expression. The data add further evidence to the impact of this synaptic protein on brain function and behavior.
Keywords: adhesion G protein‐coupled receptor L3, egocentric learning, gene dosage, gene expression, Latrophilin‐3, Lphn3 heterozygosity, Lphn3 knockout, rat, reference memory, spatial learning, startle, synaptic protein
The synaptic protein LPHN3 that is associated with ADHD, shows gene dosage effects on tests of learning, memory and startle in Lphn3 homozygotic knockout rats compared with Lphn3 heterozygotic rats, and heterozygotic rats differ from WT controls.
1. INTRODUCTION
Latrophilin‐3 (LPHN3) is an orphan G‐protein‐coupled receptor (GPCR) belonging to the adhesion GPCR family (also named adhesion G protein‐coupled receptor L3 (ADGRL3) [OMIM 616417]). It is involved in the regulation of dopaminergic and glutamatergic synaptic plasticity. Gene variants of LPHN3 are associated with attention deficit hyperactivity disorder (ADHD). 1 , 2 , 3 Of the 21 LPHN3 variants linked with ADHD, eight are in noncoding and 13 in coding regions 4 but how a variant contributes to ADHD is unknown. When present, a variant increases the risk of ADHD by 1.2‐fold and is associated with symptom severity, symptom persistence, and medication response. 1 , 5 Patients with two LPHN3 variants often exhibit cognitive deficits, as do some children with ADHD 6 , 7 not associated with LPHN3. LPHN3 variants are also associated with substance abuse disorder. 8 , 9
Central nervous system (CNS) loss of function mutations in which heterozygous (HET) expression is not different from wildtype (WT), 10 generally indicates that the gene is recessive, whereas impaired function in HET animals suggests a dominant gene. 11 Using CRISPR/Cas9 gene editing we deleted exon 3 in Sprague Dawley rats. Homozygous null mutant rats (Lphn3 KO) exhibit hyperactivity, acoustic startle hyper‐reactivity, reduced locomotor response to amphetamine relative to baseline, impaired egocentric and allocentric learning and memory (L&M), and impaired cognitive flexibility. 12 , 13 Neurochemically, Lphn3 KO rats exhibit altered dopaminergic markers. 13 Lphn3 KO rats also have increased striatal spontaneous dopamine release in amount and frequency measured by fast scan cyclic voltammetry. 14 To test gene dosage, we compared Lphn3 KO rats with Lphn3 HET and WT littermates controlling for litter effects.
2. METHODS
2.1. Animal husbandry
Lphn3 −/− (KO) Sprague Dawley rats were generated as described. 12 Rats were housed in polysulfone cages in a pathogen free vivarium using a Modular Animal Caging System (Alternative Design, Siloam Spring, AR) with HEPA filtered air with 30 air changes/h (Alternative Design, Siloam Spring, AR). Water was provided ad libitum using an automated reverse‐osmosis filtering/UV sterilizing system (SE Lab Group). Rats had ad libitum access to NIH‐07 rat chow (LabDiet #5018), and were housed in cages with woodchip bedding and stainless‐steel enclosures for enrichment. 15 Rats were maintained on a 14 h light‐10 h dark cycle (lights on at 600 h). For breeding, multiparous Lphn3 +/− females were cohabitated with Lphn3 +/− males and cages checked for sperm plugs daily. When sperm plug positive, females were placed in a separate cage. Ear punches were collected from offspring at postnatal day (P)7 for genotyping using three primers: 1. AAAGGGTCATAGCATCCGGC, 2. CTAACGTGGCTTTTTGTCTTCT, and 3. CTCGACAGACAGTGTGGAT. HotStarTaq Master Mix kit (Qiagen Hilden) was used with manufacturer's recommended concentrations and DMSO. The thermocycler parameters were: (1) 94°C for 3 min, (2) repeat 94°C for 3 min, 61.5°C for 30 s, and (4) 72°C for 1 min. Steps 2–4 were repeated 15 times, followed by (5) 94°C for 30 s, (6) 59.2 °C for 30 s, and (7) 72°C for 1 min. Steps 5–7 were repeated 20 times followed by (8) 72°C for 10 min and (9) 4°C to completion. The product was run on a 2% agarose gel and stained with ethidium bromide. The WT band is present at ~320 bp and the KO band at ~452 bp. HET rats have both bands.
Dams were removed from litters on P28, and offspring rehoused two per cage of the same sex. Testing began on P35 with one rat per genotype per sex per litter in order to control for litter effects. In litters with more than one rat per genotype per sex, the rat tested was selected randomly with the use of a random numbers table. Testing was done by personnel blind to genotype. The vivarium is accredited by AAALAC International. Protocols were approved by the Cincinnati Children's Research Foundation Institutional Animal Care and Use Committee.
2.2. Behavioral methods
Rats were tested first for home‐cage locomotor activity at P35 (n = 115 from 30 litters) and P50 (32 litters). Following home‐cage, 19 WT female, 19 WT male, 17 HET female, 19 HET male, 14 KO female, and 16 KO male rats from 27 different litters were further tested. Adult offspring received the following: Straight channel swimming, Cincinnati water maze (CWM), Morris water maze (MWM), radial water maze (RWM), novel object recognition (NOR), acoustic startle (ASR), tactile startle (TSR) habituation, prepulse inhibition of ASR, passive avoidance, conditioned freezing, and a mirror‐image version of the CWM. Approximately, 2 weeks after testing, rats were euthanized, brains removed, cut in 2 mm sections using a brain block, and dissected over ice. The following regions were dissected: hippocampus (hipp), caudate‐putamen (CPu), nucleus accumbens (nAcc), and prefrontal cortex (PFC), and tissues were frozen over dry ice and stored at −80°C. Behavioral equipment was cleaned between rats with Process NPD solution (STERIS Life Sciences, Mentor, OH) an EPA approved, non‐toxic denaturing, antibacterial, antiviral agent.
2.3. Home‐cage activity
Rats were singly housed in standard clear cages for this test. 16 Each cage was positioned in a metal frame that contained infrared photodetectors spaced 5 cm apart along the X and Y axes. The frame was adjusted to be 2 cm above the bottom of the cage. Forty‐eight hour data were analyzed in 2 h intervals (PAS System, San Diego Instruments).
2.4. Straight channel
Rats were trained to escape from a 244 cm long × 15 cm wide × 50 cm high straight channel filled halfway with water for four back‐to‐back trials (limit 2 min/trial). The intertrial interval (ITI) was ~10 s, the time it took the experimenter to remove the rat from the goal and place it back at the starting point. Latency to reach a submerged platform at the opposite end was recorded. The test acclimates rats to swimming and provides experience escaping using the platform. Latencies were compared to ensure that all groups had equivalent swimming performance and motivation to escape.
2.5. Cincinnati water maze
CWM assesses egocentric navigation 17 (implicit learning). The maze consists of 10 T‐shaped cul‐de‐sacs that branch from a central channel extending from the start to the goal where an escape platform is located. The maze is illustrated in Figure 2B. To exclude distal cues, testing was conducted in the dark using infrared LED emitters. A video camera sensitive to infrared light was mounted above the maze and connected to a monitor in an adjoining room where the experimenter monitored performance. Rats were acclimated to the dark for at least 5 min prior to testing. Rats were scored for latency to reach the goal and errors. Errors were defined as head and shoulder entry into the stem or arm of a T‐shaped cul‐de‐sac. Rats that reached the time limit but stopped searching had errors adjusted to the rat making the most errors. There were two trials per day for 18 days. If a rat did not find the platform in 5 min on trial‐1 of a given day, it was placed in a holding cage for an ITI of at least 5 min before trial‐2 was given, otherwise trials were given back‐to‐back (ITI ~15 s). If a rat reached the time limit, it was removed from the maze wherever it was when time ran out, no guidance was provided.
FIGURE 2.
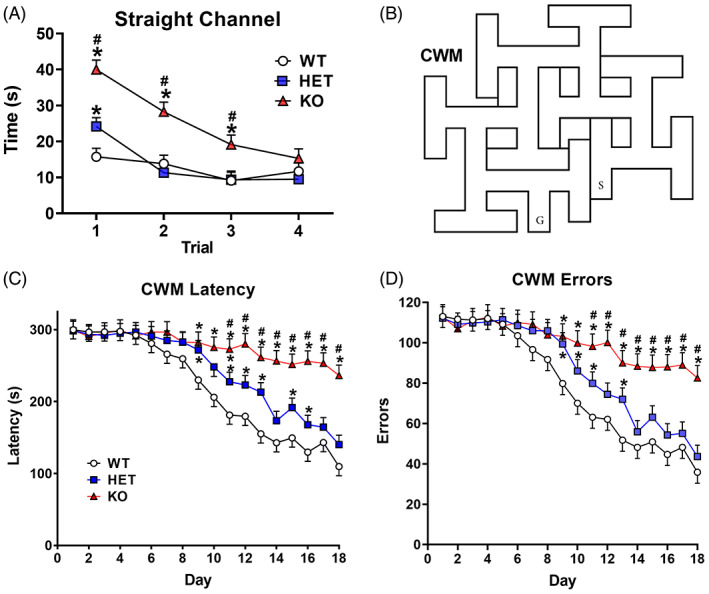
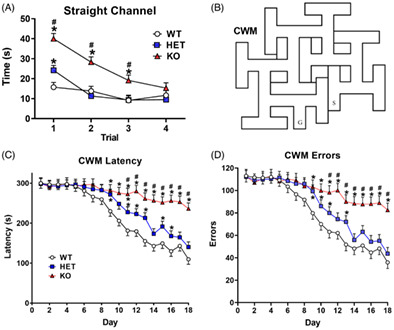
Straight channel and Cincinnati water maze. (A) Latency (mean ± SEM) to find the platform during straight channel swimming trials. (B) Schematic of the CWM. (C) Cincinnati water maze (CWM) latency by day for 18 days of testing (two trials/day; mean ± SEM). (D) Errors in the CWM by day for 18 days. wildtype (WT): n = 19 F, 19 M; heterozygous (HET): n = 17 F, 19 M; knockout (KO): n = 14 F, 16 M. *Significantly different from WT rats; #KO rats significantly different from HET rats
2.6. Morris water maze
To assess allocentric learning and memory, rats were tested in a MWM. 18 , 19 The tank is made of black laminated polyethylene and is 244 cm in diameter and 51 cm deep, filled halfway with water. Curtains are mounted on tracks on the ceiling that could be opened or closed to expose or hide distal cues (geometric shapes and posters). Rats were tested in four phases: acquisition, reversal, shift, and cued. The first three phases consisted of four trials per day for 6 days; the cued phase was four trials/day for 2 days. Two probe trials were given during each of the first three phases: one on day‐3 before platform trials were given and one 24 h after the last platform trial on day‐7. Probe trials lasted 45 s. On platform trials, the time limit was 2 min. Rats were tested in rotation, that is, all rats in a set, balanced for genotype and sex, completed trial‐1 before being given trial‐2, and so forth. (ITI at least 5 min between trials). If a rat did not find the platform within 2 min, it was removed and placed on the platform for 5 s (no guidance was provided). During platform trials, the platform was 2 cm below the surface and located halfway between the center and the tank wall. For acquisition, a 10 cm diameter platform was placed in the SW quadrant. Rats were started from one of two cardinal and two ordinal positions around the perimeter in a pseudo‐random order. During reversal, a 7 cm diameter platform was positioned in the NE quadrant and start positions adjusted accordingly. In the shift phase, a 5 cm diameter platform was placed in the NW quadrant and start positions adjusted. A camera mounted above the maze was synchronized to a computer with video tracking software (AnyMaze, Stoelting Co.). For learning trials, dependent variables were latency, path efficiency, and swim speed. Dependent measures on probe trials were average distance to the former platform site, quadrant entries, and swim speed.
The fourth phase was cued. Curtains were closed around the pool to conceal distal cues to assess proximal cue learning. A plastic ball that protruded 10 cm above the water was affixed atop a metal rod mounted at the center of the 10 cm diameter platform. Rats were given four trials/day for 2 days. Positions of the platform and start were randomized on every trial to prevent use of any residual distal cues a rat might detect.
The maze tests explicit/spatial/allocentric learning and reference memory (probe trials). Acquisition assesses spatial learning, reversal assesses cognitive flexibility, and shift is a more challenging test of cognitive flexibility.
2.7. Radial water maze
To assess working memory, rats were tested in an 8‐arm RWM. 20 The tank was 208 cm diameter x 56 cm deep made of black polyethylene and filled with water to a depth of 32 cm. A black polyethylene octagon (60 cm across, 56 cm tall, sides 25 cm long) rested in the center such that rats had to swim around it to reach the arms (55 cm long, 17 cm wide). There were distinctive posters on the walls to serve as distal cues. The start was from arm‐1; the other arms were numbered clockwise, 2–8; each contained a submerged platform. There were seven trials/day for 2 days. Three types of error scores were analyzed: working memory errors when the rat reentered an arm they previously entered, start errors when they reentered the start arm, and total errors. Rats were placed at the start, and time to reach a platform and errors were recorded. Once a platform was reached, the rat was removed after 5–10 s and placed in a holding cage for 30 s while the platform they found was removed, leaving six platforms for trial‐2. This continued until all platforms were found or the allotted time expired. The trial limit per trial was 2 min.
2.8. Novel object recognition
NOR is a test of recognition or incidental learning. 21 Day‐1 was to habituate rats to the apparatus. Each rat was placed in the test box with four unique objects, one in each corner. The test box was 40 cm2 and the sides 40 cm high made of black acrylic (Stoelting Company, Wood Dale, IL). Performance was scored using AnyMaze tracking software (Stoelting Company). Rats were habituated to the arena for 10 min. Day‐2 was familiarization. Rats were placed in the test arena with four identical objects, one in each corner but different objects than on Day‐1. Retention was tested 1 h later by placing the rat back in the box with three identical copies of the familiarization objects plus one new object. Rats remained in the box during familiarization and retention until accumulating 30 s of object exploration time up to a limit of 10 min. One rat escaped, but all others reached the 30 s criterion of attending to objects.
2.9. Acoustic and tactile startle response
ASR and TSR habituation were assessed in an SR‐LAB, 8‐station system (San Diego Instruments, San Diego, CA). Each rat was placed in an acrylic cylindrical holder mounted on a platform with a piezoelectric accelerometer transducer mounted underneath. This assembly was positioned inside a sound‐attenuated cabinet. Each session consisted of a 5 min acclimation period followed by 50 trials of mixed acoustic and tactile pulses (ITI 4–12 s). The acoustic pulse was a 20 ms 120 dB SPL mixed frequency white noise burst (rise time 1.5 ms) and the tactile pulse was a 60‐psi air‐puff to the rat's dorsal surface through a tube mounted through the top of the animal holder. The recording window was 100 ms from pulse onset. The dependent measure was maximum response amplitude measured in mV (V max) analyzed in blocks of 10 trials.
2.10. Acoustic startle with prepulse inhibition
Prepulse inhibition (PPI) was assessed in the same SR‐LAB apparatus. Rats were given 100 trials in a 4 × 4 Latin square sequence of 25 trials of each type repeated four times (ITI 4–12 s). Prepulses were 0, 57, 70, or 80 dB. Trials of the same type were averaged together for analysis. The pulse and recording window were the same as for ASR. Prepulses preceded pulses by 70 ms from prepulse onset to pulse onset (gap was 50 ms). V max was the primary dependent measure.
2.11. Passive avoidance
Passive avoidance, a test of aversively motivated memory 22 was tested using a two‐chamber shuttle‐box (San Diego Instruments). The internal dimensions were 24 cm × 20 cm × 20 cm per side. The floor was a grid of 28 stainless‐steel bars connected to a shock generator with a stainless‐steel gate between the two sides. Eight photodetectors per side were used to record movement. A light was mounted on the ceiling of each side. For training, rats were placed in the illuminated side with the gate closed, while the other side was dark. After 30 s, the gate opened, and the rat had 180 s to crossover. If it entered the dark side, the gate closed and following a 5 s delay, a foot‐shock was delivered through the floor (2 s, 0.9 mA). For retention, each rat was placed back in the lighted side with gate closed. After 10 s the gate opened. The rat again had 180 s to crossover. If the rat crossed, the door was closed, and it was shocked a second time; back‐to‐back trials were continued until the rat remained on the lighted side for 180 s. Once the rat remained on the light side for 180 s the test ended. Rats that did not cross during training were re‐tested a second time; if they still failed to cross again, they were given no further trials. Latency to cross and trials to criterion were analyzed.
2.12. Conditioned freezing
Conditioned freezing is a test of amygdala‐mediated learned fear response 23 and was assessed using a 4‐day protocol. The test arena was 25 cm × 25 cm and made of white acrylic (San Diego Instruments) with a metal grid floor and light and speaker mounted on the lid with photobeams at floor level to record movement. The test chamber was situated in a sound‐attenuating cabinet. Day‐1 consisted of 6 min of exploration followed by 6 min with an 85 dB 30 s tone and 2 kHz light paired with a 1.3 mA foot‐shock delivered during the last 2 s of the stimulus interval. Tone/light‐shock pairings were repeated nine times spaced 30 s apart. On day‐2, rats were placed back in the apparatus for 6 min with no tone, light, or foot‐shock and movement recorded. On day‐3, rats were placed in a different, hexagonal black chamber of approximately the same floor area for 6 min. For the first 3 min, rats were habituated to the new compartment with no tone or light stimuli. They then received 10 trials of alternating 30 s periods with both stimuli‐on and 30 s of both stimuli‐off. On day‐4, rats were given five trials the same as on day‐3 to test spontaneous recovery. Locomotor activity was measured throughout.
2.13. Cincinnati water maze (CWM; mirror image)
Rats were tested in a mirror image configuration of the CWM using the same procedures as before. A depiction of this version of the maze is illustrated in Figure 7A. Rats were tested for 18 days, two trials/day.
FIGURE 7.
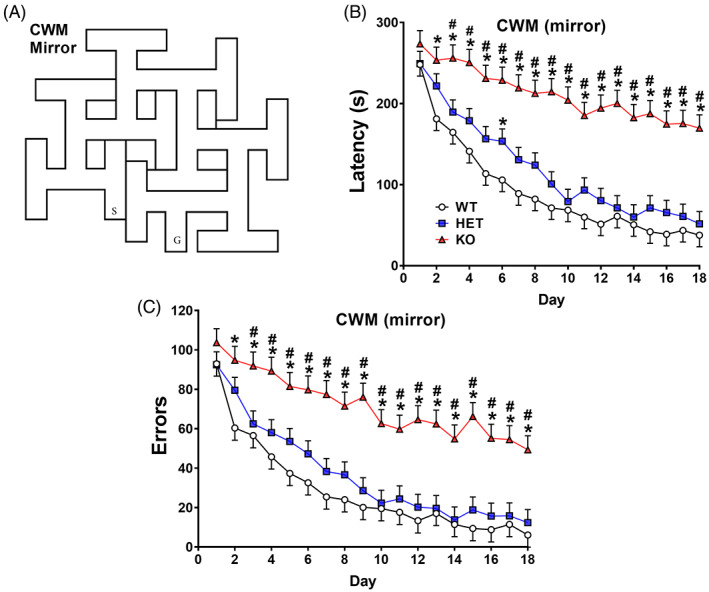
Cincinnati water maze‐mirror. (A) Illustration of the mirror image CWM. (B) Latency for 18 days of testing (2 trials/day); (C) errors by trial (mean ± SEM). wildtype (WT): n = 19 F, 19 M; heterozygous (HET): n = 16 F, 18 M; knockout (KO): n = 14 F, 15 M. *KO different from WT at p < 0.05 or higher; #KO rats different from HET rats at p < 0.05 or higher
2.14. Quantitative PCR
Brains were removed and placed in a brain block and sliced coronally in 2 mm sections. Sections were placed on a dissection plate on a block of dry ice and the structures of interest dissected and sections from the same structure combined in tubes and frozen at ‐80° C for later analysis. Quantitative PCR (qPCR) was used to analyze gene expression of Lphn3 in the Cpu, hipp, PFC, and nAcc from eight KO, eight HET, and eight WT males and eight KO, eight HET, and eight WT females taken from a separate cohort of 10 litters. Rats were sacrificed at P50. RNA was isolated using RNAqueous‐Micro (ThermoFisher Scientific) following the manufacturer's instructions and quantified by Nanodrop (Thermo Scientific). Reverse transcription reactions were performed using 4 μl of iScript at room temperature with 1 μg‐1 pg of RNA template (Bio‐Rad) in a final volume of 20 μl. PCR reactions were carried out as follows: 5 min at 25°C, 20 min at 46°C, and 1 min at 95°C. The qPCR samples contained 160 ng of cDNA, 300 nM of each primer (forward and reverse), and 1x SYBR Green Master Mix (BioRad) in a 20 μl volume. Two 20 μl aliquots of the mix were placed in a 96‐well plate and the qPCR was performed on a 7500 Real Time PCR System (Applied Biosystems) using the following conditions: 50°C for 2 min, 95°C for 10 min, 50 cycles at 95°C for 15 s, and 60 °C for 1 min. Primers were synthesized by Integrated DNA Technologies and selected based on primer efficiency of 95%–100%. Rat primer sequences were as reported. 12 Ct values were determined by the SDS 2.4 software with a threshold set at 0.5. The average Ct values from duplicates assayed were calculated. Changes in mRNA were measured with the ΔΔCt method 24 using actin as the reference and the Lphn3 WT samples as calibrator.
2.15. Western blot
Western blots were used to confirm LPHN3 deletion and dosage from seven KO, seven HET, and seven WT females taken from a separate cohort of 9 litter; actin was used as reference. Hippocampal tissue was taken and analyzed. Frozen tissue was homogenized in radioimmunoprecipitation assay buffer (25 mM Tris, 150 mM NaCl, 0.5% sodium deoxycholorate, and 1% Triton X‐100 adjusted to 7.2 pH with protease inhibitor (Pierce Biotechnology). Protein was quantified using BCATM Protein Assay Kit (Pierce Biotechnology) and diluted to 3 μg/μl. Western blots were performed using LI‐COR Odyssey procedures (LI‐COR Biosciences). Briefly, 25 μl of sample was mixed with Laemmli buffer (Sigma, USA) and loaded on a 12% gel (Bio‐Rad Laboratories, Hercules, CA) and run at 200 V for 35 min in running buffer (25 mM Tris, 192 mM glycine, 0.1% sodium dodecyl sulfate [SDS]). The gel was transferred to Immobilon‐FL transfer membrane (Millipore) in 1X rapid transfer buffer (AMRESCO) at 40 V for 1.5 h. Membranes were soaked in Odyssey phosphate buffered saline blocking buffer for 1 h and incubated with primary antibody in blocking buffer with 0.2% Tween 20. Membranes were incubated with secondary antibody in blocking buffer (0.2% Tween 20 and 0.01% SDS) for 1 h at room temperature. Antibodies were mouse anti‐LPHN3 (SC‐393576, Santa Cruz Biotechnology) at 1:500 and 1:15,000 rabbit anti‐actin (926‐42210, LI‐COR Biosciences). Odyssey IRDye 680 secondary antibody (LI‐COR Biosciences) was used at 1:15,000 dilution for both proteins. Relative protein levels were quantified using the LI‐COR Odyssey scanner and Image Studio software for fluorescent intensity with each sample normalized to actin.
2.16. Data analyses
Data were analyzed by generalized linear mixed‐effect models using SAS (v9.4, SAS Institute, Cary, NC) with p ≤ 0.05 as the threshold for significance. 25 To control for litter effects and oversampling of sex within each litter only one rat per genotype per sex per litter was used and litter and the litter × sex were random factors in the statistical model. 26 , 27 , 28 For RT‐PCR a separate cohort of rats was used. Two factor mixed linear model ANOVAs were used with between‐subject factors of genotype (WT vs HET vs KO) and sex (male vs female) with data presented as least square mean (LS Means) ± standard error. Variance–covariance matrices of best fit were used, either autoregressive (AR) or AR moving average together with Kenward‐Roger first order estimated degrees of freedom. Repeated measure ANOVAs were used for home‐cage activity with time as the repeated measure factor and for mazes and startle with repeated measure factor being day or trial block, respectively. Significant interactions were further analyzed using slice‐effect ANOVAs within SAS that maintains the overall error term and Tukey–Kramer post‐hoc pairwise comparisons. F tables for each variable are provided in supplementary materials (Tables S1‐S25).
3. RESULTS
3.1. Home‐cage activity
Hyperactivity in the KO rats was predicted based on our prior findings; therefore, these data were analyzed with Dunnett's test. At P35, KO, but not HET, rats were more active than WT rats (p < 0.05) Figure 1A. At P50, KO rats also were more active compared with WT and HET rats [Genotype: (F(2,128) = 11.9, p < 0.0001] Figure 1B. The interactions of Genotype × Sex: F(2, 134) = 4.27, p < 0.02; genotype × interval: F(46,2309) = 2.66, p < 0.0001; and genotype × sex × interval: F(46,2309) = 1.71, p < 0.003] were all significant. For the Genotype × Interval interaction, KO rats were hyperactive early, then declined to WT rat levels during the light cycle and were hyperactive again during the dark cycle Figure 1C. During the second light cycle, activity declined in all groups then rose and declined a second time, but no further significant differences occurred until 2 h before the second dark period when KO rats were hyperactive again for the next 4 h. Activity levels rose during the last 4 h of the dark cycle with no differences during the final light cycle. The only difference for HET rats compared with WT rats was reduced movement at 18 h. The three‐way interaction was due to female KO rats being more active than male KO rats during the first dark cycle (intervals 6, 7, and 8). When the genotype x sex interaction was further analyzed, the genotype effect was significant for both sexes. For females the genotype effect was significant, F(2,133.4) = 11.47, p < 0.0001), and the group means (beam breaks) and SEMs were WT = 1228.1 ± 73.8, HET = 1274.5 ± 75.8, KO = 1618.7 ± 88.4) with KO rats being significantly different from WT and HET rats. For males the genotype effect was also significant (males F[2129.4] = 3.93, p < 0.03) with group means (beam breaks) ± SEM were WT = 1051.1 ± 74.8, HET = 912.6 ± 74.7, KO = 1121.0 ± 80.6 with HET rats being significantly different from WT and KO rats.
FIGURE 1.
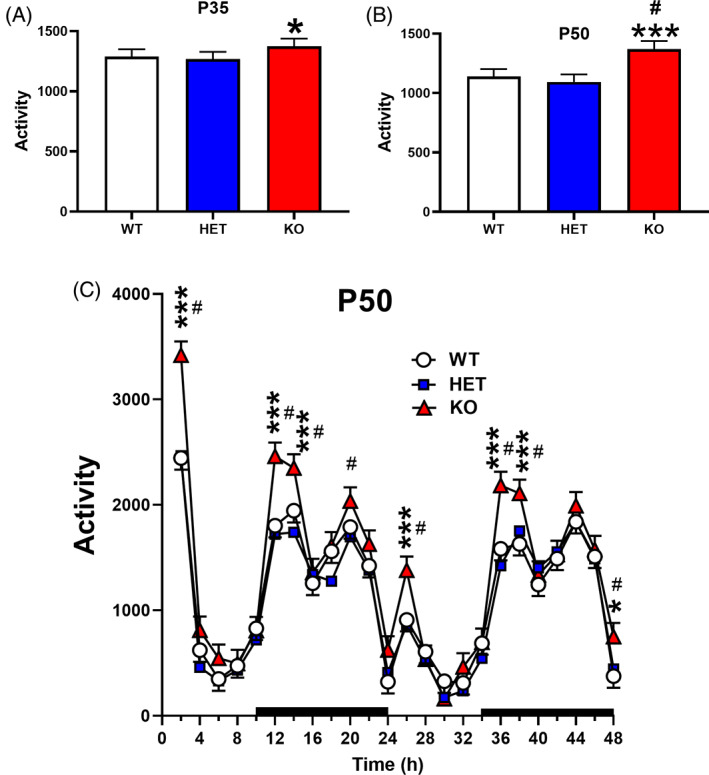
Home‐cage locomotor activity. Rats were tested in home‐cage activity monitors for 48 h. Starting 8 h before the beginning of the dark cycle and continuing through 24 h cycles that is, one partial and one full light cycle, and two dark cycles. The vivarium was on a 14 h light, 10 h dark cycle. (A) Sum of 48 h test at P35. Dunnett's test showed knockout (KO) rats were hyperactive compared with heterozygous (HET) and wildtype (WT) rats. (B) Sum of 48 h test at P50. KO rats were more active than HET and WT rats. (C) Hour‐by‐hour activity at P50 activity with significant intervals shown. Data are mean ± SEM. Sexes are combined in this figure. Group sizes: P35: WT: 22 F, 20 M; HET: 18 F, 24 M; KO: 17 F, 14 M. P50: WT: 23 F, 22 M; HET: 21 F, 22 M; KO: 13 F, 17 M. *p < 0.05, **p < 0.01, ***p < 0.001 significantly different from WT rats; #KO rats significantly different from HET rats
3.2. Straight channel
There was an effect of genotype on swim latency (F(2,88.3) = 18.43, p < 0.0001) and a genotype × trial interaction (F(6,229) = 4.41, p < 0.0004), Figure 2A. On the first trial, KO rats took longer to reach the platform than HET rats that took longer than WT controls. On the second trial, however, HET rats did not differ from WT rats, whereas KO rats took longer on trial‐2 and 3 compared with both WT and HET rats. On trial‐4, all groups performed equivalently. All rats improved over trials, p < 0.0001. There was a sex × trial interaction (F(3,204) = 4.92, p < 0.002) because on the first trial females took longer than males (not shown). Genotype × sex × trial was not significant.
3.3. Cincinnati water maze
The maze is illustrated in Figure 2B. All groups improved over the 18 days of testing (p < 0.0001, Figure 2C,D), however, KO rats took longer to reach the goal compared with controls and HET rats (genotype effect on latency: F(2,109) = 8.98, p < 0.0003). For latency, there was a genotype × day interaction (F(34,1563) = 2.03, p < 0.0005) Figure 2C. Starting on day‐9 and continuing until day‐18, KO rats took longer to locate the platform compared with WT rats and from day‐11 to day‐18, KO rats took longer than HET rats, showing a gene‐dosage effect. HET rats had longer latencies than the WT rats from day‐10 to day‐13 and again on day‐15. There was a main effect of sex, males had longer latencies than females (F(1,110) = 4.35, p < 0.04); there was no genotype × sex interaction.
The KO rats made more errors compared with WT rats (genotype effect on errors: F(2, 113) = 7.45, p < 0.001) Figure 2D. There was a genotype × day interaction (F(34, 1572) = 1.61, p < 0.02). KO rats made more errors than WT rats from day‐9 to day‐18. KO rats had more errors than HET rats on day‐12 and day‐14 to 18. HET rats differed from WT rats on days 9 and 13. Males made more errors than females (sex: F(1, 114) = 3.89, p = 0.05) (not shown); there was no genotype × sex interaction.
3.4. Morris water maze
3.4.1. Acquisition path efficiency
During acquisition, KO rats had reduced path efficiency to the platform compared with WT rats; HET rats were intermediate and were significantly different from both WT and KO rats (genotype: F(2, 80) = 50.84, p < 0.0001), Figure 3A. Regardless of genotype, path efficiency increased across days (p < 0.0001). There was a genotype × day interaction in which KO rats had reduced path efficiency on all days compared with WT rats and on days 3–6 compared with HET rats (F(10, 432) = 2.83, p < 0.003) Figure 3A. HET rats had reduced path efficiency on days 2–6 compared with WT rats.
FIGURE 3.
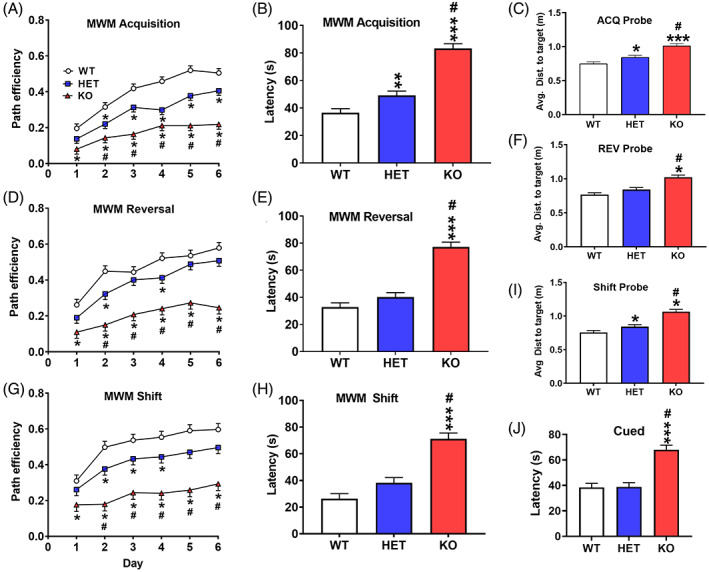
Morris water maze. A gene dosage effect is seen in path efficiency. (A) Acquisition path efficiency by day (four trials/day). (B) Acquisition latency averaged across days. (C) Acquisition probe average distance to former platform site across trials. (D) Reversal path efficiency by day. (E) Reversal latency averaged across days. (F) Reversal probe average distance from former platform site across trials. (G) Shift path efficiency by day. (H) Shift latency averaged across days. (I) Shift probe average distance from former platform site across trials. (J) Cued latency. wildtype (WT): n = 19 F, 19 M; heterozygous (HET): n = 17 F, 19 M; knockout (KO): n = 14 F, 16 M. *Significantly different from WT rats; #KO significantly different from HET rats
3.4.2. Acquisition latency
Latency showed a similar pattern with KO rats having longer latencies than WT and HET rats, and HET rats had longer latencies than WT rats (genotype: F(2,65.5) = 64.89, p < 0.0001) Figure 3B. All groups had reduced escape times across days (p < 0.0001). There was no interaction of genotype × day.
3.4.3. Acquisition sex differences
Females took longer to reach the platform than males (sex: F(1,40.7) = 8.47, p < 0.006); day was also significant (F(5,365) = 3.22, p < 0.008). The same was found for path efficiency (sex: F(1, 83.6) = 18.38, p < 0.0001). From day 2 to 6, females had lower path efficiency compared with males (sex × day: F(5,402) = 2.64, p < 0.03); there was no genotype × sex interaction. During probe trials, there was a main effect of sex for average distance to the former platform site (F(1,20.2) = 14.63, p < 0.002), males had shorter distances than females. Males had more entries in the platform zone than females [sex: F(1,20.2) = 10.41, p < 0.005] and there was an interaction of genotype × sex (F(2, 65.5) = 3.50, p < 0.04). When analyzed further by sex the effect of genotype was significant for both sexes (female F(2,67.8) = 11.73, p < 0.0001; male F(2,62,8) = 12.53, p < 0.0001). For females, both HET and KO rats differed significantly from WT rats, p < 0.0001 and p < 0.03, respectively. Mean (entries) ± SEM for females were WT = 3.7 ± 0.3, HET = 2.7 ± 0.3, KO = 1.9 ± 0.3. For males, KO differed significantly from HET and WT, both comparisons p < 0.0001. Mean (entries) ± SEM for males were WT = 3.9 ± 0.3, HET = 4.2 ± 0.3, KO = 2.5 ± 0.3.
3.4.4. Acquisition swim speed
There were no differences among groups for swim speed. Mean ± SEM swim speeds: WT, 21.1 ± 0.4 cm/s; HET, 22.1 ± 0.4 cm/s; and KO, 21.2 ± 0.4 cm/s. However, there was an interaction of genotype × day (F(10, 423) = 2.17, p < 0.02]. The only differences between groups were on day‐1 when the KO rats were slower than the HET and WT rats and on day 4 when HET rats were faster than the WT rats.
3.4.5. Acquisition probe
On acquisition probe trials for average distance to the platform site, KO rats had the longest average distance, HET rats were intermediate differing from both KO and WT rats, and WT rats had the shortest distances (genotype: F(2, 66.6) = 25.50, p < 0.0001), Figure 3C. All groups had shorter average distances on the day‐7 probe trial compared with day‐3 probe trial (p < 0.0001). There was no interaction of genotype × day on probe trials. For target zone entries, KO rats had fewer entries than HET or WT rats (genotype: F(2, 64.8) = 20.12, p < 0.0001, not shown). There was an interaction of genotype × sex: F(2, 65.5) = 3.50, p < 0.04. For females the HET and KO rats did not differ from each other, but both groups had fewer entries than the WT females. For males the HET and WT rats did not differ, but the KO rats had fewer entries than the HET and WT males.
3.4.6. Reversal path efficiency
On reversal, genotype was significant for path efficiency (F(2, 72.4) = 35.84, p < 0.0001). KO rats were less efficient than WT and HET rats, and HET and WT rats did not differ (Figure 3D). However, there was an interaction of genotype × day (F(10, 426) = 2.15, p < 0.02) Figure 3D. KO rats were less efficient than WT rats on days 1–6 and from HET rats on days 2–6. HET rats were less efficient than WT rats on days 2 and 4.
3.4.7. Reversal latency
For latency, KO rats took longer to reach the platform compared with HET and KO rats, with no difference between HET and KO rats (genotype: F(2, 73) = 51.59, p < 0.0001), Figure 3E. All groups improved over days (p < 0.0001). There were no interactions of genotype × day.
3.4.8. Reversal swim speed
KO and HET rats swam faster than WT rats on reversal trials (genotype: F(2, 87.2) = 4.58, p < 0.02) showing they had no motoric deficit. KO rats swam faster than WT rats on days 2, 5, and 6 (genotype × day (F(10, 402)) = 1.87, p < 0.05). HET rats swam faster than WT rats on day 2 with no difference between HET and KO rats. Mean ± SEM swim speeds: WT, 20.0 ± 0.5 cm/s; HET, 21.5 ± 0.5 cm/s; and KO, 21.9 ± 0.6 cm/s.
3.4.9. Reversal probe
For reversal probe, KO rats had longer average distances to the former platform site compared with HET and WT rats (genotype: F(2, 67) = 22.04, p < 0.001), Figure 3F. All groups performed better on day‐7 than on day‐3 probe trials (p < 0.0001). KO rats had fewer target zone entries than HET or WT rats (genotype: F(2, 66.2) = 16.62, p < 0.0001) (not shown).
3.4.10. Reversal sex differences
Females had longer latencies than males (sex: F(1, 43.3) = 10.74, p < 0.003). Females had reduced path efficiency compared with males (sex: F(1, 20.9) = 14.5, p < 0.002). On probe trials, there was a main effect of sex for average distance to the platform site (F(2, 25.3) = 17.14, p < 0.001), in which males had shorter average distances than females. Males had more zone entries compared with females (sex: F(1, 23.5) = 7.78, p < 0.05).
3.4.11. Shift path efficiency
On shift, there was a main effect of genotype on path efficiency (F(2, 88.3) = 29.53, p < 0.0001)). KO rats had less efficient paths compared with WT and HET rats, with HET rats being less efficient than WT rats. There was an interaction of genotype × day (F(10, 417) = 2.21, p < 0.02) Figure 3G. KO rats were less efficient than WT rats on all days, whereas HET rats were less efficient than WT rats only on days 2, 4, and 5. The KO rats were less efficient compared with HET rats on days 2–6.
3.4.12. Shift latency
KO rats had longer latencies compared with both HET and WT rats (genotype: F(2, 98.7) = 31.33, p < 0.0001) (Figure 3H), and there was a genotype × day interaction (F(10, 412) = 1.89, p < 0.05). Regardless of day, the KO rats took longer to locate the platform, however, the HET rats took longer to locate the platform on day‐2 compared with WT rats.
3.4.13. Shift swim speed
There were no significant differences in swim speed. Mean ± SEM swim speeds: WT, 24.4 ± 0.5 cm/s; HET, 25.3 ± 0.6 cm/s; and KO, 24.0 ± 0.6 cm/s.
3.4.14. Shift probe
On shift probe trials, KO rats had a greater average distance to the former platform site than HET and WT rats and HET rats had greater average distance than WT rats (genotype: F(2, 66.7) = 28.13, p < 0.0001), Figure 3I. KO rats also had fewer target zone entries than HET or WT rats (genotype: F(2, 66.2) = 16.62, p < 0.0001) (not shown).
3.4.15. Shift sex differences
Sex differences were the same as on acquisition and reversal, females had longer latencies than males (sex: F(1, 98.7) = 14.59, p < 0.0003) and had less efficient paths (sex: F(1, 89.2) = 26.10, p < 0.0001). On probe trials, females had greater average distance to the platform site than males (sex: F(1, 21.7) = 25.31, p < 0.0001) and fewer platform zone entries than males (sex: F(1, 82.8) = 15.69, p < 0.001). No interactions with sex were significant.
3.4.16. Cued
After shift, rats were given cued trials to assess learning using proximal cues with curtains closed around the maze to block distal cues and with random start and random goal positions on every trial. KO rats had longer latencies than HET and WT rats; HET and WT rats did not differ from one another (genotype: F(2, 98) = 22.30, p < 0.0001), Figure 3J. All rats improved from day‐1 to day‐2 (p < 0.0001). There were no interactions.
3.5. Radial water maze
For latency there was a genotype main effect (F(2, 86.5) = 5.51, p < 0.006) Figure 4A. KO rats had longer latencies than HET and WT rats. There was an interaction of sex × genotype (F(2, 78.4) = 3.70, p < 0.03), KO males had longer latencies than HET and WT males (Figure 4B) and HET females had longer latencies than WT females. There were no significant main effects on errors (working or total errors [Figure 4C]). For start errors, there was an interaction of genotype × sex (F(2, 80.1) = 3.32, p < 0.05) in which the KO females had fewer start returns than HET females (means ± SEM: WT = 0.31 ± 0.04, HET = 0.41 ± 0.04, KO = 0.24 ± 0.04). There were no significant differences on start returns for males (means ± SEM: WT = 0.25 ± 0.03, HET = 0.30 ± 0.04, KO = 0.32 ± 0.04).
FIGURE 4.
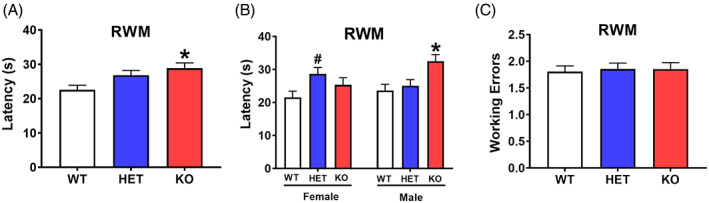
Radial water maze. Lphn3 knockout (KO) rats had an increased latency to the platform compared with heterozygous (HET) and wildtype (WT) rats. (A) Average latency to the platform. (B) Average latency by sex. (C) Average working memory errors. WT: n = 19 F, 19 M; HET: n = 17 F, 19 M; KO: n = 14 F, 16 M. *Significantly different from WT rats; #significantly different from female WT rats
3.6. Novel object recognition
There were no genotype effects on familiarization or retention. All groups preferred the novel object during retention (mean ± SEM: WT = 40.9 ± 3.3%, HET = 40.6 ± 3.3%, KO = 42.3 ± 3.6%, chance = 25%). Females (45.2 ± 3.0%) had greater preference for the novel object compared with males (37.4 ± 2.7%) (sex: F(1, 23) = 4.20, p = 0.05]. There were no differences in time to reach criterion. The average time to reach criterion in both familiarization and retention was under 2 min. Group sizes WT: n = 14 F, 19 M; HET: n = 15 F, 17 M; KO: n = 12 F, 15 M.
3.7. Acoustic and tactile startle (ASR/TSR and PPI)
For ASR, KO rats had increased startle compared with HET and WT rats, with no differences between HET and WT rats (genotype: F(2, 93.3 = 18.08, p < 0.0001) Figure 5A. There was no effect of sex and no interactions with genotype or sex.
FIGURE 5.
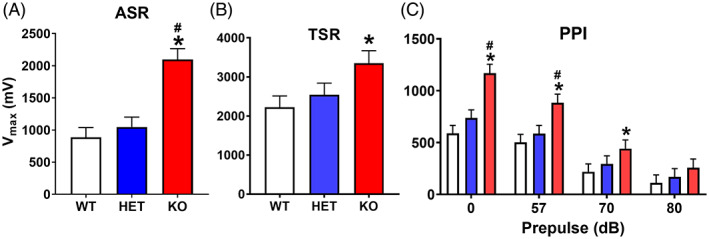
Acoustic, tactile, and acoustic pre‐pulse inhibition startle response: regardless of sex, knockout (KO) rats had significantly increased acoustic startle response (ASR) peak responses compared with heterozygous (HET) and wildtype (WT) rats. For tactile startle response, KO rats also had higher peak responses compared with heterozygous (HET) and WT rats. KO rats had an increased response during PPI trials. (A) Average V max ASR across trials. WT: n = 18 F, 19 M; HET: n = 17 F, 19 M; KO: n = 14 F, 16 M. (B) Average V max tactile startle response per genotype. WT: n = 15 F, 18 M; HET: n = 13 F, 18 M; KO: n = 11 F, 14 M. There were smaller numbers in tactile because of a computer malfunction. (C) Average V max acoustic startle response on prepulse trials. WT: n = 18 F, 19 M; HET: n = 16 F, 19 M; KO: n = 14 F, 16 M. *Significantly different from WT rats; #KO significantly different from HET rats
For TSR, KO rats had increased startle compared with WT rats (genotype: F(2, 85.6) = 3.57, p < 0.04) Figure 5B, with no difference between the HET rats and KO or WT rats.
For acoustic PPI, KO rats had increased startle compared with HET and WT rats (genotype: F(2, 60.2) = 6.93, p < 0.002) and KO rats had greater responses than WT and HET rats on trials with prepulse intensities of 0, 57, and 70 dB but not when prepulses were 80 dB (genotype × PPI: F(6, 261) = 6.79, p < 0.0001) Figure 5C. Females had a smaller V max at 0 dB compared with males, with no difference at other prepulse intensities (sex × PPI: F(3, 257) = 6.19. p < 0.0004).
3.8. Passive avoidance
There was no significant effect of genotype on passive avoidance latency (WT = 103.5 ± 12.0 s, HET = 133.1 ± 13.4 s, KO = 126.2 ± 14.1 s), nor was there any effect on trials to criterion (not shown). There was a main effect of sex on latency in which males took longer to crossover than females (sex: (F(1, 19.1) = 6.00, p < 0.03). Group sizes WT: n = 19 F, 18 M; HET: n = 17 F, 19 M; KO: n = 14 F, 16 M.
3.9. Conditioned freezing
On Day‐1 there was a main effect of genotype across phases (F(2, 53.2) = 18.61, p < 0.0001), more clearly seen in a genotype × interval interaction (F(2, 87) = 18.52, p < 0.0001). When analyzed by interval, there were no genotype differences during the pre‐stimulus interval (Figure 6A, left). During conditioning, the KO and HET rats were more active than the WT rats, and the KO rats were more active than the HET rats (Figure 6A (right)). Males were more active than females (sex: F(1, 12.2) = 57.71, p < 0.0001). Genotype × sex was significant (F(2, 57.3) = 3.67, p < 0.04), however, regardless of sex HET and WT rats did not differ from one another.
FIGURE 6.
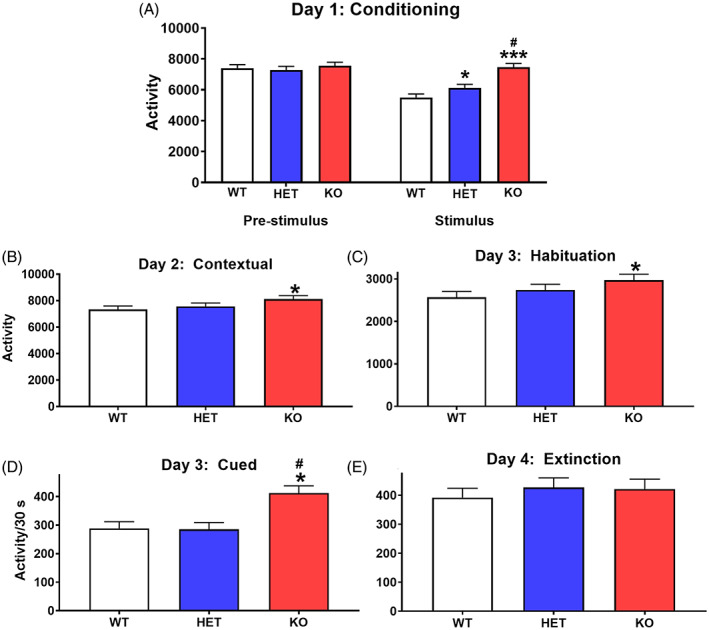
Conditioned freezing. (A) Day‐1 average activity response (beam breaks) before and after tone/light‐foot‐shock pairings. (B) Day‐2 average activity within the same chamber as Day‐1 to assess contextual memory (6 min). (C) Day‐3 habituation before (pre‐tone/light) activity in a different enclosure. (D) Day‐3 average activity during tone/light trials. (E) Day‐4, activity during extinction. wildtype (WT): n = 17 F, 16 M; heterozygous (HET): n = 15 F, 16 M; KO: n = 13 F, 16 M. Several rats had data excluded because they were tested using the wrong protocol. *Significantly different from WT rats; #KO rats significantly different from HET rats
On day‐2 (contextual), KO rats were less inhibited than WT rats (genotype: F(2, 42.4) = 5.32, p < 0.009) Figure 6B. HET and WT rats did not differ from one another. Males were less inhibited than females (sex: F(1, 12.9) = 19.66, p < 0.0001).
On day‐3 (cued), rats were first habituated to a new enclosure for 3 min. During this phase, KO rats were more active than the WT rats with HET rats intermediate between KO and WT rats (genotype: F(2, 45.3) = 5.84, p < 0.0055) (Figure 6C). The genotype × sex interaction was also significant (F(2,47.6) 4.01, p < 0.03). The HET females were more active than the WT females, and the KO males were more active than the WT and HET males (not shown). After habituation the rats were given 10 cued trials with alternating tone and light on for 30 s and off for 30 s. For the intervals with tone and light on, there was a main effect of genotype (F(2, 83.3) = 10.48, p < 0.0001) (Figure 6D ) and no interactions. KO rats were more active that is, less suppressed, than HET or WT rats. There were no differences between HET and KO rats. On the trials with tone and light off, there was also an effect of genotype (F(2, 57.5) = 7.48, p < 0.002). Day‐4 was a test of spontaneous recovery; there were no genotype‐related effects (Figure 6E ).
3.10. Cincinnati water maze (mirror)
In the mirror image CWM (Figure 7A), KO rats had longer latencies than HET and WT rats (genotype: F(2,101) = 32.21, p < 0.0001). KO rats were slower than WT rats starting on day‐2, and slower than HET rats starting on Day‐3 (genotype × day: F(34, 1518) = 1.98, p < 0.0008) Figure 7B. The HET rats had longer latencies than WT rats only on day‐6. Males had longer latencies compared with females (sex: F(1, 106) = 14.72, p < 0.0003).
KO rats made more errors than HET and WT rats (genotype: F(2,96.9) = 23.75, p < 0.0001). HET and WT rats did not differ from another (Figure 7C ). KO rats made more errors starting on Day‐2 compared with WT rats and starting on Day‐3 KO rats made more errors compared with HET rats (genotype × day: F(34, 1524) = 1.54, p < 0.03). Males made more errors compared with females (sex: F(1,101) = 10.73, p < 0.002].
3.11. Real‐time quantitative reverse transcription PCR
KO and HET rats had reduced Lphn3 expression compared with WT rats in all 4 brain regions [genotype main effect: F(2, 31.5) = 19.15, p < 0.0001], (means ± SEM: WT = 0.99 ± 0.1, HET = 0.43 ± 0.1, KO = 0.08 ± 0.1). Pairwise comparisons were WT vs. HET p < 0.0007, WT versus KO p < 0.0001, and KO versus HET p < 0.04. There were no effects of brain region, sex, or interactions of brain region by sex or genotype. There was no difference for actin between genotypes (means ± SEM: WT = 16.08 ± 0.2, HET = 16.17 ± 0.2, KO = 16.45 ± 0.2). There were no interactions of brain region by sex or by genotype. Group sizes per sex: WT: n = 8 F, 8 M; HET: n = 8 F, 8 M; KO: n = 8 F, 8 M.
3.12. Western blots
KO rats had reduced Lphn3 expression compared with WT rats in the hippocampus (genotype main effect: F(2, 14) = 8.21, p < 0.01). HET rats had a trend towards reduced LPHN3 compared with WT (Figure 8). Comparisons were WT vs. HET p < 0.08 and WT versus KO p < 0.001. N/group (females): WT = 7, HET = 7, KO = 7.
FIGURE 8.
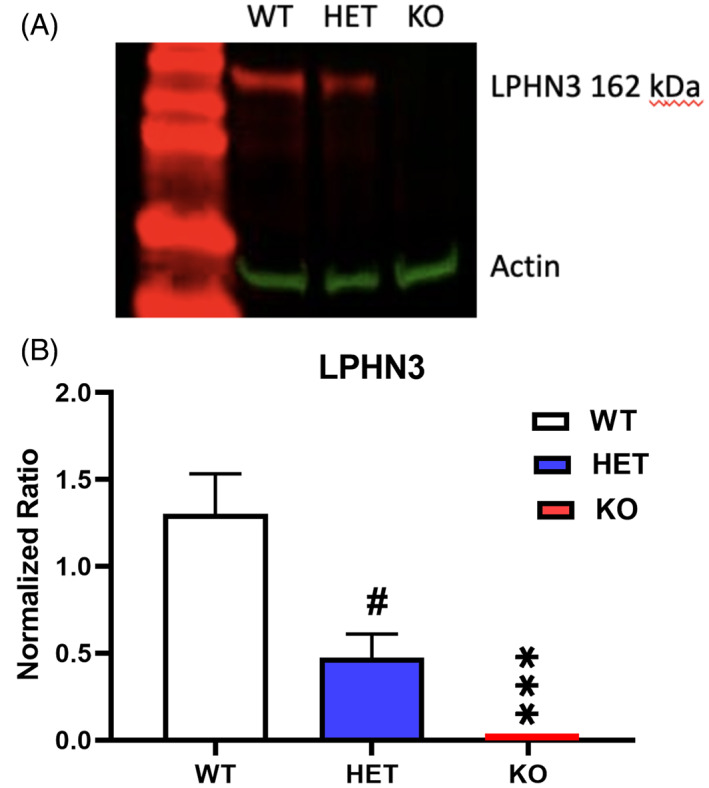
Western blots of LPHN3 expression in hippocampus. (A) Western blot of LPHN3 by genotype relative to actin. (B) Relative quantification of western blot data. N = 7/group. # p < 0.10, ****p < 0.001 compared with wildtype.
4. DISCUSSION
The data show a gene‐dosage effect, suggesting Lphn3 acts dominantly. In HET rats, a single KO allele significantly affected behavior, especially on cognitive outcomes but the effect was not 50% of the KO effect in all cases. Recessive loss‐of‐function mutations typically result in HET animals resembling a WT phenotype. Complete deletion of Lphn3 affected home‐cage activity, startle, conditioned freezing, radial maze, and egocentric and allocentric navigation, 12 , 13 whereas loss of one allele affected fewer behaviors and for those that were affected, home‐cage activity, startle, egocentric and allocentric navigation, effects were intermediate. Despite the striking effects in KO rats, there were tests not affected even by complete deletion. These included NOR and passive avoidance. For passive avoidance, this could be the result of the different stimulus type and further experiments would be needed to test for this possibility. The significant effects in the KO rats on the other tests replicate what we found previously demonstrating the consistency of the null model to which we now add effects in HET rats. 13 As before KO rats were hyperactive at P35 and P50, however hyperactivity in this study at P35 was smaller than before but at P50 was similar to what we saw, and most of the LPHN3 KO and HET hyperactivity was nocturnal. Importantly, the effects on home‐cage activity occur in a familiar environment 29 , 30 that is significant since ADHD patients show hyperactivity in familiar settings 31 rather than in novel settings. Future studies should investigate which of the 21 LPHN3 human gene variants confer risk for ADHD and then model the most important ones in rodents.
Egocentric/procedural/implicit learning and memory depend on striatal dopamine 17 , 32 , 33 and connected regions. Lphn3 KO rats have decreased neostriatal dopamine receptor D1 and DARPP‐32 levels, accompanied by increased dopamine transporter and tyrosine hydroxylase levels. 12 Lphn3 KO rats also have increases in spontaneous dopamine signaling as measured by fast scan cyclic voltammetry. 14 These effects are consistent with the impaired egocentric learning and memory.
Lphn3 HET and KO rats had impaired allocentric learning and memory in the MWM. HET rats had allocentric impairments in spatial navigation, cognitive flexibility (reversal trials), and in the more challenging shift condition, or what might be termed a set learning deficit. This may reflect involvement of LPHN3 protein in networks that include the hippocampus/entorhinal cortex that encode, consolidate, and retrieve information for a spatial map of location, 34 , 35 and this includes related regions. 32 , 33 , 36 Whereas MWM hidden platform trials reflect spatial navigation, cued trials reflect egocentric navigation, albeit less challenging than assessed in the CWM. The difference in difficulty between these tests may explain why HET rats performed comparably to WT rats on cued trials but were impaired in the CWM. Nevertheless, the data show that LPHN3 is important for both implicit (CWM) and explicit (MWM) learning and memory.
Gene‐dosage effects were seen for home‐cage activity, CWM, and MWM. However, other behaviors were not dose‐dependent or showed no significant HET effects. LPHN3 expression is highest in striatum consistent with the largest behavioral impairments being in the CWM, which is known to heavily depend on an intact dorsal striatum. 37 , 38 LPHN3 expression is expressed at lower levels in PFC and sub‐regionally in hippocampus which matches the less severe effects in the RWM and intermediate effects in the MWM. LPHN3 is least expressed in amygdala where we found smaller effects on conditioned freezing. LPHN3 is highly expressed in cerebellum 39 but we did not assess cerebellar function in this experiment. Low levels of expression are also found elsewhere, including in the corpus callosum, occipital, frontal, and temporal cortices, and in the putamen. Within the hippocampus, expression is highest in the dentate gyrus and lower in CA1‐3. 37 , 39 Given that dentate gyrus disruption is associated with MWM deficits, the KO and HET effects observed here are consistent with LPHN3 being disrupted in dentate. NOR is linked to hippocampus and subiculum. 40 , 41 LPHN3 expression is low in subiculum, and this may account for why no effects on NOR were obtained. However, expression patterns do not perfectly align with behavior because behavior depends on multiregional networks. For example, LPHN3 is expressed in the PFC yet we found no effects on working memory in the RWM. Perhaps this could be because the RWM is not sensitive enough to detect an LPHN3‐related working memory deficit. Assessing Lphn3 KO rats in an appetitive radial‐arm maze, spontaneous alternation, or delayed matching to sample might reveal working memory deficits not observed here.
Lphn3 HET rats showed variable effects across tasks. This could be due to redundancy. There is evidence that Lphn3 has different functions in different regions. Sando et al. (2019), found that Lphn3 KO mice have decreased spine density and excitatory synaptic function in CA1 2 with no evidence of a role for Lphn3 in CA2 or CA3. In cerebellum, by contrast, Lphn2 and Lphn3 are redundant such that loss of one compensates for the other. 42 Such regional differences reflect the complexity of learning and memory networks and how LPHN3 is integrated into these networks in different ways.
A remaining issue is whether any of the LPHN3 deficits are related to visual impairment. Several of the tests rely on visual cues (hidden platform and cued versions of the MWM, conditioned freezing, NOR, and passive avoidance) yet the Lphn3 KO rats were impaired on some of these tasks (hidden and visible MWM and conditioned freezing) but not others (NOR and passive avoidance). On schedule‐controlled operant conditioning using visual cues and different schedules of reinforcement, Lphn3 KO rats were impaired on some functions, including DRL (differential reinforcement of low rates of responding) and DSA (delayed spatial alternation) but not on cued or non‐cued alternation. 43 These data suggest that Lphn3 KO rats have adequate vision, but this is not definitive. A test of visual acuity is needed to resolve this issue.
There were a few genotype x sex interactions observed. These occurred for home‐cage activity, MWM acquisition probe trials, and RWM for latencies and start returns. Although significant, no pattern emerged among these sex‐dependent effects and therefore there is no clear interpretation of these limited effects given how many dependent variables there were in the study that showed no genotype × sex interactions.
Lphn3 KO rats and mice model aspects of ADHD but are not ADHD per se since no humans have been yet identified to have a null mutation of LPHN3. In human cases where significant associations are found there are 21 LPHN3 variants connected with ADHD, some in exonic and some in intronic regions. 4 , 44 HET rats with about 50% reduction in Lphn3 expression may represent a closer resemblance to human LPHN3 variants than the full KO. Both Lphn3 KO and HET rats have significant cognitive deficits, which most ADHD patients do not show, but some do, 6 but when present they are not as severe as those seen here in KO rats. The use of both Lphn3 KO and HET models may provide greater information about the possible role of LPHN3 in normal brain function and how it may contribute to ADHD.
CONFLICT OF INTEREST
The authors declare no conflict of interest.
Supporting information
Table S1 Home‐cage activity P35
Table S2 Home‐cage activity P50
Table S3 Straight Channel Latency
Table S4 Cincinnati Water Maze (A) Errors
Table S5 Cincinnati Water Maze (A) Latency
Table S6 Morris Water Maze Acquisition: Path Efficiency
Table S7 Morris Water Maze Acquisition: Latency
Table S8 Morris Water Maze Acquisition: Probe Average Distance
Table S9 Morris Water Maze Reversal: Path Efficiency
Table S10 Morris Water Maze Reversal: Latency
Table S11 Morris Water Maze Reversal: Probe Average Distance
Table S12 Morris Water Maze Shift: Path Efficiency
Table S13 Morris Water Maze Shift: Latency
Table S14 Morris Water Maze Shift: Probe Average Distance
Table S15 Radial Water Maze: Latency
Table S16 Acoustic Startle Habituation
Table S17 Tactile Startle Habituation
Table S18 Prepulse Inhibition of Acoustic Startle
Table S19 Conditioned Freezing: Day‐1 Conditioning
Table S20 Conditioned Freezing: Day‐2 Contextual Freezing
Table S21 Conditioned Freezing: Day‐3: Habituation Interval
Table S22 Conditioned Freezing: Day‐3 Cued Freezing: Tone on
Table S23 Conditioned Freezing: Day‐3 Cued Freezing: Tone off
Table S24 Cincinnati Water Maze: Mirror Image Errors
Table S25 Cincinnati Water Maze: Mirror Image Latency
ACKNOWLEDGMENTS
Supported by NIH grants R21 MH110609 and R01 ES032270 and the University of Cincinnati Graduate School Dean's Dissertation Completion Fellowship (S.L.R). Behavioral testing was conducted through the Animal Behavior Core of Cincinnati Children's Research Foundation.
Regan SL, Sugimoto C, Dawson HE, Williams MT, Vorhees CV. Latrophilin‐3 heterozygous versus homozygous mutations in Sprague Dawley rats: Effects on egocentric and allocentric memory and locomotor activity. Genes, Brain and Behavior. 2022;21(7):e12817. doi: 10.1111/gbb.12817
Funding information L.I.F.E. Foundation, Grant/Award Number: No number; National Institute of Environmental Health Sciences, Grant/Award Number: R01 ES032270; National Institute of Mental Health, Grant/Award Number: R21 MH101609
DATA AVAILABILITY STATEMENT
Data are available upon request.
REFERENCES
- 1. Acosta MT, Velez JI, Bustamante ML, Balog JZ, Arcos‐Burgos M, Muenke M. A two‐locus genetic interaction between LPHN3 and 11q predicts ADHD severity and long‐term outcome. Transl Psychiatry. 2011;1:e17. [DOI] [PMC free article] [PubMed] [Google Scholar]
- 2. Sando R, Jiang X, Sudhof TC. Latrophilin GPCRs direct synapse specificity by coincident binding of FLRTs and teneurins. Science. 2019;363(6429):eeav7969. [DOI] [PMC free article] [PubMed] [Google Scholar]
- 3. Arcos‐Burgos M, Muenke M. Toward a better understanding of ADHD: LPHN3 gene variants and the susceptibility to develop ADHD. Atten Deficit Hyperactivity Disord. 2010;2(3):139‐147. [DOI] [PMC free article] [PubMed] [Google Scholar]
- 4. Domene S, Stanescu H, Wallis D, et al. Screening of human LPHN3 for variants with a potential impact on ADHD susceptibility. Am J Med Genet Part B: Neuropsychiat Genet. 2011;156b(1):11‐18. [DOI] [PubMed] [Google Scholar]
- 5. Ribases M, Ramos‐Quiroga JA, Sanchez‐Mora C, et al. Contribution of LPHN3 to the genetic susceptibility to ADHD in adulthood: a replication study. Genes Brain Behav. 2011;10(2):149‐157. [DOI] [PubMed] [Google Scholar]
- 6. Das D, Cherbuin N, Easteal S, Anstey KJ. Attention deficit/hyperactivity disorder symptoms and cognitive abilities in the late‐life cohort of the PATH through life study. PLoS One. 2014;9(1):e86552. [DOI] [PMC free article] [PubMed] [Google Scholar]
- 7. Fallgatter AJ, Ehlis AC, Dresler T, et al. Influence of a latrophilin 3 (LPHN3) risk haplotype on event‐related potential measures of cognitive response control in attention‐deficit hyperactivity disorder (ADHD). Eur Neuropsychopharmacol. 2013;23(6):458‐468. [DOI] [PMC free article] [PubMed] [Google Scholar]
- 8. Arcos‐Burgos M, Vélez JI, Martinez AF, et al. ADGRL3 (LPHN3) variants predict substance use disorder. Transl Psychiatry. 2019;9(1):42. [DOI] [PMC free article] [PubMed] [Google Scholar]
- 9. Liu QR, Drgon T, Johnson C, Walther D, Hess J, Uhl GR. Addiction molecular genetics: 639,401 SNP whole genome association identifies many "cell adhesion" genes. Am J Med Genet Part B: Neuropsychiatr Genet. 2006;41b(8):918‐925. [DOI] [PubMed] [Google Scholar]
- 10. Millar RP, Newton CL. The year in G protein‐coupled receptor research. Mol Endocrinol. 2010;24(1):261‐274. [DOI] [PMC free article] [PubMed] [Google Scholar]
- 11. Griffiths AJF, Miller JH, Suzuki DT, Lewontin RC, Gelbart WM. Introduction to Genetic Analysis. W. H. Freeman; 2000. [Google Scholar]
- 12. Regan SL, Hufgard JR, Pitzer EM, et al. Knockout of latrophilin‐3 in Sprague‐Dawley rats causes hyperactivity, hyper‐reactivity, under‐response to amphetamine, and disrupted dopamine markers. Neurobiol Dis. 2019;130:104494. [DOI] [PMC free article] [PubMed] [Google Scholar]
- 13. Regan SL, Pitzer EM, Hufgard JR, Sugimoto C, Williams MT, Vorhees CV. A novel role for the ADHD risk gene latrophilin‐3 in learning and memory in Lphn3 knockout rats. Neurobiol Dis. 2021;158:105456. [DOI] [PMC free article] [PubMed] [Google Scholar]
- 14. Regan SL, Cryan MT, Williams MT, Vorhees CV, Ross AE. Enhanced transient striatal dopamine release and reuptake in Lphn3 knockout rats. ACS Chem Neurosci. 2020;11(8):1171‐1177. [DOI] [PubMed] [Google Scholar]
- 15. Vorhees CV, Herring NR, Schaefer TL, et al. Effects of neonatal (+)‐methamphetamine on path integration and spatial learning in rats: effects of dose and rearing conditions. Int J Dev Neurosci. 2008;26:599‐610. [DOI] [PMC free article] [PubMed] [Google Scholar]
- 16. Tang X, Orchard SM, Sanford LD. Home cage activity and behavioral performance in inbred and hybrid mice. Behav Brain Res. 2002;136(2):555‐569. [DOI] [PubMed] [Google Scholar]
- 17. Vorhees CV, Williams MT. Cincinnati water maze: a review of the development, methods, and evidence as a test of egocentric learning and memory. Neurotoxicol Teratol. 2016;57:1‐19. [DOI] [PMC free article] [PubMed] [Google Scholar]
- 18. Vorhees CV, Williams MT. Morris water maze: procedures for assessing spatial and related forms of learning and memory. Nat Protoc. 2006;1(2):848‐858. [DOI] [PMC free article] [PubMed] [Google Scholar]
- 19. Vorhees CV, Williams MT. Value of water mazes for assessing spatial and egocentric learning and memory in rodent basic research and regulatory studies. Neurotoxicol Teratol. 2014;45:75‐90. [DOI] [PubMed] [Google Scholar]
- 20. Shear DA, Dong J, Haik‐Creguer KL, Bazzett TJ, Albin RL, Dunbar GL. Chronic administration of quinolinic acid in the rat striatum causes spatial learning deficits in a radial arm water maze task. Exp Neurol. 1998;150(2):305‐311. [DOI] [PubMed] [Google Scholar]
- 21. Bevins RA, Besheer J. Object recognition in rats and mice: a one‐trial non‐matching‐to‐sample learning task to study 'recognition memory'. Nat Protoc. 2006;1(3):1306‐1311. [DOI] [PubMed] [Google Scholar]
- 22. Eagle AL, Wang H, Robison AJ. Sensitive assessment of hippocampal learning using temporally dissociated passive avoidance task. Bio Protoc. 2016;6(11):e1821. [DOI] [PMC free article] [PubMed] [Google Scholar]
- 23. Fendt M, Fanselow MS. The neuroanatomical and neurochemical basis of conditioned fear. Neurosci Biobehav Rev. 1999;23(5):743‐760. [DOI] [PubMed] [Google Scholar]
- 24. Livak KJ, Schmittgen TD. Analysis of relative gene expression data using real‐time quantitative PCR and the 2(‐delta delta C[T]) method. Methods. 2001;25(4):402‐408. [DOI] [PubMed] [Google Scholar]
- 25. Yu Z, Guindani M, Grieco SF, Chen L, Holmes TC, Xu X. Beyond t test and ANOVA: applications of mixed‐effects models for more rigorous statistical analysis in neuroscience research. Neuron. 2021;52:845‐855. [DOI] [PMC free article] [PubMed] [Google Scholar]
- 26. Vorhees CV, Williams MT. Litter effects: comments on Golub and Sobin's "statistical modeling of litter as a random effect in mixed models to manage "intralitter likeness"". Neurotoxicol Teratol. 2019;77:106852. [DOI] [PubMed] [Google Scholar]
- 27. Golub MS, Sobin CA. Statistical modeling with litter as a random effect in mixed models to manage "intralitter likeness". Neurotoxicol Teratol. 2019;77:106841. [DOI] [PubMed] [Google Scholar]
- 28. Vorhees CV, Williams MT. Issues in the design, analysis, and application of rodent developmental neurotoxicology studies. Neurotoxicol Teratol. 2021;87:107018. [DOI] [PMC free article] [PubMed] [Google Scholar]
- 29. Russell VA, Sagvolden T, Johansen EB. Animal models of attention‐deficit hyperactivity disorder. Behav Brain Funct. 2005;1:9. [DOI] [PMC free article] [PubMed] [Google Scholar]
- 30. Sagvolden T, Russell VA, Aase H, Johansen EB, Farshbaf M. Rodent models of attention‐deficit/hyperactivity disorder. Biol Psychiatry. 2005;57(11):1239‐1247. [DOI] [PubMed] [Google Scholar]
- 31. Sagvolden T, Sergeant JA. Attention deficit/hyperactivity disorder—from brain dysfunctions to behaviour. Behav Brain Res. 1998;94(1):1‐10. [PubMed] [Google Scholar]
- 32. Braun AA, Amos‐Kroohs RM, Gutierrez A, et al. 6‐Hydroxydopamine‐induced dopamine reductions in the nucleus Accumbens, but not the medial prefrontal cortex, impair Cincinnati water maze egocentric and Morris water maze Allocentric navigation in male Sprague–Dawley rats. Neurotox Res. 2016;30(2):199‐212. [DOI] [PubMed] [Google Scholar]
- 33. Braun AA, Amos‐Kroohs RM, Gutierrez A, et al. Dopamine depletion in either the dorsomedial or dorsolateral striatum impairs egocentric Cincinnati water maze performance while sparing allocentric Morris water maze learning. Neurobiol Learn Mem. 2015;118:55‐63. [DOI] [PMC free article] [PubMed] [Google Scholar]
- 34. O'Keefe J, Dostrovsky J. The hippocampus as a spatial map. Preliminary evidence from unit activity in the freely‐moving rat. Brain Res. 1971;34(1):171‐175. [DOI] [PubMed] [Google Scholar]
- 35. Hafting T, Fyhn M, Molden S, Moser MB, Moser EI. Microstructure of a spatial map in the entorhinal cortex. Nature. 2005;436(7052):801‐806. [DOI] [PubMed] [Google Scholar]
- 36. Vorhees CV, Williams MT. Assessing spatial learning and memory in rodents. ILAR J. 2014;55(2):310‐332. [DOI] [PMC free article] [PubMed] [Google Scholar]
- 37. Sugita S, Ichtchenko K, Khvotchev M, Sudhof TC. Alpha‐Latrotoxin receptor CIRL/latrophilin 1 (CL1) defines an unusual family of ubiquitous G‐protein‐linked receptors. G‐protein coupling not required for triggering exocytosis. J Biol Chem. 1998;273(49):32715‐32724. [DOI] [PubMed] [Google Scholar]
- 38. Ichtchenko K, Bittner MA, Krasnoperov V, et al. A novel ubiquitously expressed alpha‐latrotoxin receptor is a member of the CIRL family of G‐protein‐coupled receptors. J Biol Chem. 1999;274(9):5491‐5498. [DOI] [PubMed] [Google Scholar]
- 39. Arcos‐Burgos M, Jain M, Acosta MT, et al. A common variant of the latrophilin 3 gene, LPHN3, confers susceptibility to ADHD and predicts effectiveness of stimulant medication. Mol Psychiatry. 2010;15(11):1053‐1066. [DOI] [PubMed] [Google Scholar]
- 40. Clark RE, Zola SM, Squire LR. Impaired recognition memory in rats after damage to the hippocampus. J Neurosci. 2000;20(23):8853‐8860. [DOI] [PMC free article] [PubMed] [Google Scholar]
- 41. Warburton EC, Brown MW. Neural circuitry for rat recognition memory. Behav Brain Res. 2015;285:131‐139. [DOI] [PMC free article] [PubMed] [Google Scholar]
- 42. Zhang RS, Liakath‐Ali K, Südhof TC. Latrophilin‐2 and latrophilin‐3 are redundantly essential for parallel‐fiber synapse function in cerebellum. eLife. 2020;9:e54443. [DOI] [PMC free article] [PubMed] [Google Scholar]
- 43. Sable HJK, Lester DB, Potter JL, et al. An assessment of executive function in two different rat models of attention‐deficit hyperactivity disorder: spontaneously hypertensive versus Lphn3 knockout rats. Genes Brain Behav. 2021;20:e12767. [DOI] [PMC free article] [PubMed] [Google Scholar]
- 44. Martinez AF, Abe Y, Hong S, et al. An ultraconserved brain‐specific enhancer within ADGRL3 (LPHN3) underpins attention‐deficit/hyperactivity disorder susceptibility. Biol Psychiatry. 2016;80(12):943‐954. [DOI] [PMC free article] [PubMed] [Google Scholar]
Associated Data
This section collects any data citations, data availability statements, or supplementary materials included in this article.
Supplementary Materials
Table S1 Home‐cage activity P35
Table S2 Home‐cage activity P50
Table S3 Straight Channel Latency
Table S4 Cincinnati Water Maze (A) Errors
Table S5 Cincinnati Water Maze (A) Latency
Table S6 Morris Water Maze Acquisition: Path Efficiency
Table S7 Morris Water Maze Acquisition: Latency
Table S8 Morris Water Maze Acquisition: Probe Average Distance
Table S9 Morris Water Maze Reversal: Path Efficiency
Table S10 Morris Water Maze Reversal: Latency
Table S11 Morris Water Maze Reversal: Probe Average Distance
Table S12 Morris Water Maze Shift: Path Efficiency
Table S13 Morris Water Maze Shift: Latency
Table S14 Morris Water Maze Shift: Probe Average Distance
Table S15 Radial Water Maze: Latency
Table S16 Acoustic Startle Habituation
Table S17 Tactile Startle Habituation
Table S18 Prepulse Inhibition of Acoustic Startle
Table S19 Conditioned Freezing: Day‐1 Conditioning
Table S20 Conditioned Freezing: Day‐2 Contextual Freezing
Table S21 Conditioned Freezing: Day‐3: Habituation Interval
Table S22 Conditioned Freezing: Day‐3 Cued Freezing: Tone on
Table S23 Conditioned Freezing: Day‐3 Cued Freezing: Tone off
Table S24 Cincinnati Water Maze: Mirror Image Errors
Table S25 Cincinnati Water Maze: Mirror Image Latency
Data Availability Statement
Data are available upon request.