

Abstract
Octopamine regulates various physiological phenomena including memory, sleep, grooming and aggression in insects. In Drosophila, four types of octopamine receptors have been identified: Oamb, Oct/TyrR, OctβR and Octα2R. Among these receptors, Octα2R was recently discovered and pharmacologically characterized. However, the effects of the receptor on biological functions are still unknown. Here, we showed that Octα2R regulated several behaviors related to octopamine signaling. Octα2R hypomorphic mutant flies showed a significant decrease in locomotor activity. We found that Octα2R expressed in the pars intercerebralis, which is a brain region projected by octopaminergic neurons, is involved in control of the locomotor activity. Besides, Octα2R hypomorphic mutants increased time and frequency of grooming and inhibited starvation‐induced hyperactivity. These results indicated that Octα2R expressed in the central nervous system is responsible for the involvement in physiological functions.
Keywords: Drosophila melanogaster, grooming behavior, locomotor activity, octopamine receptor, starvation‐induced hyperactivity
Octα2R signaling regulated activation of locomotor activity, inhibition of grooming and starvation‐induced hyperactivity.
1. INTRODUCTION
In vertebrates, noradrenaline (NA) is a neurotransmitter that plays an important role in controlling behaviors such as sleep–wake and fight‐or‐flight behaviors in the central nervous system. In Drosophila, octopamine (OA) has a structure and function similar to NA. Both OA and NA are biosynthesized in similar pathways from tyrosine. Tyrosine is directly decarboxylated by tyrosine‐decarboxylase (TDC) and turns into tyramine (TA), which is then hydroxylated by tyramine beta‐hydroxylase (TβH) and yields OA. On the other hand, tyrosine is first hydroxylated at its phenyl residue by tyrosine hydroxylase (TH) and turns into L‐3,4‐dihydroxyphenylalanine (L‐DOPA). Then L‐DOPA is decarboxylated by dopa‐decarboxylase (DDC) and turns into dopamine (DA), which is then hydroxylated by dopamine beta‐hydroxylase (DβH) and yields NA. OA has been reported to be involved in various physiological phenomena like NA. For example, OA is involved in the regulation of fight‐or‐flight behavior, locomotor activity, sleep, feeding, memory and the proliferation of germline stem cells after mating. 1 , 2 , 3 , 4 Elucidation of the details of OA signaling leads to novel regulatory mechanisms of physiological phenomena. The major receptors for monoamines are G protein‐coupled receptors. The three types of OA receptors reported are Oamb, Oct/TyrR and OctβR. 5 , 6 The relationship between each receptor and physiological function was reported. Oamb belongs to the α‐receptor family and activates cellular calcium and cAMP signaling. 6 Oamb is expressed in the mushroom body (MB) and is involved in memory enhancement by providing input of sweet taste information. 7 , 8 Oct/TyrR has a higher affinity for TA than OA and inhibits the activity of adenylate cyclase. Oct/TyrR is expressed in astrocytes and regulates DA neuron activity and startle response. 9 OctβR belongs to the β‐receptor family and has three subtypes Octβ1R, Octβ2R and Octβ3R. 10 These receptors primarily increase intracellular cAMP levels and are involved in changes of neural plasticity. 11 Recently, a novel OA receptor (CsOA3) that decreases cAMP concentration has been identified in the rice stem borer, Chilo suppressalis. 12 An orthologous gene for CsOA3 exists in honeybees, and pharmacological studies have shown that it is an OA receptor. 13
An orthologous gene α2‐adrenergic‐like octopamine receptor (Octα2R) has also been reported in Drosophila, and it has been shown that the receptor is responsive to serotonin (5‐HT) as well as OA and that there is a difference in expression between males and females, with the expression being particularly strong in males. 14 However, it is unclear whether Octα2R regulates the physiological phenomena. In this study, we confirmed that Octα2R was a novel OA receptor by the pharmacological assay and explored the physiological phenomena regulated by Octα2R signaling.
2. MATERIALS AND METHODS
2.1. Functional and pharmacological analysis of Octα2R receptors in cultured cells
A nested PCR was performed as a template of cDNA from w 1118 line to obtain the fragment including Octα2R open reading frame (ORF) (also known as CG18208 or accession No. NM_142497.3). The ORF fragment was ligated into pCR™ 2.1‐TOPO® (Thermo Fisher Scientific, Massachusetts). A PCR was performed with a pair of a HindIII site‐attached forward primer and a KpnI site‐attached primer and a template of the constructed TOPO vector. The amplified fragment was inserted into the corresponding site of the expression vector pcDNA3 (Invitrogen, Massachusetts).
The constructed pcDNA3‐Octα2R vector was transfected into HEK‐293 cells or CHO‐K1 cells with Lipofectamine® 3000 (Thermo Fisher Scientific, Massachusetts). The transfected cells were cultured and selected in each culture medium (DMEM [Nacalai Tesc., Kyoto, Japan] for HEK‐293 and F‐12 Nutrient Mixture [Life Technologies, California] for CHO‐K1 supplemented with 10% FBS [Life Technologies]) with G418 (1 mg/ml) over a period of about 4 weeks at 37°C and 5% CO2. The selected polyclonal cells, HEK‐Octα2R cells and CHO‐Octα2R cells, were stored at −80°C until use.
We used aequorin, a bioluminescent Ca2+ sensor, to measure Ca2+ response of the HEK‐Octα2R cells and CHO‐Octα2R cells to ligands. 15 Briefly, pcDNA3‐mtAEQ (2.5 μg), containing mitochondria‐targeted apoaequorin (mtAEQ), with or without 2.5 μg of pCMV‐XL4 inserting GNA15 (human Gα15 subunit cDNA) (OriGene, Maryland) was transiently transfected into HEK‐Octα2R cells or CHO‐Octα2R cells (6 × 10⁵/3 ml, 3.5 mm diameter dish) and then treated with 5 μM coelenterazine h (Wako, Tokyo, Japan) for 4 h. A 180 μl portion of the cell suspension was quickly added to a 20 μl aliquot of OA or other biogenic amines (DA, TA, NA and synephrine [SY]). In an antagonist experiment, phentolamine, epinastine or yohimbine was mixed together with OA and treated with each cell. The luminescence of the sample was recorded for 30 s immediately after drug administration using a GENE LIGHT 55 luminometer (Microtec Co., Ltd., Chiba, Japan).
2.2. Fly stocks and culture environment
All flies were harvested at 25°C, 12 h/12 h light and dark cycles, in 60% humidity. The conventional food containing 4% cornmeal, 8% glucose, 2.4% dry yeast powder, 1% wheat germ, 0.8% agar and 0.8% propionic acid was used. We used PBac{WH}Octα2R f03483 (#18659), RNAi control fly (#35786), UAS‐Octα2R RNAi (#50678), Octα2R Trojan‐Gal4 (#67636), Octα2R T2A‐Gal4 (#84610), Octα2R T2A‐LexA (#84370), Tdc2‐Gal4 (#9319), DDC‐Gal4 (#7009), R24B11‐Gal4 (#49070), R69F08‐Gal4 (#39499), R46H04‐Gal4 (#50280), R30G03‐Gal4 (#49646) and UAS‐mCD8::RFP, LexAop2‐mCD8::GFP (#32229) from the Bloomington Drosophila Stock Center. NP0010 was obtained from the Kyoto Stock Center. TH‐Gal4 was gifted from Dr. Jay Hirsh, OK371‐Gal4 was gifted from Dr. Hermann Aberle, GAD‐Gal4 was gifted from Dr. Takaomi Sakai, dilp2‐Gal4 was gifted from Dr. Linda Partridge and 121Y‐Gal4 and 30Y‐Gal4 were gifted from Dr. J. Douglas Armstrong.
2.3. Locomotor activity and sleep analysis
Four to 7 days after eclosion, males were separated under CO2 anesthesia and placed in glass tubes (length, 65 mm; inside diameter, 3 mm) which contained 1% agar and 5% sucrose. The locomotor activity was monitored as a number of crossing infrared beam (IR) by the Drosophila activity monitoring (DAM) System (Trikinetics, Massachusetts). Data were collected every 1 min. Sleep defined as immobile time over 5 min was calculated. 16 , 17
2.4. Grooming analysis using the multibeam monitor
Grooming was defined by the number of hyperactivity times (over 30 counts per 1 min). We used the Trikinetics multibeam activity monitor (MB5) that can detect activity counts and moving positions according to 17 IR beams. Data were collected every 1 min. We analyzed counts of over 30 counts per 1 min at the same position.
2.5. Grooming analysis of decapitated flies
Male flies of 8–10 h after eclosion were used. We decapitated the flies within 5 min under CO2 anesthesia. After surgery, flies were recovered for 0.5 to 2 h in a humid petri plate. Only decapitated flies that showed an upright posture and a response of grooming after mechanical stimulation by birdwing were used in this study. 10 mM (+)−octopamine hydrochloride (Sigma‐Aldrich) were dissolved in PBS. After applying the drug to the exposed nerve cord using a micropipette, we observed grooming behavior for 2 min. We measured the time of foreleg grooming.
2.6. Measurement of mRNA level by qPCR
All of the male flies were frozen at ZT 6 using liquid nitrogen. Total RNA was collected from 10 frozen heads of flies using RNAiso (Takara). Total RNA was reverse transcripted to cDNA using ReverTra Ace® qPCR RT Master Mix (TOYOBO). cDNA was used for qPCR using THUNDERBIRD® SYBR qPCR Mix (TOYOBO) and Thermal Cycler Dice® Real‐Time System II (Takara). The primers were 5′‐TGGTACGACA ACGAGTTTGG‐3′ and 5′‐TTTCAGGCCG TTTCTGAAGT‐3′ for GAPDH2 and 5′‐CAGTTGCATC ATGGTCTTTG TGT‐3′ and 5′‐GCATCGGTAT TGTTCCTTTC TTG‐3′ for Octα2R. Each mRNA expression level was normalized to housekeeping gene GAPDH2. Data were shown as normalized values to the control sample.
2.7. Statistical analysis
We analyzed data using by Microsoft Excel and the statistical software package RStudio Ver1.4.1717.
3. RESULTS
3.1. Octα2R responds to OA and representative OA antagonists specifically
Firstly, HEK‐Octα2R or CHO‐Octα2R cells were examined for response to OA using AEQ assays without co‐transfection with Gα15. When tested with OA at 10−9–10−5 M, both cells showed no OA‐dependent luminescence signal (data not shown). In contrast, co‐transfection with Gα15 induced a dose‐dependent luminescence at a range of 10−10–10−3 M OA in both cells (Figure 1A). In HEK‐293 cells without Octα2R expression, OA administration did not increase luminescence (Figure S1).
FIGURE 1.

Response of HEK‐Octα2R and CHO‐Octα2R cells to OA with Gα15. (A) Graph values are shown as relative luminescence (%) of the maximum AEQ response at 10−5 M OA. Data represent the mean ± SEM of three independent experiments each performed in duplicate. Asterisks mean a significant difference from the control (Ctrl) using the Dunnett test (*p < 0.05 and **p < 0.01) in multiple comparisons. Response of HEK‐Octα2R and CHO‐Octα2R cells to other biogenic amines. (B) Each biogenic amine was administrated at 10−5 M. Values are shown as relative luminescence (%) of the AEQ response at OA application. Data represent the mean ± SEM of three independent experiments each performed in duplicate. Asterisks mean a significant difference from the control (Ctrl) using the Dunnett test (**p < 0.01) in multiple comparisons. Ctrl; control, OA; octopamine, TA; tyramine, DA; dopamine, NA; noradrenaline, SY; synephrine. Antagonist evaluation in HEK‐Octα2R. (C) Each antagonist was administrated at 10−9–10−5 M along with 10−5 M OA. The inhibitory activity is shown as residual luminescence (%) to OA‐induced luminescence (100%). Data represent the mean ± SEM of three independent experiments each performed in duplicate. Asterisks mean a significant difference from each OA‐induced luminescence using the Dunnett test (*p < 0.05 and **p < 0.01). PA; phentolamine, EP; epinastine, YO; yohimbine
Next, representative six biogenic amines including OA were examined for agonist activity on Octα2R expressed in each cell. 10 In both HEK‐Octα2R cells and CHO‐Octα2R cells, 10−5 M SY showed agonist activity nearly equal to 10−5 M OA. TA, DA and NA were equivalent or inferior to control (Figure 1B). Although Qi et al. reported that Octα2R responds not only to OA but also 5‐HT using a cAMP assay, 14 we found that HEK‐Octα2R cells displayed no Ca2+ response to 5‐HT at concentrations from 10−8 to 10−4 M in our assay (Figure S2). Considering the general OA receptor pharmacology, 18 Octα2R is a subtype of Drosophila OA receptor.
We also evaluated whether Ca2+‐dependent luminescence stimulated by OA is blocked by representative OA receptor antagonists (phentolamine [PA], epinastine [EP] and yohimbine [YO]) in HEK‐Octα2R cells. 18 The 10−5 M OA‐induced luminescence was reduced by more than 90% by 10−6 M or higher concentrations of EP and PA and by 10−5 M YO (Figure 1C). IC50 values of EP, PA and YO were 1.0 × 10⁻⁷ M, 9.3 × 10⁻⁸ M and 1.8 × 10⁻⁵ M, respectively. These results showed that Octα2R has a further pharmacological feature as OA receptors.
3.2. Octα2R hypomorph and knockdown mutants decreased locomotor activity
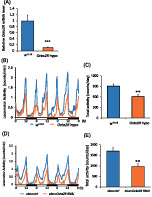
Figure 1 showed that Octα2R responded to OA. These results were consistent with the previous study. 14 However, the biological function of Octα2R is unknown. OA signaling is related to various biological functions such as sleep, locomotor activity, feeding, grooming, and aggression in Drosophila. To examine whether that OA signaling through Octα2R regulates the biological functions in adult Drosophila, we used Piggy Bac transposon insertion mutants (Octα2R hypo) in which Octα2R mRNA level decreased by 90% (Figure 2A). We analyzed locomotor activity using the DAM under the 12 h:12 h light and dark conditions. Octα2R hypo decreased evening peak and total locomotor activity (Figure 2B,C). Octα2R hypo did not show a significant change in the total amount of sleep (Figure S3). The Octα2R mRNA levels tended to be decreased in adult heads of Octα2R RNAi‐expressing flies using elav‐Gal4, but did not reach statistical significance (Figure S4A). On the other hand, The Octα2R mRNA levels were significantly decreased in Octα2R knockdown flies using Actin‐Gal4, which is a Gal4 driver of all cells (Figure S4B). Pan‐neuronal knockdown of Octα2R decreased locomotor activity similarly to Octα2R hypo (Figure 2D,E). These data suggested that Octα2R expressed in neurons regulated locomotor activity.
FIGURE 2.

Octα2R hypo and pan‐neuronal knockdown mutants showed decreased activity counts. (A) Relative mRNA level of Octα2R in the heads of w 1118 (blue) and Octα2R hypo (BDSC 18659) (orange). Data represent average ± SEM which normalized to GAPDH2 (n = 3). Student's t‐test detected a significant difference. (***p < 0.001). (B) Locomotor activity profiles in 1 min interval for w 1118 (blue) or Octα2R hypo (orange). Locomotor activity was monitored over 3 days in the 12 h:12 h/light: dark (LD) conditions. (C) Total daily locomotor counts for w 1118 (blue) and Octα2R hypo (orange). Data represent average ± SEM (n = 32, 22). Student's t‐test detected a significant difference (**p < 0.01). (D) Locomotor activity profiles in 1 min interval for elav > ctrl (blue) or elav > UAS‐Octα2R RNAi (orange). Locomotor activity was monitored over 3 days in LD conditions. (E) Total daily locomotor counts for elav > ctrl (blue) or elav > UAS‐Octα2R RNAi (orange). Data represent average ± SEM (n = 16). Student's t‐test detected a significant difference (**p < 0.01)
3.3. Octα2R is expressed in the central complex, PI and MB
OA neurons project to various region including the optic lobe, the mushroom body (MB), the central complex. 19 The expression pattern of each OA receptor is showed. For example, Oamb is expressed mainly in MB and the broad brain region. 6 However, the expression region of Octα2R is unknown in the central nervous system (CNS) of Drosophila. To examine expression patterns in adult CNS, we used the T2A‐Gal4 line in which T2A‐Gal4 sequence is inserted to the 3′ terminus of Octα2R coding sequence and the Trojan‐Gal4 line, in which MiMIC cassette is exchanged by T2A‐Gal4‐containing cassette. 20 , 21 These lines were crossed with UAS‐mCD8::GFP. We confirmed that both lines labeled the pars intercerebralis (PI), the ellipsoid body (EB) of the central complex, the MB and the ventral nerve code (VNC) (Figure 3). To confirm whether these drivers were expressed in the same cells, we used Octα2R Trojan‐Gal4 and Octα2R T2A‐LexA. We found that Octα2R T2A‐LexA and Octα2R Trojan‐Gal4 labeled the same cell types of EB neurons, but did not find any PI cells in which these two drivers were co‐expressed (Figure S5). These results suggested that Octα2R is expressed in PI region, the EB and the MB.
FIGURE 3.

Expression patterns of Octα2R‐Gal4 drivers in CNS. (A) A schema of the anatomy of the brain and VNC in Drosophila. (B–E) The expression patterns of the Octα2R‐Gal4 lines were visualized with a GFP in the brain (B, C) or VNC (D, E). Expression was characterized by crossing Octα2R Trojan‐Gal4 (B, D) or Octα2R T2A‐Gal4 (C, E) with UAS‐mCD8::GFP. Scale bar = 100 μm
3.4. Octα2R knockdown in PI decreased locomotor activity
We confirmed that Octα2R expressed in the MB, the EB and PI. For other OA receptors, the relationship between the receptor‐expressing regions and physiological functions is reported. For example, Oamb expressed in PI is related to sleep regulation and Octα2R expressed in MB α‘β’ Kenyon cells is related to the formation of the anesthesia‐resistant memory. 11 , 22 To detect the region that was related to the regulation of locomotor activity, we screened Gal4 drivers. Knockdown of Octα2R in dilp2‐Gal4 and 30Y‐Gal4, which are PI labeling drivers (Figure S6), decreased the locomotor activity (Figure 4). To identify the neuronal types in which Octα2R is expressed, we performed knockdown Octα2R by using neurotransmitter drivers and found a decrease in locomotor activity in various types of neurons (Figure 4). These results suggest that the Octα2R expressed in PI regulates the locomotor activity.
FIGURE 4.
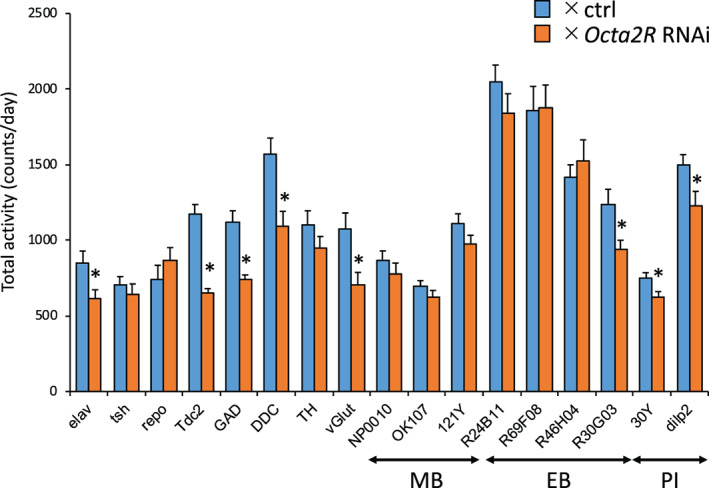
Knockdown of Octα2R in PI region decreased locomotor activity. Total daily locomotor counts for progeny collected from between 17 Gal4 drivers and UAS‐Octα2R RNAi (orange). For controls, each Gal4 driver was crossed to ctrl flies (blue). Data represent average ± SEM (n = 10–16). Student's t‐test detected a significant difference (*p < 0.05)
3.5. Octα2R is involved in hyperactivity during starvation
OA signaling has a relationship with feeding behavior. OA signaling has a key role in transmitting information about food, such as sweetness and nutrition and promotes hyperactivity during starvation. 23 To investigate whether Octα2R is involved in starvation‐induced hyperactivity, we measured the locomotor activity under starvation condition, in which the food contains only 1% agarose. Starvation induced hyperactivity in wild type (w 1118 ) flies, but not in Octα2R hypo (Figure 5A,B). These results suggested that Octα2R is involved in starvation‐induced hyperactivity.
FIGURE 5.

Octα2R hypo suppressed starvation‐induced hyperactivity. (A) Activity profiles in 1 min intervals for w 1118 (blue) and Octα2R hypo (orange) in sucrose‐ (dot) or sucrose+ (line) conditions (n = 10–13). Locomotor activity was monitored 1 day after the change of food in the 12‐h light: dark cycle (LD) conditions. (B) Total daily locomotor counts for w 1118 or Octα2R hypo under sucrose‐ (orange) or sucrose+ (blue) conditions. Data represent average ± SEM. One‐way ANOVA with Bonferroni's multiple comparison test detected a significant difference (**p < 0.01, *p < 0.05 n.s.: p ≥ 0.05)
3.6. Octα2R is involved in the regulation of grooming
In the locomotor activity data recorded by the DAM, Octα2R hypo showed a characteristic activity peak (Figure 6A). A frequency of locomotor activity peak which is over 30 counts per 1 min was increased in Octα2R hypo, despite reduced total daily activity (Figure 6B). The over 30 counts per 1 min in DAM data were reported to indicate grooming on the IR beam. 24 Flies spend their time near food in glass tubes, therefore detection sensitivity of grooming in the central part of the tube, where infrared beam detector locates, is low in this condition. 16 For more detailed analysis, we used a multibeam monitor with 17 IR beams across the tube (Figure 6C). 25 We found that over 30 counts per 1 min was significantly decreased in Octα2R hypo (Figure 6D,E).
FIGURE 6.

Octα2R hypo increased grooming frequency. (A) Representative locomotor records of individual w 1118 and Octα2R hypo by DAM system. The red line indicates 30 counts/min. (B) Average of frequency over 30 counts for w 1118 (blue) or Octα2R hypo (orange). Data represent average ± SEM (n = 32). Student's t test detected a significant difference (*p < 0.05). (C) Schematic of Multibeam Monitor. 17 IR beams can detect the activity and position of fly in tubes. (D, E) Average of frequency over 30 counts of each beam position and total of all for w 1118 (blue) or Octα2R hypo (orange). Student's t‐test detected a significant difference (**p < 0.01)
Previous reports showed that grooming was increased in decapitated flies treated with OA. 26 To confirm that whether Octα2R hypo response to OA, we performed grooming assay using decapitated flies (Figure 7A). Octα2R hypo showed increased grooming time in conditions without OA administrations (Figure 7B). In wild type (w 1118 ) treated with OA, the time of foreleg grooming was increased (Figure 7B). In contrast, Octα2R hypo treated with OA did not show significant increased time of grooming (Figure 7B). These results suggested that OA signaling via Octα2R inhibits grooming.
FIGURE 7.

Decapitated Octα2R hypo increased grooming length of time. (A) A schematic of grooming assay. Decapitated flies were treated with PBS (blue) or 10 mM OA (orange) in 4 ~ 5 s using P20 micropipette. (B) The average length of grooming time during 2 min for w 1118 or Octα2R hypo. Data represent average ± SEM (n = 7–11). One‐way ANOVA (F = 3.2439, p = 0.0356) with Bonferroni's multiple comparison test (*p < 0.05)
4. DISCUSSION
Qi and colleagues have reported that activation of Octα2R reduced intracellular cAMP levels using a cAMP assay, while it does not affect Ca2+ levels. 14 Consistent with these results, we found that Octa2R‐expressing cells showed no response to OA at concentrations from 10−10 to 10−3 M in AEQ assays without Gα15 subunit. Although Octα2R is a Gi protein‐coupled receptor, in this study, use of AEQ assays with the Gα15 subunit enables the response of Octα2R to octopamine to be detected as intracellular Ca2+‐dependent luminescence.
This study showed that Octα2R signaling regulates the locomotor activity, grooming and starvation‐induced hyperactivity. Results in Figure 2 suggested that Octα2R in neurons regulated the locomotor activity. Most of Octα2R knockdown flies using neurotransmitter Gal4 drivers decreased the locomotor activity, suggesting that the function of Octα2R is not limited to specific neurons (Figure 4). Two drivers, dilp2‐Gal4 and 30Y‐Gal4, showed a significant decrease in locomotor activity (Figure 4). The brain region where the expression of these two drivers overlapped was the PI (Figure S6). In addition, we found that two different Octα2R‐Gal4 drivers labeled PI region (Figure 3). These results suggested that Octα2R expressed in the PI is involved in the regulation of locomotor activity. On the other hand, 30Y‐Gal4 and dilp2‐Gal4 were not specific for the PI. These results did not exclude the possibility that 30Y‐Gal4 and dilp2‐Gal4‐expressing cells other than PI neurons may also affect locomotor activity. Knockdown of Octα2R in R30G03‐Gal4 expressing cells decreased the locomotor activity. R30G03‐GAL4 is expressed in not only the EB but also PI region. The PI is projected by octopaminergic neurons, and it has been reported that activation and inhibition of PI cells decreases and increases the amount of sleep, respectively. 22 To elucidate the details of the effect of Octα2R on PI region, the recording of neuronal activity in the PI region using Ca2+ imaging and electrophysiology with the Octα2R mutants is required.
Octα2R hypo did not show hyperactivity during starvation (Figure 5). In humans and many other organisms, activity is increased and sleep is reduced during starvation. In Drosophila, hyperactivity during starvation is regulated by OA signaling. 23 Adipokinetic hormone (AKH), an analog of glucagon secreted during starvation, activates octopaminergic neurons and causes hyperactivity. 4 It is possible that Octα2R received OA signal activated by AKH during starvation.
The time and frequency of grooming were increased in Octα2R hypo, suggested that the Octα2R signaling in the VNC involved in grooming behavior (Figures 6 and 7). Furthermore, Octα2R hypo treated with OA did not increase time of grooming. These results suggest that Octα2R inhibits OA signaling.
In addition, the octopamine synthase Tβh knockout mutants increased the number of grooming despite the increased amount of sleep. 27 In this study, the amount of the locomotor activity measured by DAM system was reduced, but over 30 counts of activity was increased (Figures 2 and 6). The grooming behavior may inhibit locomotor activity. We measured foreleg grooming of decapitated flies by video analysis (Figure 7). Elucidation of detail of regulation mechanism of grooming by Octα2R signaling is possible to provide a novel link between grooming behavior and locomotor activity.
CONFLICT OF INTEREST
The authors declare that no competing interests exist.
Supporting information
Figure S1. OA application did not increase luminescence in HEK‐293 cells without Octα2R expression. Graph values are shown as relative luminescence (%) of control. 10−3 M carbachol (CCh), an agonist of muscarinic receptors, was used as a positive control to check the AEQ assay system. Data represent the mean (n = 2).
Figure S2. HEK‐Octα2R cells displayed no response to serotonin in AEQ assay with Gα15. Graph values are shown as relative luminescence (%) of control. Data represent the mean ± SEM of 3 independent experiments each performed in duplicate. n.s. indicates not significant (p ≥ 0.05, Dunnett test).
Figure S3. Octα2R hypo did not show a significant effect on sleep. (A) Sleep profiles in 30 min interval for w1118 (blue) or Octα2R hypo (orange). Sleep was monitored over 3 days in the 12 h:12 h/light: dark (LD) conditions. (B) Total daily sleep for w1118 (blue) and Octα2R hypo (orange). n.s. indicates not significant (p ≥ 0.05, Student's t‐test).
Figure S4. Knockdown efficiency of Octα2R RNAi. (A) Relative mRNA level of Octα2R in the heads of elav>ctrl (blue) or elav>UAS‐Octα2R RNAi (orange). (B) Relative mRNA level of Octα2R in the heads of Act>ctrl (blue) or Act>UAS‐Octα2R RNAi (orange). Data represent average, which normalized to GAPDH2, ± SEM (n = 3). Student's t‐test detected a significant difference (**p < 0.01).
Figure S5. Comparison of the expression patterns of Octα2R Trojan‐Gal4 and Octα2R T2A‐LexA in the adult brain. mCD8::RFP (magenta in A) was expressed by Octα2R Trojan‐Gal4 and mCD8::GFP (green in B) was expressed by Octα2R T2A‐LexA. The right panel (C) shows the merged image. Scale bar = 100 μm.
Figure S6. Expression patterns of 30Y‐Gal4 and dilp2‐Gal4 in the adult brain. The expression patterns of 30Y‐Gal4 (A) or dilp2‐Gal4 (B) in the adult brains were visualized using UAS‐mCD8::GFP. Scale bar = 100 μm.
ACKNOWLEDGMENTS
We thank the Bloomington Drosophila Stock Center, the Vienna Drosophila RNAi Center for providing the fly lines used in this study. In addition, we thank members of the Kume lab for helpful discussions. This work was supported by the Japan Society for the Promotion of Science (JSPS) KAKENHI Grant Numbers JP18H02481, 21H02529 Kazuhiko Kume, JP15K07414, Hiroto Ohta, JP26507008, JP17K08571, Jun Tomita.
Nakagawa H, Maehara S, Kume K, Ohta H, Tomita J. Biological functions of α2‐adrenergic‐like octopamine receptor in Drosophila melanogaster . Genes, Brain and Behavior. 2022;21(6):e12807. doi: 10.1111/gbb.12807
Hiroyuki Nakagawa and Shiori Maehara have contributed equally to this work.
Funding information The Japan Society for the Promotion of Science (JSPS) KAKENHI, Grant/Award Numbers: 21H02529, JP15K07414, JP17K08571, JP18H02481, JP26507008
Contributor Information
Hiroto Ohta, Email: hiohta@bio.sojo-u.ac.jp.
Jun Tomita, Email: tomita@phar.nagoya-cu.ac.jp.
DATA AVAILABILITY STATEMENT
The data that support the findings of this study are available from the corresponding author upon reasonable request.
REFERENCES
- 1. Crocker A, Sehgal A. Octopamine regulates sleep in Drosophila through protein kinase A‐dependent mechanisms. J Neurosci. 2008;28:9377‐9385. [DOI] [PMC free article] [PubMed] [Google Scholar]
- 2. Hoyer SC, Eckart A, Herrel A, Zars T, Fischer SA, Hardie SL, Heisenberg M. Octopamine in male aggression of Drosophila . Curr Biol. 2008;18:159‐167. [DOI] [PubMed] [Google Scholar]
- 3. Yoshinari Y, Ameku T, Kondo S, Tanimoto H, Kuraishi T, Shimada‐Niwa Y, Niwa R. Neuronal octopamine signaling regulates mating‐induced germline stem cell increase in female Drosophila melanogaster . Elife. 2020;9:e57101. [DOI] [PMC free article] [PubMed] [Google Scholar]
- 4. Yu Y, Huang R, Ye J, Zhang V, Wu C, Cheng G, Jia J, Wang L. Regulation of starvation‐induced hyperactivity by insulin and glucagon signaling in adult Drosophila . Elife. 2016;5:e15693. [DOI] [PMC free article] [PubMed] [Google Scholar]
- 5. Evans PD, Maqueira B. Insect octopamine receptors: a new classification scheme based on studies of cloned Drosophila G‐protein coupled receptors. Invert Neurosci. 2005;5:111‐118. [DOI] [PubMed] [Google Scholar]
- 6. Han KA, Millar NS, Davis RL. A novel octopamine receptor with preferential expression in Drosophila mushroom bodies. J Neurosci. 1998;18:3650‐3658. [DOI] [PMC free article] [PubMed] [Google Scholar]
- 7. Burke CJ, Huetteroth W, Owald D, Perisse E, Krashes MJ, Das G, Gohl D, Silies M, Certel S, Waddell S. Layered reward signalling through octopamine and dopamine in Drosophila . Nature. 2012;492:433‐437. [DOI] [PMC free article] [PubMed] [Google Scholar]
- 8. Huetteroth W, Perisse E, Lin S, Klappenbach M, Burke C, Waddell S. Sweet taste and nutrient value subdivide rewarding dopaminergic neurons in Drosophila . Curr Biol. 2015;25:751‐758. [DOI] [PMC free article] [PubMed] [Google Scholar]
- 9. Ma Z, Stork T, Bergles DE, Freeman MR. Neuromodulators signal through astrocytes to alter neural circuit activity and behaviour. Nature. 2016;539:428‐432. [DOI] [PMC free article] [PubMed] [Google Scholar]
- 10. Maqueira B, Chatwin H, Evans PD. Identification and characterization of a novel family of Drosophila beta‐adrenergic‐like octopamine G‐protein coupled receptors. J Neurochem. 2005;94:547‐560. [DOI] [PubMed] [Google Scholar]
- 11. Wu C‐L, Shih M‐FM, Lee P‐T, Chiang A‐S. An octopamine‐mushroom body circuit modulates the formation of anesthesia‐resistant memory in Drosophila . Curr Biol. 2013;23:2346‐2354. [DOI] [PubMed] [Google Scholar]
- 12. Wu S‐F, Xu G, Qi Y‐X, Xia R‐Y, Huang J, Ye G‐Y. Two splicing variants of a novel family of octopamine receptors with different signaling properties. J Neurochem. 2014;129:37‐47. [DOI] [PubMed] [Google Scholar]
- 13. Blenau W, Wilms JA, Balfanz S, Baumann A. AmOctα2R: functional characterization of a honeybee Octopamine receptor inhibiting adenylyl cyclase activity. Int J Mol Sci. 2020;21:9334. [DOI] [PMC free article] [PubMed] [Google Scholar]
- 14. Qi Y‐X, Xu G, Gu G‐X, Mao F, Ye G‐Y, Liu W, Huang J. A new Drosophila octopamine receptor responds to serotonin. Insect Biochem Mol Biol. 2017;90:61‐70. [DOI] [PubMed] [Google Scholar]
- 15. Uchiyama H, Maehara S, Ohta H, Seki T, Tanaka Y. Elevenin regulates the body color through a G protein‐coupled receptor NlA42 in the brown planthopper Nilaparvata lugens . Gen Comp Endocrinol. 2018;258:33‐38. [DOI] [PubMed] [Google Scholar]
- 16. Hendricks JC, Finn SM, Panckeri KA, Chavkin J, Williams JA, Sehgal A, Pack AI. Rest in Drosophila is a sleep‐like state. Neuron. 2000;25:129‐138. [DOI] [PubMed] [Google Scholar]
- 17. Shaw PJ, Cirelli C, Greenspan RJ, Tononi G. Correlates of sleep and waking in Drosophila melanogaster. Science. 2000;287:1834‐1837. [DOI] [PubMed] [Google Scholar]
- 18. Ohta H, Ozoe Y. Molecular signalling, pharmacology, and physiology of octopamine and tyramine receptors as potential insect pest control targets. Advances in Insect Physiology. Elsevier Inc.; 2014:73‐166. [Google Scholar]
- 19. Busch S, Selcho M, Ito K, Tanimoto H. A map of octopaminergic neurons in the Drosophila brain. J Comp Neurol. 2009;513:643‐667. [DOI] [PubMed] [Google Scholar]
- 20. Deng B, Li Q, Liu X, Cao Y, Li B, Qian Y, Xu R, Mao R, Zhou E, Zhang W, Huang J, Rao Y. Chemoconnectomics: mapping chemical transmission in Drosophila . Neuron. 2019;101:876‐893.e4. [DOI] [PubMed] [Google Scholar]
- 21. Lee P‐T, Zirin J, Kanca O, Lin W‐W, Schulze KL, Li‐Kroeger D, Tao R, Devereaux C, Hu Y, Chung V, Fang Y, He Y, Pan H, Ge M, Zuo Z, Housden BE, Mohr SE, Yamamoto S, Levis RW, Spradling AC, Perrimon N, Bellen HJ. A gene‐specific T2A‐GAL4 library for Drosophila . Elife. 2018;7:e35574. [DOI] [PMC free article] [PubMed] [Google Scholar]
- 22. Crocker A, Shahidullah M, Levitan IB, Sehgal A. Identification of a neural circuit that underlies the effects of octopamine on sleep:wake behavior. Neuron. 2010;65:670‐681. [DOI] [PMC free article] [PubMed] [Google Scholar]
- 23. Yang Z, Yu Y, Zhang V, Tian Y, Qi W, Wang L. Octopamine mediates starvation‐induced hyperactivity in adult Drosophila . Proc Natl Acad Sci U S A. 2015;112:5219‐5224. [DOI] [PMC free article] [PubMed] [Google Scholar]
- 24. King LB, Koch M, Murphy KR, Velazquez Y, Ja WW, Tomchik SM. Neurofibromin loss of function drives excessive grooming in Drosophila . G3 (Bethesda). 2016;6:1083‐1093. [DOI] [PMC free article] [PubMed] [Google Scholar]
- 25. Garbe DS, Bollinger WL, Vigderman A, Masek P, Gertowski J, Sehgal A, Keene AC. Context‐specific comparison of sleep acquisition systems in Drosophila . Biol Open. 2015;4:1558‐1568. [DOI] [PMC free article] [PubMed] [Google Scholar]
- 26. Yellman C, Tao H, He B, Hirsh J. Conserved and sexually dimorphic behavioral responses to biogenic amines in decapitated Drosophila . Proc Natl Acad Sci U S A. 1997;94:4131‐4136. [DOI] [PMC free article] [PubMed] [Google Scholar]
- 27. Zhao Z, Zhao X, He T, Wu X, Lv P, Zhu AJ, Du J. Epigenetic regulator Stuxnet modulates octopamine effect on sleep through a stuxnet‐polycomb‐Octβ2R cascade. EMBO Rep. 2021;22:e47910. [DOI] [PMC free article] [PubMed] [Google Scholar]
Associated Data
This section collects any data citations, data availability statements, or supplementary materials included in this article.
Supplementary Materials
Figure S1. OA application did not increase luminescence in HEK‐293 cells without Octα2R expression. Graph values are shown as relative luminescence (%) of control. 10−3 M carbachol (CCh), an agonist of muscarinic receptors, was used as a positive control to check the AEQ assay system. Data represent the mean (n = 2).
Figure S2. HEK‐Octα2R cells displayed no response to serotonin in AEQ assay with Gα15. Graph values are shown as relative luminescence (%) of control. Data represent the mean ± SEM of 3 independent experiments each performed in duplicate. n.s. indicates not significant (p ≥ 0.05, Dunnett test).
Figure S3. Octα2R hypo did not show a significant effect on sleep. (A) Sleep profiles in 30 min interval for w1118 (blue) or Octα2R hypo (orange). Sleep was monitored over 3 days in the 12 h:12 h/light: dark (LD) conditions. (B) Total daily sleep for w1118 (blue) and Octα2R hypo (orange). n.s. indicates not significant (p ≥ 0.05, Student's t‐test).
Figure S4. Knockdown efficiency of Octα2R RNAi. (A) Relative mRNA level of Octα2R in the heads of elav>ctrl (blue) or elav>UAS‐Octα2R RNAi (orange). (B) Relative mRNA level of Octα2R in the heads of Act>ctrl (blue) or Act>UAS‐Octα2R RNAi (orange). Data represent average, which normalized to GAPDH2, ± SEM (n = 3). Student's t‐test detected a significant difference (**p < 0.01).
Figure S5. Comparison of the expression patterns of Octα2R Trojan‐Gal4 and Octα2R T2A‐LexA in the adult brain. mCD8::RFP (magenta in A) was expressed by Octα2R Trojan‐Gal4 and mCD8::GFP (green in B) was expressed by Octα2R T2A‐LexA. The right panel (C) shows the merged image. Scale bar = 100 μm.
Figure S6. Expression patterns of 30Y‐Gal4 and dilp2‐Gal4 in the adult brain. The expression patterns of 30Y‐Gal4 (A) or dilp2‐Gal4 (B) in the adult brains were visualized using UAS‐mCD8::GFP. Scale bar = 100 μm.
Data Availability Statement
The data that support the findings of this study are available from the corresponding author upon reasonable request.