

Abstract
The purpose of this present study was to improve the quantification of microvascular networks depicted in three-dimensional (3D) super-resolution ultrasound (SR-US) images and compare results with matched brightfield microscopy and B-mode ultrasound (US) images. Standard contrast-enhanced US (CEUS) images were collected using a high-frequency US scanner (Vevo 3100, FUJIFILM VisualSonics Inc) equipped with an MX250 linear array transducer. Using a developing chicken embryo as our model system, US imaging was performed after administration of a custom microbubble (MB) contrast agent. Guided by stereo microscopy, MBs were introduced into a perfused blood vessel by microinjection with a glass capillary needle. Volume data was collected by mechanically scanning the US transducer throughout a tissue volume-of-interest (VOI) in 90 μm step increments. CEUS images were collected at each increment and stored as in-phase/quadrature (IQ) data (N = 2000 at 152 frames per sec). SR-US images were created for each cross-sectional plane using established data processing methods, and all were then used to form a final 3D volume for subsequent quantification of morphological features. Vessel diameter quantifications from 3D SR-US data exhibited an average error of 1.9% when compared with microscopy images, whereas measures from B-mode US images had an average error of 75.3%. Overall, 3D SR-US images clearly depicted the microvascular network of the developing chicken embryo and measurements of microvascular morphology achieved better accuracy compared to traditional B-mode US.
Keywords: chicken embryo, microbubble contrast agents, microvascular morphology, super-resolution ultrasound
I. INTRODUCTION
Traditional ultrasound (US) imaging is not overly sensitive to slow blood flow in small vessels, which spurred development of microbubble (MB) contrast agents. These MBs can be administered intravenously and detected with high sensitivity during US imaging. Termed contrast-enhanced US (CEUS), this noninvasive imaging modality now allows an accurate assessment of blood flow and tissue perfusion [1]. With recent FDA approval of MBs for use in the United States, clinical use is increasing, particularly in patient populations where magnetic resonance imaging (MRI) and computed tomography (CT) contrast agents are contraindicated [2].
Although CEUS has several advantages, the spatial resolution of any US imaging system is fundamentally limited by diffraction to length scales of approximately half the wavelength of the transmitted beam. The recently introduced super-resolution US (SR-US) imaging technique is based on MB localization and has been shown to achieve an unprecedently high spatial resolution beyond the diffraction limit [3]. With use of SR-US, it is now possible to provide functional and structural quantifications of microvascular networks [4]–[8]. The addition of structural information to the functional analysis of tissue microvascular networks may help improve disease management, particularly in the oncological setting [9]–[13].
SR-US imaging offers the promise of a more accurate morphological analysis. While several important features of microvascular networks can be quantified using SR-US, methods to help validate these measurements are limited. Herein, we present an approach for three-dimensional (3D) SR-US imaging and morphological analysis of microvascular networks including validation of results using a chicken embryo model. We further validate SR-US image-derived measures using co0registered digital microscopy images.
II. MATERIALS AND METHODS
A. Ultrasound Imaging
Fertilized White Leghorn chicken eggs were obtained from a commercial vendor (Texas A&M University, College Station, TX) and incubated in a forced-draft incubator (GQF Manufacturing Company Inc, Savannah, GA) maintained at 37°C and 60% humidity until Hamburger and Hamilton (HH) stage 18. CEUS imaging of the microvasculature was performed using a preclinical US scanner (Vevo 3100, FUJIFILM VisualSonics Inc, Toronto, Canada) equipped with an MX250 linear array transducer and a MB sensitive imaging mode. This transducer has a center frequency of 21 MHz, bandwidth of 15 – 30 MHz, and an axial resolution of about 75 μm. A pulled glass pipette was loaded with 1 to 5 μL of a custom MB contrast agent [14] mixed with trypan blue at a 1:10 ratio. While visualizing the embryo with a stereomicroscope, MBs were introduced into the embryo’s vascular network by microinjection. Chick embryos were then imaged by US as the transducer was mechanically scanned over a volume-of-interest (VOI) in 90 μm step increments using the Vevo Imaging Station (FUJIFILM VisualSonics Inc). As diagramed in Fig. 1, at each increment, a series of CEUS images were acquired and stored as in-phase/quadrature (IQ) data (N = 2000 at 152 frames per sec). A total of 3 volume datasets consisting of 6 to 16 cross-sectional slices from each of 3 different embryos were saved for offline processing.
Fig. 1.

Diagram of the experimental design and the data processing strategy used for acquiring a sequence of contrast-enhanced ultrasound (CEUS) images and subsequent generation of the super-resolution ultrasound (SR-US) maps of the microvascular structures. Frames of CEUS data (N = 2000) were collected for each tissue cross-section as the transducer was mechanically scanned over a defined volume-of-interest (VOI).
B. Image Processing
All image processing and quantification was performed using custom MATLAB software (MathWorks Inc, Natick, MA). For each CEUS dataset, a singular value filter (SVF) was applied to the IQ frames [15]. This SVF separates stationary speckle signal (tissue) from the nonlinear MB signal of interest. After the removal of tissue signal, MBs were localized by an 8-connected component analysis. The centroid of each connected component was determined and mapped. For each tissue cross-section, a SR-US image is created by enumerating the number of MBs found at each pixel location. After resampling to form isotropic voxels, a 3D SR-US volume was reconstructed after all CEUS cross-sectional datasets were processed.
A multiscale vessel enhancement filter was applied to the 3D volume to further enhance microvascular structures [16]. This method has been widely used in CT and MRI angiography to improve diagnostic quality. The vessels, defined as tubular structures having a Gaussian profile, are detected using the second derivatives of the Gaussian kernels of a specific dispersion (sigma). Sigma, as a scaling parameter, helps to detect a range of large and small vessels with a wider and thinner Gaussian kernel, respectively. Next, we introduce a vesselness function Vo(γ) defined as:
| (1) |
where λ1,2,3 are the eigenvalues from the Hessian matrix and:
| (2) |
Vo(γ) responds with higher values only for tubular structures in 3D space and suppresses the background noise, i.e. non-tubular structures. Enhanced vasculature structures helps segment individual vessels for diameter measurements.
After the extraction of the centerlines, bifurcation points were removed. The remaining individual segments were used to compute the vessel length (VL). After quantification of vessel length (VL), vessel diameter (VD), and vessel tortuosity (VT), results were validated using co-registered digital microscopy images and compared to B-mode US metrics. Distance transforms for the 3D volume helped provide VD measures for the 3D SR-US data while the VD from microscopy and B-mode US images were measured using the reference method full-width-half-maximum (FWHM). Tortuosity measurements were computed by manually drawing the centerlines on B-mode US images and our automated two-dimensional (2D) tortuosity quantification software was used for the microscopy images [17], [18]. Since the tortuosity depends heavily on pixel size and image resolution, a direct comparison between 2D and 3D data is not feasible. Therefore, we created a tortuosity rank index (TRI) and compared values instead of raw tortuosity measures. The number of bifurcations (NB) and vessel segments (NV) were counted for select longer vessels within a VOI. For a fair comparison, VL was computed only for individual vessel segments that had start and end points present within the VOI.
C. Evaluation Metric
As a validation metric, we used the VD that provided a fair comparison of the raw diameter values between microscopy, 3D SR-US, and B-mode US data. We also provide results of the other metrics, namely, VL and TRI, for comparison between microscopy and 3D SR-US data.
III. RESULTS AND DISCUSSION
A validation framework was presented. Our preliminary studies using the developing chicken embryo demonstrate that 3D SR-US imaging of microvascular structures can be performed using a preclinical US system and dedicated post-processing software. Morphological analysis of microvascular networks was validated using co-registered digital microscopy images. Experimental results demonstrate an average percent error of 1.9% for the 3D SR-US image-derived VD measurements and an error of 75.3% from use of the matched B-mode US data. In general, SR-US imaging with multiscale vessel enhancement improved the visualization of microvascular structures and showed promising results with validation from the microscopy images. Representative co-registered B-mode US and SR-US images of a chicken embryo are depicted in Fig. 2. As this example shows, use of SVF helps remove the stationary tissue signal while leaving the MB signal of interest for further processing. Inspection of the B-mode US image reveals that blood vessels were not clearly distinguishable and reverberation artifacts further obscured vessel detection, Fig. 2A. Compared to Fig. 2A, the SR-US image in Fig. 2B clearly depicts the microvasculature that was successfully perfused with MBs. Although microvascular detail is more pronounced in the SR-US image, vessels are not completely connected, owing to the limited number of US frame data (i.e. sparse dataset). The spatial gaps between the detected MBs are partially filled after use of a multiscale vessel enhancement filter. From a specific region-of-interest (ROI, white circle in Fig. 2C), the smallest vessels resolved were approximately 20 to 30 μm in diameter, Fig. 2D. From a second chicken embryo studied, a brightfield microscopy image is shown in Fig. 3A with the enlarged ROI in Fig. 3C (white box). A 2D maximum intensity projection (MIP) of the 3D SR-US volume allows qualitative comparison with microscopy images, Fig. 3B to 3D. Finally, a 3D reconstruction of the SR-US volume data contains a more comprehensive view of the microvascular network in the developing chicken embryo, Fig 3E. A set of representative vessels from the microscopy image and individual vessel segments extracted from the 3D SR-US data are illustrated in Fig. 4. TRI results of these vessels revealed a 60% overlap with the matched microscopy counterparts. We observed an error of 5.5% in preliminary VL measurements. Overall, SR-US-derived image measurements were considerably more accurate than those from the matched B-mode US images.
Fig. 2.

Comparison of co-registered (A) B-mode ultrasound (US) and (B) SR-US images of a developing chicken embryo. Note the (C) size of the first and second vessels within the white circle were (D) estimated to be approximately 20 and 30 μm, respectively, and considerably below the axial resolution of the US system used for data acquisition.
Fig. 3.
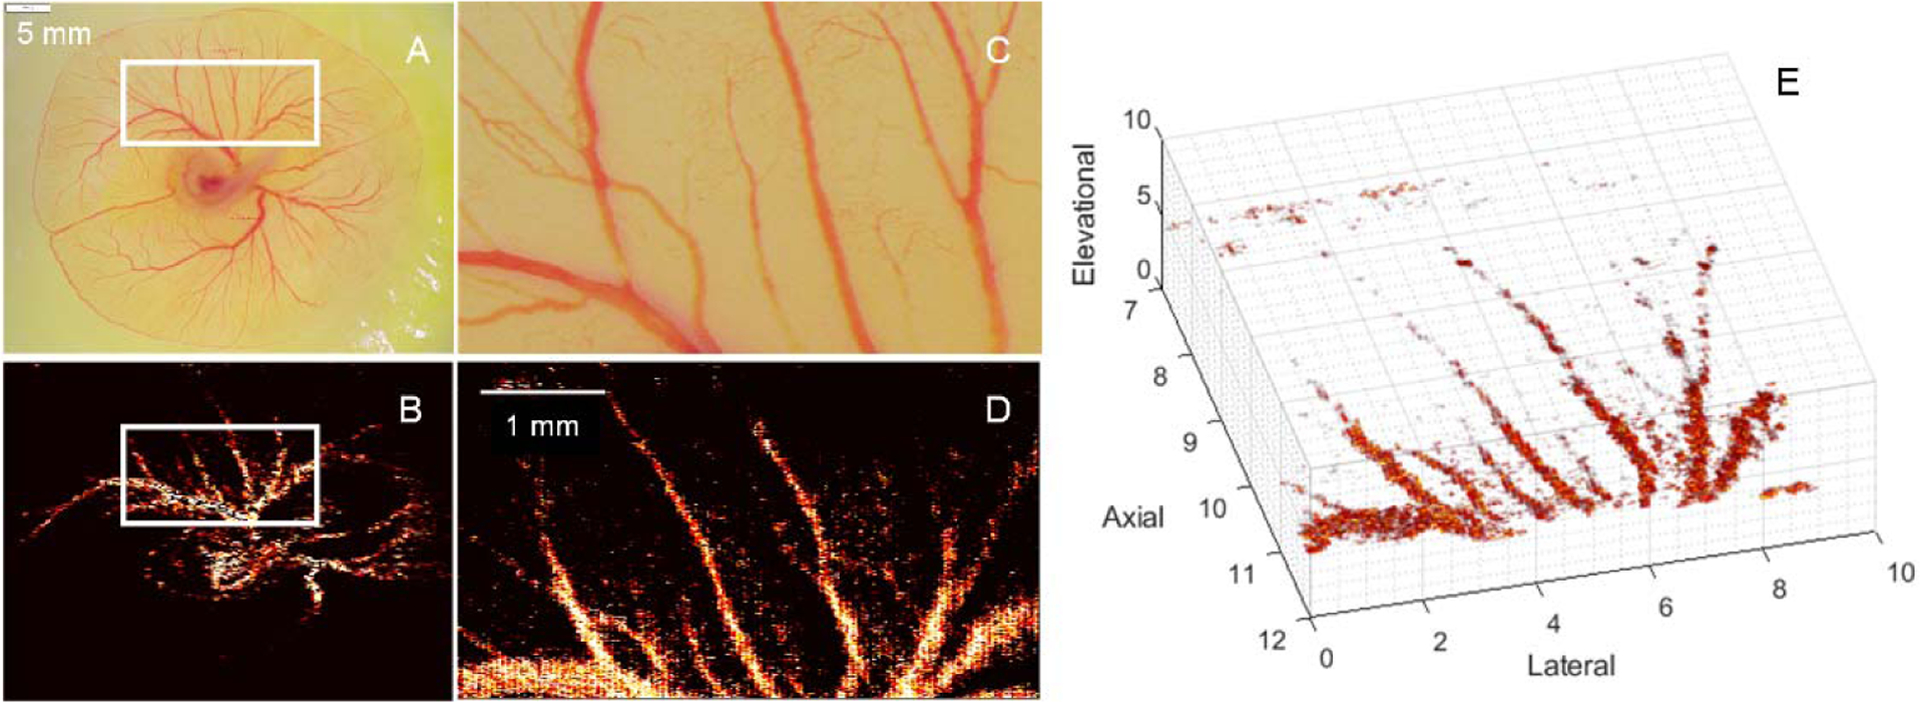
Matched (A) brightfield microscopy image and (B) 2D maximum intensity projection of 3D SR-US image within a defined VOI (white box), which has been enlarged in (C) and (D), respectively. Representation of the (E) SR-US volume reconstruction from US imaging a developing chicken embryo.
Fig. 4.

Individual vessels from a (A) brightfield microscopy image and (B-F) 3D SR-US images that were used to make select microvascular morphology measurements. Colorbar represents vessel diameter estimates (red-blue = high-low).
IV. CONCLUSIONS
It was shown that 3D SR-US imaging can be performed using a preclinical US system and dedicated post-processing software. Preliminary results depicted microvascular networks in developing chicken embryo. The increased spatial resolution and improved quantification of microvascular features from SR-US images was a considerable enhanced compared measures from traditional B-mode US images.
ACKNOWLEDGEMENTS
This research was supported in part by NIH grant R01EB025841 and Texas CPRIT award RP180670. The authors acknowledge the Texas Advanced Computing Center at the University of Texas at Austin for providing HPC resources that have contributed to the research results reported within this paper. URL: http://www.tacc.utexas.edu
REFERENCES
- [1].Saini R and Hoyt K, “Recent developments in dynamic contrast-enhanced ultrasound imaging of tumor angiogenesis,” Imaging Med, vol. 6, no. 1, pp. 41–52, 2014. [DOI] [PMC free article] [PubMed] [Google Scholar]
- [2].Hull TD, Agarwal A, and Hoyt K, “New ultrasound techniques promise further advances in AKI and CKD,” JASN, vol. 28, no. 12, pp. 3452–3460, 2017. [DOI] [PMC free article] [PubMed] [Google Scholar]
- [3].Errico C et al. , “Ultrafast ultrasound localization microscopy for deep super-resolution vascular imaging,” Nature, vol. 527, no. 7579, p. 499, 2015. [DOI] [PubMed] [Google Scholar]
- [4].Ghosh D, Xiong F, Sirsi SR, Shaul PW, Mattrey RF, and Hoyt K, “Toward optimization of in vivo super-resolution ultrasound imaging using size-selected microbubble contrast agents,” Med Phys, vol. 44, no. 12, pp. 6304–6313, 2017. [DOI] [PMC free article] [PubMed] [Google Scholar]
- [5].Ghosh D et al. , “Super-resolution ultrasound imaging of skeletal muscle microvascular dysfunction in an animal model of type 2 diabetes,” J Ultrasound Med, vol. 38, no. 5, pp. 2589–2599, 2019. [DOI] [PMC free article] [PubMed] [Google Scholar]
- [6].Ghosh D et al. , “Monitoring early tumor response to vascular targeted therapy using super-resolution ultrasound imaging,” Proc IEEE Ultrason Symp, pp. 1–4, 2017. [Google Scholar]
- [7].Tanigaki K et al. , “Hyposialylated IgG activates endothelial IgG receptor FcγRIIB to promote obesity-induced insulin resistance,” J Clin Invest, vol. 128, no. 1, pp. 309–322, 2018. [DOI] [PMC free article] [PubMed] [Google Scholar]
- [8].Brown KG, Ghosh D, and Hoyt K, “Deep learning of spatiotemporal filtering for fast super-resolution ultrasound imaging,” IEEE Trans Ultrason Ferroelectr Freq Control, 2020. [DOI] [PMC free article] [PubMed] [Google Scholar]
- [9].Hoyt K, Umphrey H, Lockhart M, Robbin M, and Forero-Torres A, “Ultrasound imaging of breast tumor perfusion and neovascular morphology,” Ultrasound Med Biol, vol. 41, no. 9, pp. 2292–2302, 2015. [DOI] [PMC free article] [PubMed] [Google Scholar]
- [10].Oezdemir I, Wessner CE, Shaw C, Eisenbrey JR, and Hoyt K, “Tumor vascular networks depicted in contrast-enhanced ultrasound images as a predictor for transarterial chemoembolization treatment response,” Ultrasound Med Biol, 2020. [DOI] [PMC free article] [PubMed] [Google Scholar]
- [11].Oezdemir I, Wessner CE, Shaw C, Eisenbrey JR, and Hoyt K, “Multiscale quantification of tumor microarchitecture for predicting therapy response using dynamic contrast-enhanced ultrasound imaging,” Proc IEEE Ultrason Symp, vol. 1, pp. 1173–1176, 2019. [DOI] [PMC free article] [PubMed] [Google Scholar]
- [12].Oezdemir I, Javed K, Rijal G, and Hoyt K, “Contrast-enhanced ultrasound imaging of acute changes in pancreatic cancer following targeted hyaluronan treatment,” Proc IEEE Ultrason Symp, vol. 1, pp. 2303–2306, 2019. [DOI] [PMC free article] [PubMed] [Google Scholar]
- [13].Oezdemir I, Shaw C, Eisenbrey JR, and Hoyt K, “Improved quantitative contrast-enhanced ultrasound imaging of hepatocellular carcinoma response to transarterial chemoembolization,” Proc IEEE Int Symp Biomedical Imaging, vol. 1, pp. 1737–1740, 2019. [DOI] [PMC free article] [PubMed] [Google Scholar]
- [14].Sirsi S and Borden M, “Microbubble compositions, properties and biomedical applications,” Bubble Sci Eng Technol, vol. 1, no. 1–2, pp. 3–17, 2009. [DOI] [PMC free article] [PubMed] [Google Scholar]
- [15].Mauldin FW, Lin D, and Hossack JA, “A singular value filter for rejection of stationary artifact in medical ultrasound,” Proc IEEE Ultrason Symp, pp. 359–362, 2010. [Google Scholar]
- [16].Frangi AF, Niessen WJ, Vincken KL, and Viergever MA, “Multiscale vessel enhancement filtering,” MICCAI, pp. 130–137, 1998. [Google Scholar]
- [17].Oezdemir I et al. , “Multiscale and morphological analysis of microvascular patterns depicted in contrast-enhanced ultrasound images,” J Med Imaging, vol. 7, no. 3, p. 034001, 2020. [DOI] [PMC free article] [PubMed] [Google Scholar]
- [18].Özdemir I and Hoyt K, “Morphological image processing for multiscale analysis of super-resolution ultrasound images of tissue microvascular networks,” SPIE Medical Imaging, vol. 10955, p. 1095505, 2019. [DOI] [PMC free article] [PubMed] [Google Scholar]