

Abstract
Background
Previous studies have identified noninvasive methods for predicting atrial fibrillation (AF) recurrence after catheter ablation (CA). We assessed the association between AF recurrence and atrial late potentials (ALPs), which were measured using P‐wave signal‐averaged electrocardiography (P‐SAECG).
Methods
Consecutive patients with paroxysmal AF who underwent their first CA at our institution between August 2015 and August 2019 were enrolled. P‐SAECG was performed before CA. Two ALP parameters were evaluated: the root‐mean‐square voltage during the terminal 20 ms (RMS20) and the P‐wave duration (PWD). Positive ALPs were defined as an RMS20 <2.2 μV and/or a PWD >115 ms. Patients were allocated to either the recurrence or nonrecurrence group based on the presence of AF recurrence at the 1‐year follow‐up post‐CA.
Results
Of the 190 patients (age: 65 ± 11 years, 37% women) enrolled in this study, 21 (11%) had AF recurrence. The positive ALP rate was significantly higher in the recurrence group than in the nonrecurrence group (86% vs. 64%, p = .04), despite the absence of differences in other baseline characteristics between the two groups. In the multivariate analysis, positive ALP was an independent predictor of AF recurrence (odds ratio: 3.83, 95% confidence interval: 1.05–14.1, p = .04).
Conclusions
Positive ALP on pre‐CA P‐SAECG is associated with AF recurrence after CA.
Keywords: atrial fibrillation, atrial late potentials, catheter ablation, pulmonary vein isolation, recurrence
P‐wave signal‐averaged electrocardiography (P‐SAECG) findings could indicate atrial fibrosis, i.e., an arrhythmogenic substrate in patients with AF. We evaluated the association between AF recurrence after catheter ablation (CA) and atrial late potentials (ALPs), which were measured using P‐SAECG. The positive ALP rate was significantly higher in the Recurrence group than in the non‐Recurrence group (86% vs. 64%, p = .04). In the multivariate analysis, positive ALP was an independent predictor of AF recurrence (odds ratio: 3.83, 95% confidence interval: 1.05–14.1, p = .04).
1. INTRODUCTION
Atrial fibrillation (AF) is the most frequent cardiac arrhythmia 1 and is associated with a high mortality rate, mainly due to complications of heart failure and thromboembolism. Recently, catheter ablation (CA) was found to be effective in treating AF. 2 , 3 However, AF recurs after CA in 10%–30%, 4 , 5 and few reports have focused on using electrocardiography (ECG) to predict AF recurrence after CA.
Signal‐averaged electrocardiography (SAECG) was used to record microvolt potentials from body surfaces. QRS‐SAECG is commonly performed in general practice, and positive QRS‐SAECG findings are associated with lethal ventricular arrhythmias and sudden cardiac death. 6 However, robust evidence for P‐wave SAECG (P‐SAECG) usage is lacking. Previous reports have demonstrated that P‐SAECG findings of atrial late potentials (ALPs) could indicate atrial fibrosis, an arrhythmogenic substrate, in patients with AF. Therefore, P‐SAECG could help identify patients at risk of developing new‐onset AF, 7 , 8 who are likely to undergo conversion from paroxysmal to chronic AF. 9
We hypothesized that pre‐recorded ALPs would differ between patients with and without AF recurrence after CA and that positive ALP would be associated with AF recurrence.
2. METHODS
2.1. Study population
This was a single‐center, nonrandomized, observational study. We retrospectively evaluated consecutive patients with paroxysmal AF who underwent CA between August 2015 and August 2019 at our institution. We excluded patients who (1) did not undergo a P‐SAECG; (2) were receiving a class I, III, or IV antiarrhythmic drug at the time of the P‐SAECG; or (3) were lost to follow‐up (Figure 1). This study was conducted with the Ethics Committee of Kitasato University Hospital (No. B18‐197).
FIGURE 1.
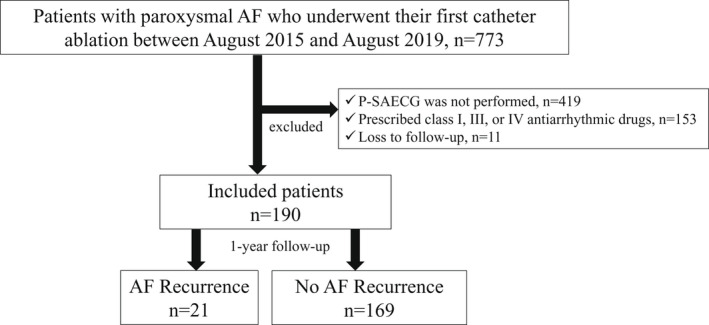
Patient enrollment flow chart. The enrollment procedure has been described in detail in the main text. AF, atrial fibrillation; P‐SAECG, P‐wave signal‐averaged electrocardiography.
2.2. P‐wave signal‐averaged electrocardiography
A P‐SAECG with P‐wave triggering was performed before CA using an FCP‐8800 (Fukuda Denshi, Ltd.) with 12 standard ECG leads. The skin where the electrodes were placed was cleaned with alcohol and scrubbed using a rubbing pad to avoid low‐amplitude signals. Subsequently, the signals from each lead were amplified and filtered between 40 Hz and 300 Hz. A modified X, Y, and Z lead system was used to trigger signal averaging from the P wave. The signal was passed through a P‐wave recognition program to remove atrial extrasystoles, and a signal of 200 beats with an error vector magnitude of <0.4 μV was obtained. The following two ALP parameters were evaluated: the root mean square voltage during the terminal 20 ms (RMS20) and filtered P‐wave duration (PWD). RMS20 and PWD data were automatically calculated using this system. Positive ALPs were defined as an RMS20 <2.2 μV and/or a PWD >115 ms. Standard values were based on an analysis of 120 healthy individuals. 10
2.3. Assessment of baseline characteristics
Baseline characteristics, such as age, gender, AF history duration, body mass index, underlying diseases, and medication history, were evaluated. Additionally, pre‐CA 12‐lead ECG parameters, echocardiographic parameters, and blood test findings were evaluated.
2.4. Ablation procedure
Radiofrequency CA (RFCA) or cryoballoon ablation (CBA) was performed at the operator's discretion. The detailed procedure of CA has been already published in our previous articles. 11 CA was performed under general anesthesia with respiratory support by invasive or noninvasive positive airway pressure management. Esophageal temperature was monitored with an esophageal thermometer during CA. A single transseptal puncture was performed with intracardiac echocardiography. A detailed 3D model of the left atrium (LA) was made by a high‐density mapping catheter and a 3D mapping system before CA.
For RFCA, extensive circumferential ablation of the ipsilateral pulmonary veins (PVs) was performed using irrigated‐tip ablation catheters (TactiCath™, Abbott; THERMOCOOL SMARTTOUCH® SF, Biosense Webster, Inc.; or IntellaNav MiFi OI, Boston Scientific, Inc.). Radiofrequency energy was set at 30–35 W, and ablation was performed using the ablation index, lesion size index, and local impedance drop as indicators of effective lesion formation. Additional procedures, such as posterior wall or superior vena cava isolation, were performed at the clinician's discretion. Additional ablation was performed at the gap sites adjacent to the first‐pass ablation line, after waiting at least 15 min after the pulmonary vein isolation (PVI) to find spontaneous reconnections or dormant conduction (by administering 2–4 μg of isoproterenol followed by rapid injection of 20 mg of adenosine triphosphate).
For CBA, a cryoballoon catheter with a 28‐mm balloon (Arctic Front Advance II®, Medtronic, Inc.) and a PV mapping catheter (Achieve Mapping Catheter®, Medtronic, Inc.) were inserted. Each PV was frozen for 3 min. Additional freezing was performed if PVs were not isolated. Cryoapplication was only used for PVI.
2.5. Follow‐up
After CA, we performed a 12‐lead ECG every 1 or 2 months and 24 h Holter recordings at 6 and 12 months post‐CA. We defined AF recurrence as any atrial tachyarrhythmia lasting ≥30 s detected by ECG after a 3‐month blanking period during the 1‐year observational period. Patients with AF recurrence were categorized into the recurrence group and those without AF recurrence were categorized into the nonrecurrence group.
2.6. Statistical analysis
Continuous variables are reported with mean ± standard deviation or median with interquartile range. Categorical variables are reported with absolute values and percentages. If relevant, continuous variables were compared using a t test or Mann–Whitney U test, while dichotomous variables were compared using a chi‐squared test or Fisher's exact test. A p < .05 was considered statistically significant. We performed univariate and multivariate logistic regression analyses to identify clinical factors related to AF recurrence. Parameters with a p < .20 were included in the multivariate logistic regression analysis to assess the independent predictors of AF recurrence. All data were analyzed using the JMP® 14 software (SAS Institute).
3. RESULTS
3.1. Comparison of baseline characteristics
Complete bidirectional conduction block was successfully formed in all four PVs of all patients. Among the 190 enrolled patients, 21 (11%) experienced AF recurrence during the follow‐up period. The clinical characteristics of the enrolled patients are shown in Table 1. There were no significant differences between the two groups in baseline characteristics, the echocardiographic parameters including LA dimensions, 12‐lead electrocardiographic parameters, underlying diseases, medications, CHADS2 score, and CA procedures performed.
TABLE 1.
Comparison of the baseline characteristics between the patients with and without recurrence
| Total (n = 190) | Recurrence group (n = 21) | Nonrecurrence group (n = 169) | p | |
|---|---|---|---|---|
| Age (years) | 65 ± 11 | 67 ± 12 | 65 ± 11 | .38 |
| Female, n (%) | 71 (37.4) | 11 (52.4) | 60 (35.5) | .13 |
| BMI (kg/m2) | 23.8 ± 3.5 | 24.4 ± 3.7 | 23.8 ± 3.5 | .43 |
| Echocardiographic parameters | ||||
| LAD (mm) | 37.7 ± 5.3 | 38.1 ± 5.1 | 37.6 ± 5.3 | .72 |
| LVEF (%) | 67.8 ± 6.2 | 69.2 ± 4.0 | 67.6 ± 6.5 | .28 |
| Electrocardiographic parameters | ||||
| P‐wave duration in lead II (ms) | 121.8 ± 19.4 | 119.2 ± 19.6 | 122.1 ± 19.3 | .54 |
| P‐wave duration in lead V1 (ms) | 106.2 ± 18.0 | 108.8 ± 13.3 | 105.9 ± 18.5 | .49 |
| QRS complex duration in lead II (ms) | 89.1 ± 16.8 | 85.8 ± 15.3 | 89.4 ± 17.0 | .35 |
| QRS complex duration in lead V1(ms) | 101.0 ± 16.1 | 98.0 ± 19.6 | 101.4 ± 15.7 | .37 |
| QTc interval (ms) | 419.0 ± 22.5 | 417.4 ± 23.5 | 419.4 ± 22.3 | .74 |
| Laboratory parameters | ||||
| BNP level (pg/ml) | 48.9 [22.9–96.7] | 79.2 [30.8–183.7] | 45.2 [22.3–85.4] | .45 |
| CCr (ml/min) | 64.2 [53.1–77.9] | 67.2 [49.3–80.7] | 64.9 [53.3–77.8] | .65 |
| Underlying disease, n (%) | ||||
| Heart failure | 10 (5.3) | 1 (4.8) | 9 (5.3) | .91 |
| Hypertension | 98 (51.9) | 11 (55.0) | 87 (51.5) | .77 |
| Diabetes mellitus | 19 (10.0) | 2 (9.5) | 17 (10.6) | .94 |
| Stroke | 10 (5.3) | 1 (4.8) | 9 (5.4) | .91 |
| CHADS2 score (points) | 1 [0–2] | 1 [0–2] | 1 [0–2] | .51 |
| Procedure, n (%) | ||||
| PVI alone | 159 (83.7) | 15 (71.4) | 144 (85.2) | .11 |
| PVI + other procedures | 31 (16.3) | 6 (28.6) | 25 (14.8) | |
| Medication, n (%) | ||||
| β‐blocker | 65 (34.2) | 10 (47.6) | 55 (32.5) | .17 |
| RASI | 71 (37.6) | 6 (28.6) | 65 (38.7) | .37 |
| MRA | 7 (3.7) | 1 (4.8) | 6 (3.6) | .78 |
| Statin | 49 (25.8) | 5 (23.8) | 44 (26.0) | .83 |
Note: Values are presented as mean ± standard deviation, median with interquartile range, or n (%).
Abbreviations: BMI, body mass index; BNP, B‐type natriuretic peptide; CCr, creatinine clearance; LAD, left atrial diameter; LVEF, left ventricular ejection fraction; MRA, mineralocorticoid receptor antagonist; PVI, pulmonary vein isolation; RASI, renin‐angiotensin system inhibitor.
3.2. P‐SAECG findings and AF recurrence
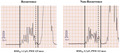
The P‐SAECGs of the representative patients are shown in Figure 2. The left and right panels show the P‐SAECGs of one patient each from the recurrence (RMS20: 1.6 μV, PWD: 128 ms) and nonrecurrence (RMS20: 3.1 μV, PWD: 91 ms) groups, respectively. A representative patient from the recurrence group met both criteria for ALP positivity. Table 2 shows the positive ALP rates for both groups. The rate of ALP positivity was significantly higher in the recurrence group than in the nonrecurrence group (85.7% vs. 63.9%, p = .04).
FIGURE 2.
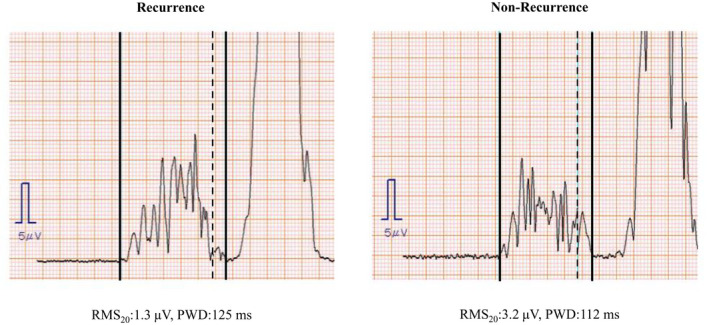
Representative P‐SAECG findings. Solid perpendicular lines indicate the beginning and end of the P wave. The dotted perpendicular line indicates the point 20 ms before the end of the P wave. Positive ALPs were defined as an RMS20 <2.2 μV or a PWD >115 ms. P‐SAECG, P‐wave signal‐averaged electrocardiography; RMS20, root mean square voltage during the terminal 20 ms; PWD, P‐wave duration.
TABLE 2.
P‐SAECG findings of patients with or without recurrence
| Total (n = 190) | Recurrence group (n = 21) | Nonrecurrence group (n = 169) | p | |
|---|---|---|---|---|
| P‐SAECG | ||||
| The presence of ALP, n (%) | 126 (66.3) | 18 (85.7) | 108 (63.9) | .04 |
Abbreviations: ALP, atrial late potentials; P‐SAECG, P‐wave signal‐averaged electrocardiography.
3.3. Predictors of AF recurrence
Gender, PVI alone, and positive ALP were included in the multivariate analysis because they had ps < 0.20 in the univariate analysis. In the multivariate analysis, positive ALP was an independent predictor of AF recurrence (odds ratio: 3.83, 95% confidence interval: 1.05–14.1, p = .04, Table 3).
TABLE 3.
Independent predictors of atrial fibrillation recurrence
| OR (95% CI) | p | |
|---|---|---|
| Female gender | 2.53 (0.69–5.87) | .06 |
| PVI alone | 0.50 (0.17–1.45) | .20 |
| The presence of ALP | 3.83 (1.05–14.1) | .04 |
Abbreviations: ALP, atrial late potentials; CI, confidence interval; OR, odds ratio; PVI, pulmonary vein isolation.
4. DISCUSSION
This study showed that the rate of ALP positivity pre‐CA was significantly higher in the recurrence group than in the nonrecurrence group, despite the absence of significant differences in the baseline characteristics, including LA dimensions. Furthermore, multivariate analysis showed that positive ALP was an independent factor associated with AF recurrence after CA.
4.1. P‐SAECGs and atrial remodeling
PWD is an electrophysiological parameter that reflects complete atrial conduction. Studies 12 , 13 , 14 have reported that P‐SAECG findings are closely related to AF recurrence after CA. Okumura et al. 13 conducted P‐SAECG before and after CA (n = 51) in patients with paroxysmal and persistent AF. Patients with successfully completed CA had significantly shorter PWD (from 146 ± 13 to 136 ± 12 ms; p < .01) than those with AF recurrence (from 167 ± 15 to 157 ± 15 ms; p = .18). Ogawa et al. 12 reported that PWD after CA was significantly reduced (from 161 ± 7 to 151 ± 8 ms; ΔPWD 10 ± 7 ms; p < .0001) in patients with paroxysmal and persistent AF (n = 27); however, they observed no significant shortening of PWD in patients with AF recurrence. Masuda et al. 14 performed P‐SAECG pre‐ and 1 day post‐CA (n = 88) in patients with paroxysmal AF. Although there were no differences in the pre‐CA P‐SAECG findings, AF recurrence was significantly more common in patients with a long PWD and low RMS20 1 day post‐CA than in those without (54% vs. 19%, p = .001). These reports suggest that an improvement in atrial conduction parameters could be associated with reduced AF recurrence rates after CA because ALP is a marker of abnormal atrial electrical characteristics, such as interatrial or intraatrial conduction disturbances.
In our study, we evaluated many patients with paroxysmal AF and focused on predicting AF recurrence based on positive ALPs levels before CA. Consequently, we observed that the rate of ALP positivity before CA (a long PWD and a low RMS20) was significantly higher in the recurrence group than in the nonrecurrence group. These results suggest that a positive ALP finding on P‐SAECG can be used as a parameter to detect electrical remodeling.
4.2. Prediction of AF recurrence after CA using P‐SAECG
Electrical and structural remodeling has been reported to result in arrhythmias. 15 Findings suggestive of dilatation using noninvasive modalities, such as echocardiography or computed tomography, could indicate structural remodeling of the atrium. The preoperative left atrial diameter (LAD) is reportedly associated with AF recurrence after CA. 16 , 17 The most common arrhythmogenic substrate is structural remodeling in the form of LA enlargement. PWD on the surface 12‐lead ECG has also been described to be associated with AF recurrence after CA. 18 , 19 A long PWD is reported to be associated with an enlarged LA 20 and atrial conduction disturbances. 21 We demonstrated that positive ALP was an independent predictor of AF recurrence after CA, and there were no significant differences found for the LAD and PWD on the surface 12‐lead ECG between the recurrence and nonrecurrence groups. This may be because our study population consisted only of patients with paroxysmal AF who had a short disease duration and in whom structural remodeling might not have progressed. However, even though paroxysmal AF patients are assumed not to be so progressed in the electrical remodeling compared to persistent AF, the electrical remodeling would exist at a certain level compared to the patients with normal sinus rhythm. Since the electrical remodeling contributes to atrial arrhythmia recurrence after the PVI, we believe that the ALPs could detect the patients with progression of subtle electrical remodeling, even in the paroxysmal AF group without structural changes.
4.3. Limitations
This study has several limitations that must be acknowledged before interpreting our findings. First, this was a single‐center retrospective study that included a relatively small number of patients, which increased the possibility of selection bias. Second, a P‐SAECG is sometimes challenging to perform due to irregular cardiac rhythms, such as atrial or ventricular premature beats, environmental noise that causes electrocardiogram interference, and an overlap between the terminal portion of the P wave and the initial portion of the QRS. Third, any asymptomatic recurrences during the follow‐up period could not be fully identified; therefore, the recurrence rate might have been underestimated. Fourth, the causes of AF recurrence, such as PV reconnections or other non‐PV foci, could not be identified. Fifth, P‐SAECG could only be performed in patients with sinus rhythm; therefore, it might be challenging to extend these observations to patients with nonparoxysmal AF or frequent premature atrial contractions were present at the test. Therefore, this study might include paroxysmal AF patients with a relatively shorter period of history, that is, a benign group of patients. This might also be why the recurrence rate in this study was better than usual. However, we believe that P‐SAECG may have been helpful for the recurrence of AF after CA in this benign patient group. Finally, the relationship between ALPs and mapping data during ablation was not investigated because we used three different 3D mapping systems, and the voltage or activation maps before the ablation were not thoroughly evaluated in all patients. Additional prospective research will probably be necessary to confirm the relationship between ALPs and mapping data.
5. CONCLUSION
Positive ALPs on the pre‐CA P‐SAECG were associated with AF recurrence after CA.
FUNDING INFORMATION
This work was supported by JSPS KAKENHI grant number JP18K08113.
CONFLICT OF INTEREST
The authors declare no conflict of interests for this article.
DECLARATIONS
Approval of the research protocol: This study was approved by the institutional review board committee of the Kitasato University (No. B18‐197). Informed Consent: All patients included in this study provided consent to participate. Registry and the registration no.: N/A. Animal Studies: N/A.
ACKNOWLEDGMENTS
Mr. John Martin helped our manuscript as a native English speaker.
Saito D, Fukaya H, Oikawa J, Sato T, Matsuura G, Arakawa Y, et al. Atrial late potentials are associated with atrial fibrillation recurrence after catheter ablation. J Arrhythmia. 2022;38:991–996. 10.1002/joa3.12786
REFERENCES
- 1. Nattel S, Opie LH. Controversies in atrial fibrillation. Lancet. 2006;367:262–72. [DOI] [PubMed] [Google Scholar]
- 2. Haïssaguerre M, Shah DC, Jaïs P, Hocini M, Yamane T, Deisenhofer I, et al. Electrophysiological breakthroughs from the left atrium to the pulmonary veins. Circulation. 2000;102:2463–5. [DOI] [PubMed] [Google Scholar]
- 3. Oral H, Knight BP, Tada H, Ozaydin M, Chugh A, Hassan S, et al. Pulmonary vein isolation for paroxysmal and persistent atrial fibrillation. Circulation. 2002;105:1077–81. [DOI] [PubMed] [Google Scholar]
- 4. Kis Z, Muka T, Franco OH, Bramer WM, De Vries LJ, Kardos A, et al. The short and long‐term efficacy of pulmonary vein isolation as a sole treatment strategy for paroxysmal atrial fibrillation: a systematic review and meta‐analysis. Curr Cardiol Rev. 2017;13:199–208. [DOI] [PMC free article] [PubMed] [Google Scholar]
- 5. Sivasambu B, Balouch MA, Zghaib T, Bajwa RJ, Chrispin J, Berger RD, et al. Increased rates of atrial fibrillation recurrence following pulmonary vein isolation in overweight and obese patients. J Cardiovasc Electrophysiol. 2018;29:239–45. [DOI] [PubMed] [Google Scholar]
- 6. Steinberg JS, Berbari EJ. The signal‐averaged electrocardiogram: update on clinical applications. J Cardiovasc Electrophysiol. 1996;7:972–88. [DOI] [PubMed] [Google Scholar]
- 7. Fukunami M, Yamada T, Ohmori M, Kumagai K, Umemoto K, Sakai A, et al. Detection of patients at risk for paroxysmal atrial fibrillation during sinus rhythm by P wave‐triggered signal‐averaged electrocardiogram. Circulation. 1991;83:162–9. [DOI] [PubMed] [Google Scholar]
- 8. Yamada T, Fukunami M, Ohmori M, Kumagai K, Sakai A, Kondoh N, et al. Characteristics of frequency content of atrial signal‐averaged electrocardiograms during sinus rhythm in patients with paroxysmal atrial fibrillation. J Am Coll Cardiol. 1992;19:559–63. [DOI] [PubMed] [Google Scholar]
- 9. Abe Y, Fukunami M, Yamada T, Ohmori M, Shimonagata T, Kumagai K, et al. Prediction of transition to chronic atrial fibrillation in patients with paroxysmal atrial fibrillation by signal‐averaged electrocardiography: a prospective study. Circulation. 1997;96:2612–6. [DOI] [PubMed] [Google Scholar]
- 10. Furuhata A, Ozawa Y. [Normal values according to Fukuda Denshi equipment] Fukuda Denshi sha kiki niyoru seijouchi (in Japanese).
- 11. Oikawa J, Fukaya H, Wada T, Horiguchi A, Kishihara J, Satoh A, et al. Additional posterior wall isolation is associated with gastric hypomotility in catheter ablation of atrial fibrillation. Int J Cardiol. 2021;326:103–8. [DOI] [PubMed] [Google Scholar]
- 12. Ogawa M, Kumagai K, Vakulenko M, Yasuda T, Siegerman C, Garfinkel A, et al. Reduction of P‐wave duration and successful pulmonary vein isolation in patients with atrial fibrillation. J Cardiovasc Electrophysiol. 2007;18:931–8. [DOI] [PubMed] [Google Scholar]
- 13. Okumura Y, Watanabe I, Ohkubo K, Ashino S, Kofune M, Hashimoto K, et al. Prediction of the efficacy of pulmonary vein isolation for the treatment of atrial fibrillation by the signal‐averaged P‐wave duration. Pacing Clin Electrophysiol. 2007;30:304–13. [DOI] [PubMed] [Google Scholar]
- 14. Masuda M, Inoue K, Iwakura K, Okamura A, Toyoshima Y, Doi A, et al. Impact of pulmonary vein isolation on atrial late potentials: association with the recurrence of atrial fibrillation. Europace. 2015;15:501–7. [DOI] [PubMed] [Google Scholar]
- 15. Wang YS, Chen GY, Li XH, Zhou X, Li YG. Prolonged P‐wave duration is associated with atrial fibrillation recurrence after radiofrequency catheter ablation: a systematic review and meta‐analysis. Int J Cardiol. 2017;227:355–9. [DOI] [PubMed] [Google Scholar]
- 16. Berruezo A, Tamborero D, Mont L, Benito B, Tolosana JM, Sitges M, et al. Pre‐procedural predictors of atrial fibrillation recurrence after circumferential pulmonary vein ablation. Eur Heart J. 2007;28:836–41. [DOI] [PubMed] [Google Scholar]
- 17. Lo LW, Tai CT, Lin YJ, Chang SL, Udyavar AR, Hu YF, et al. Predicting factors for atrial fibrillation acute termination during catheter ablation procedures: implication for catheter ablation strategy and long‐term outcome. Heart Rhythm. 2009;6:311–8. [DOI] [PubMed] [Google Scholar]
- 18. Caldwell J, Koppikar S, Barake W, Redfearn D, Michael K, Simpson C, et al. Prolonged P‐wave duration is associated with atrial fibrillation recurrence after successful pulmonary vein isolation for paroxysmal atrial fibrillation. J Interv Card Electrophysiol. 2014;39:131–8. [DOI] [PubMed] [Google Scholar]
- 19. Li R, Yang X, Jia M, Wang D, Cui X, Bai L, et al. Effectiveness of P‐wave ECG index and left atrial appendage volume in predicting atrial fibrillation recurrence after first radiofrequency catheter ablation. BMC Cardiovasc Disord. 2021;21:164. [DOI] [PMC free article] [PubMed] [Google Scholar]
- 20. Unkell M, Marinov M, Wolff PS, Radziejewska J, Mercik JS, Gajek J. P wave duration in paroxysmal and persistent atrial fibrillation. Adv Clin Exp Med. 2020;29:1347–54. [DOI] [PubMed] [Google Scholar]
- 21. Yoshizawa T, Niwano S, Niwano H, Igarashi T, Fujiishi T, Ishizue N, et al. Prediction of new onset atrial fibrillation through P wave analysis in 12 lead ECG. Int Heart J. 2014;55:422–7. [DOI] [PubMed] [Google Scholar]