

Abstract
Background
Atractylenolide I (AI) is a natural sesquiterpene lactone isolated from Atractylodes macrocephala Koidz, known as Baizhu in traditional Chinese medicine. AI has been found to ameliorate cancer cachexia in clinic cancer patients and in tumour‐bearing mice. Here, we checked the influence of AI on biogenesis of IL‐6 and extracellular vesicles (EVs) in cancer cachexia mice and then focused on studying mechanisms of AI in inhibiting the production of tumour‐derived EVs, which contribute to the ameliorating effects of AI on cancer cachexia.
Methods
C26 tumour‐bearing BALB/c mice were applied as animal model to examine the effects of AI (25 mg/kg) in attenuating cachexia symptoms, serum IL‐6 and EVs levels. IL‐6 and EVs secretion of C26 tumour cells treated with AI (0.31–5 μM) was further observed in vitro. The in vitro cultured C2C12 myotubes and 3T3‐L1 mature adipocytes were used to check the potency of conditioned medium of C26 cells treated with AI (0.625–5 μM) in inducing muscle atrophy and lipolysis. The glycolysis potency of C26 cells under AI (0.31–5 μM) treatment was evaluated by measuring the extracellular acidification rate using Seahorse XFe96 Analyser. Levels of related signal proteins in both in vitro and in vivo experiments were examined using western blotting to study the possible mechanisms. STAT3 overexpression or knockout C26 cells were also used to confirm the effects of AI (5 μM).
Results
AI ameliorated cancer cachexia symptoms (P < 0.05), improved grip strength (P < 0.05) and decreased serum EVs (P < 0.05) and IL‐6 (P < 0.05) levels of C26 tumour‐bearing mice. AI directly inhibited EVs biogenesis (P < 0.001) and IL‐6 secretion (P < 0.01) of cultured C26 cells. The potency of C26 medium in inducing C2C12 myotube atrophy (+59.54%, P < 0.001) and 3T3‐L1 adipocyte lipolysis (+20.73%, P < 0.05) was significantly attenuated when C26 cells were treated with AI. AI treatment inhibited aerobic glycolysis and the pathway of STAT3/PKM2/SNAP23 in C26 cells. Furthermore, overexpression of STAT3 partly antagonized the effects of AI in suppressing STAT3/PKM2/SNAP23 pathway, EVs secretion, glycolysis and the potency of C26 medium in inducing muscle atrophy and lipolysis, whereas knockout of STAT3 enhanced the inhibitory effect of AI on these values. The inhibition of AI on STAT3/PKM2/SNAP23 pathway was also observed in C26 tumour tissues.
Conclusions
AI ameliorates cancer cachexia by decreasing the production of IL‐6 and EVs of tumour cells. The decreasing effects of AI on EVs biogenesis are based on its inhibition on STAT3/PKM2/SNAP23 pathway.
Keywords: atractylenolide I, cancer cachexia, extracellular vesicle, lipolysis, muscle atrophy, STAT3
Introduction
Cancer‐induced cachexia is a highly complex metabolic syndrome characterized by weight loss, fat and muscle tissue wasting. 1 The only clinically approved drug for cancer cachexia, Anamorelin, is a ghrelin receptor agonist. The use of Anamorelin for cancer cachexia was approved in Japan but was not approved in Europe because of the marginal effect on lean body mass and no proven effect on hand grip strength or patients' quality of life. 2 No drug has been approved by FDA for specific treatment of cancer cachexia up to now. 3
In China and Asian countries, herbal medicines such as Sijunzi‐tang in China, 4 , 5 Yukgunja‐tang in Korea 6 and Sipjeondaebo‐tang in Japan 7 are popularly used in clinic for amelioration of cachexia symptoms in cancer patients. Interestingly, Atractylodes macrocephala Koidz, an herb known as Baizhu in traditional Chinese medicine, is included in Sijunzi‐tang, Yukgunja‐tang and Sipjeondaebo‐tang, which suggested the potential of Baizhu in the treatment of cancer cachexia. AI is the main active component of Baizhu. 4 , 5 In gastric cancer patients, AI treatment was found to be beneficial in alleviating cachexia symptoms, modulating cytokine and reducing the proteolysis‐inducing factor positive rate. 8 In our previous study, AI could ameliorate cachexia symptoms of cancer cachexia model mice with spleen deficiency syndrome. 9 However, the mechanisms of AI in ameliorating cancer cachexia have not been fully clarified.
It has been widely recognized that cytokines, such as IL‐6, TNF‐α and others, play a central role in the development of cancer cachexia. 1 , 10 In recent years, cancer‐derived extracellular vesicles (EVs) have also been found to contribute to the development of cancer cachexia. 11 Tumour‐derived EVs can effectively target cells and transfer their contents, thereby regulating induction of cancer cachexia and tumour progression. 11 , 12 , 13 The activation of STAT3 leads to elevated aerobic glycolysis 14 and IL‐6 secretion 15 in cancer cells. AI is a natural STAT3 inhibitor; in colorectal cancer cells, the inhibition of p‐STAT3 by AI leads to the suppression of glycolysis. 4 , 16 , 17 It has been demonstrated that the biogenesis process of EVs was closely related to glycolysis. 18 , 19 Therefore, we concentrated on checking the influence of AI on the production of IL‐6 and C26 EVs, which were closely related to cancer cachexia in the present study.
The current study was designed to test whether the efficacy of AI in ameliorating cancer cachexia was based on targeting cancer cell release of cachexic factors including cytokines and EVs. The cancer cachexia mice model used in the present study is the C26 tumour‐bearing mice model, in which IL‐6 plays an important role in development of cancer cachexia. 20 , 21 We firstly investigated the effects of AI on IL‐6 and EV levels in C26 tumour‐bearing mice and then tried to clarify the mechanisms of AI in decreasing EV biogenesis of tumour cells in vitro and in vivo. Our study provides scientific evidence for inhibiting production of cachexic factors of tumour cells in the treatment of cancer cachexia as well as developing AI as a potential agent for cancer cachexia therapy.
Materials and methods
Reagents
The information of reagents (C188–9, atractylenolide I [AI], GW4869 and pyrrolidine dithiocarbamate [PDTC]) is provided in Table S1 . C188–9 is a small‐molecule inhibitor of STAT3 that targets the phosphotyrosyl peptide binding site within the Src homology 2 (SH2) domain. 22 GW4869 is a frequently used inhibitor that targets nSMase2 to prevent the ceramide‐modulated inward budding of MVBs (multivesicular bodies) and the subsequent release of EVs from MVBs. 23 , 24 PDTC could attenuate the atrophy of C2C12 myotubes and the lipolysis of 3T3‐L1 mature adipocytes induced by C26 medium 25 and was used as a positive control in checking efficacy in ameliorating myotube atrophy and lipolysis.
Cell lines
The information of cell lines (C26 mouse colon cancer cells, C2C12 murine myoblast cells and 3T3‐L1 pre‐adipocytes cells) is provided in Table S2 . STAT3 overexpression (OE) and empty vector‐transfected C26 cells were respectively named as C26‐STAT3‐OE and C26‐OE‐mock. STAT3 knockout (KO) and empty vector‐transfected C26 cells were respectively named as C26‐STAT3‐KO and C26‐KO‐mock. Stably transfected cell lines were constructed as reported previously. 26 C2C12 myotubes and 3T3‐L1 mature adipocytes were differentiated from C2C12 myoblasts and 3T3‐L1 pre‐adipocytes cells as described in Table S2 and our previous reports. 23 , 27 , 28
Animals
Male BALB/c mice (6–8 weeks old, SLAC Laboratory Animal, Shanghai, P.R. China). The care and experimental protocols for this study complied with the Chinese regulations and the Guidelines for the Care and Use of Laboratory Animals drawn up by the National Institutes of Health (USA) and were approved by the Institutional Animal Care and Use Committee of the East China Normal University (m20201206). The mice were housed at a standard temperature (21–23°C) and in a light‐controlled environment.
Cancer cachexia model in vivo
Mice were randomly divided into three groups: healthy group without tumour (healthy group, eight mice; this study and our previous study shared the same healthy group of mice 26 ), C26 tumour‐bearing mice group (C26 group, seven mice) and AI‐treated C26 tumour‐bearing mice group (C26 + AI group, seven mice). Mice were implanted subcutaneously with C26 cells (1.0 × 10⁶ cells per mouse). C26 tumour‐bearing mice were administrated with AI (25 mg/kg) by intraperitoneal injection every day for 18 days; healthy BALB/c mice and C26 model group mice received equal volume solvent. The dose and mode of administration were based on that used in our previous study. 9 AI was preliminarily dissolved in dimethyl sulfoxide (DMSO) and Tween 20: The final solution represented 1% DMSO and 5% Tween 20 in phosphate‐buffered saline (PBS). Food intake, body weight and tumour growth were measured daily. At the end of the experiment, grip strength was measured; mice serum, dissected tumour tissues, eWAT (epididymal adipose tissue), GA (gastrocnemius muscle) tissues and TAL (tibialis anterior muscle) were collected.
Cancer cachexia models in vitro
Equal number of C26 cells and stably transfected C26 cells were plated in six‐well plates (1.2 × 10⁵ cells per well). The next day media were changed into fresh high‐glucose Dulbecco's modified Eagle's medium (DMEM); these cells were simultaneously treated with AI (0.625–5 μM) or GW4869 (1 μM) for 48 h. Then, culture media were collected, processed and used at a 1:1 dilution with fresh normal medium to induce atrophy of C2C12 myotubes and lipolysis of 3T3‐L1 adipocytes. Haematoxylin–eosin (H&E) staining, Oil Red O staining and measurement of glycerol and triglyceride (TG) were used to evaluate the atrophy of C2C12 myotubes and the lipolysis of 3T3‐L1 adipocytes as reported previously. 27
Enzyme‐linked immunosorbent assay (ELISA)
The supernatants of cell culture medium or serum of mice were collected for the detection of IL‐6 levels using the IL‐6 ELISA Kit.
Extracellular vesicle isolation and quantitation
C26 cells and stably transfected C26 cells were seeded in 10 cm dish (1.0 × 10⁶ cells per dish), allowed to attach overnight. After the removal of the supernatant by aspiration, cells were gently washed twice in PBS and then replaced with fresh RPMI‐1640 medium (10 mL) containing EV‐free foetal bovine serum (FBS) for 48 h. Then the culture media were collected and centrifuged at 1500 × g for 5 min to remove dead cells and cell debris. Both centrifugation and EV isolation kit methods were used to isolate EVs from cell culture medium or serum of mice for further analysis as reported previously. 23 The samples obtained by EV isolation kit methods were EV‐enriched preparations.
Isolated EVs were quantified by measuring the activity of acetylcholinesterase (AChE), NTA (Nanoparticle Tracking Analysis) and measuring the total protein amount, EV‐enriched preparations in PBS (110 μL) were used for NTA and EV‐enriched preparations in RIPA lysis buffer (40 μL) were used for protein quantitation. The ratios of particles per μg protein were calculated to show the purity of EV isolation and the reliability of the quantity measurement, and all of the ratios were higher than 3 × 10¹⁰ particles per μg proteins, which reached the requirement of high purity EV‐enriched preparation. 29 The diameter of EVs was determined by NTA; NTA was performed using NanoSight NS300 (Malvern Panalytical, Malvern, UK). 30 Processed EV samples were visualized by transmission electron microscopy (JEM‐1010, Jeol, Tokyo, Japan).
Seahorse XFe96 glycolysis stress assay
To evaluate glycolysis function of cells, the Seahorse XFe96 Analyser (Agilent, California, USA) was used to monitor extracellular acidification rate (ECAR) as reported previously. 26
Cell number counting and cell viability
C26 tumour cells were seeded in 96‐well micro‐assay plate (8000 cells per well), allowed to attach overnight, and then treated with AI (1–10 μM) for 48 h. Then the cell number of C26 cells was counted by the BioTek Cytation 5 (Vermont, USA). C2C12 myotubes and 3T3‐L1 mature adipocytes were treated with AI (3.12–100 μM) for 48 h. Then, the cell viability of C2C12 myotubes and 3T3‐L1 adipocytes were checked by 3‐(4,5‐dimethylthiazol‐2‐yl)‐2,5‐diphenyltetrazolium bromide (MTT) assay.
Western blot assays
Western blot assays were used to analyse the levels of protein. The primary antibodies are listed in Table S3 . To detect the p‐SNAP23 level, Phos‐tag sodium dodecyl sulfate‐polyacrylamide gel electrophoresis (SDS‐PAGE) was performed using Phosbind Acrylamide.
Statistical analysis
Data are expressed as mean ± SEM. Two‐tailed Student's t‐test was used for comparisons between two groups. One‐way ANOVA test was performed to compare multiple groups followed by Bonferroni's post hoc test. All analyses were performed using GraphPad Prism 8.0.1. Values of P < 0.05 were considered to be statistically significant and were presented as *P < 0.05, **P < 0.01, ***P < 0.001 or # P < 0.05, ## P < 0.01, ### P < 0.001.
Results
Atractylenolide I ameliorated cancer cachexia symptoms of C26 tumour‐bearing mice
Effects of AI on physiological parameters of C26 tumour‐bearing mice were evaluated. Body weight of healthy group mice continued to increase in the period of experiment. Body weight of C26 group mice decreased quickly while treatment of AI in C26 cells effectively attenuated the decrease in body weight (Figure 1 A ). Changes in body weight showed similar tendency (Figure S1 A). Compared with C26 group, AI treatment significantly increased the food intake of mice bearing C26 tumour (Figure S1 B). No significant difference was observed in tumour volume and tumour weight between C26 group and C26 + AI group (Figure S1 C,D).
Figure 1.
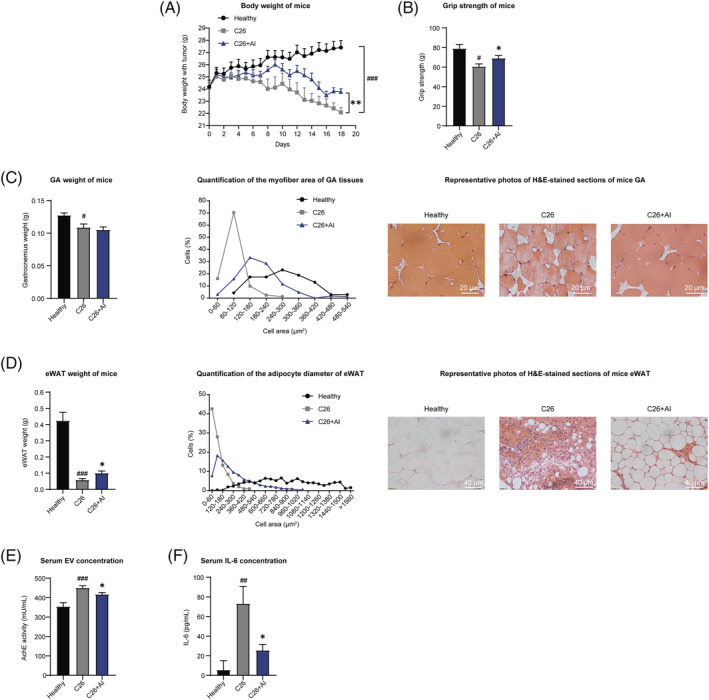
Atractylenolide I (AI) attenuated cachexia symptoms of C26 tumour‐bearing mice. C26 tumour‐bearing mice were administrated with AI (25 mg/kg) by intraperitoneal injection every day for 18 days, and healthy BALB/c mice and C26 model group mice received equal volume solvent. Body weight, food intake and tumour volume were recorded every day. The GA (gastrocnemius muscle), TAL (tibialis anterior muscle) muscle and eWAT (epididymal adipose tissue) tissues were dissected, weighed and then fixed in 4% paraformaldehyde (PFA) at the end of the experiment. (A) Body weight of mice. (B) Grip strength of mice. (C) GA weight of mice. Results of quantification of the myofibre area of GA tissues and representative photos of haematoxylin–eosin (H&E)‐stained sections of mice GA. Scale bar, 20 μm. (D) eWAT weight of mice. Results of quantification of the adipocyte diameter of eWAT and representative photos of H&E‐stained sections of mice eWAT. Scale bar, 40 μm. (E) Results of acetylcholinesterase (AChE) activity assay showed the amounts of extracellular vesicles (EVs) in equal volume of serum of each group of mice. (F) Serum concentrations of IL‐6 in each group of mice. Values were expressed as mean ± SEM (Healthy group: n = 8, C26 model group: n = 7, C26 + AI group: n = 7). # versus healthy group mice; * versus C26 model group mice. # P < 0.05, ## P < 0.01, ### P < 0.001; *P < 0.05, **P < 0.01. Statistical tests one‐way ANOVA/Bonferroni's post hoc test was performed.
Grip strength of C26 tumour‐bearing mice was significantly lower than healthy group, whereas grip strength of C26 + AI group was significantly higher than C26 group (Figure 1 B ). C26 tumour load led to a significant decrease of GA and TAL mass, which indicated muscle atrophy in mice inoculated with C26 cells. Although AI treatment could not significantly attenuate the decrease in GA and TAL weight of C26 tumour‐bearing mice (Figures 1 C and S1 G), results of H&E staining of GA and TAL tissues (both results of quantified percentage distribution of myofibres in muscles cross‐sectional area and representative images in Figures 1 C and S1 G) showed that AI treatment significantly attenuated the decrease in GA and TAL myofibres cross‐sectional area in C26 tumour‐bearing mice.
Significant decrease in eWAT weight (Figure 1 D ) and decrease in adipocytes cross‐sectional area of eWAT tissues (both results of quantified percentage distribution of eWAT adipocytes cross‐sectional area and representative images in Figure 1 D ) were observed in C26 group compared with healthy group. AI treatment significantly attenuated the decrease in eWAT weight; thus, difference between C26 group and C26 + AI group was significant. AI treatment significantly attenuated the decrease in adipocyte cross‐sectional area of eWAT tissues induced by C26 tumour burden. Furthermore, levels of glycerol and TG in equal volume of mice serum were also determined. AI treatment significantly attenuated the increase of glycerol and the decrease of TG in serum of C26 tumour‐bearing mice (Figure S1 E,F).
The serum EV amounts of C26 tumour‐bearing mice were significantly higher than healthy group. In C26 + AI group mice, amounts of EVs isolated from same volume of mouse serum were significantly lower than C26 group mice (Figure 1 E ). Changes in serum IL‐6 level were similar to the changes in serum EV amounts (Figure 1 F ). These results suggested that AI treatment might attenuate muscle wasting and fat degradation by regulating EV and IL‐6 biogenesis in C26 tumour‐bearing mice.
Atractylenolide I attenuated the potency of C26 medium in inducing C2C12 myotube atrophy and 3T3‐L1 adipocytes lipolysis in vitro
C26 cells were cultured in medium containing gradient concentrations of AI for 48 h, then the cultured medium was collected to induce atrophy of C2C12 myotubes or lipolysis of 3T3‐L1 adipocytes. Myotube diameter of C26 + AI‐medium group was significantly higher than C26‐medium group (Figure 2 A ). Decrease in the expression of MyoD (a myogenic transcriptional factor) and MHC (myosin heavy chain) and increase in the expression of Atrogin‐1 and MuRF‐1 (Atrogin‐1 and MuRF‐1 are muscle‐specific E3 ubiquitin ligases participated in protein degradation) in C26‐medium‐treated C2C12 myotubes could be significantly attenuated by AI treatment of C26 cells (Figure 2 B ). Accumulation of lipid droplets in 3T3‐L1 adipocytes treated with C26 + AI‐medium was significantly higher than C26‐medium group (Figure 2 C ). C26 medium strongly enhanced the expression of UCP1 (which blocked adipose tissue ineffective thermogenesis) and decreased the expression of Perilipin‐1 (which is a critical regulator of lipid stores in adipocytes) in 3T3‐L1 adipocytes within 48 h. These responses were significantly attenuated in C26 + AI‐medium group in which C26 cells were treated with AI (Figure 2 D ). Adipocytes treated with C26 medium released higher levels of glycerol than control cells, whereas AI treatment significantly decreased the release of glycerol from adipocytes induced by C26 medium (Figure 2 E ). TG content in 3T3‐L1 adipocytes treated with C26 + AI medium was significantly higher than 3T3‐L1 adipocytes treated with C26 medium (Figure 2 F ). GW4869, which is a widely used inhibitor of EV secretion, was used as a positive control. 23 AI and GW4869 attenuated the potency of C26 medium in inducing atrophy of C2C12 myotubes and lipolysis of 3T3‐L1 mature adipocytes.
Figure 2.
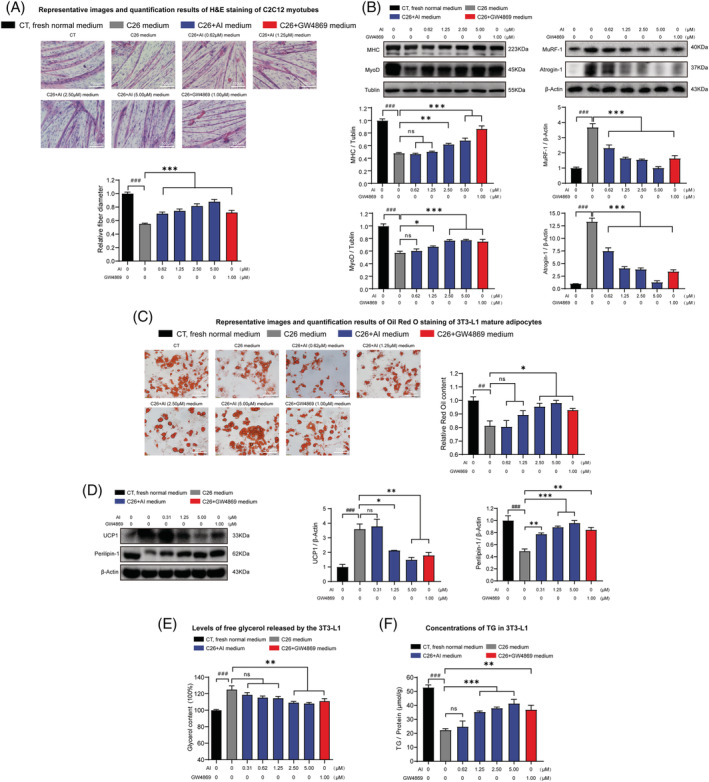
Effects of the media derived from atractylenolide I (AI)‐treated C26 cells in inducing atrophy of C2C12 myotubes and lipolysis of 3T3‐L1 adipocytes. C2C12 myoblasts and 3T3‐L1 pre‐adipocytes cells were differentiated into myotubes and 3T3‐L1 mature adipocyte. The C2C12 myotubes and 3T3‐L1 mature adipocytes were cultured with media derived from non‐tumour cells (CT, black, 1:1 dilution with fresh normal medium), C26 cells (C26 medium, grey, 1:1 dilution with fresh normal medium), AI‐treated C26 cells (C26 + AI medium, blue, 1:1 dilution with fresh normal medium) and GW4869‐treated C26 cells (C26 + GW4869 medium, red, 1:1 dilution with fresh normal medium) for 48 h for the following experiments. (A) Representative images and quantification results of haematoxylin–eosin (H&E) staining of C2C12 myotubes. Scale bar, 100 μm. (B) Western blotting analysis of MHC (myosin heavy chain), MyoD, Atrogin‐1 and MuRF‐1 expression levels in different groups. (C) Representative images and quantification results of Oil Red O staining of 3T3‐L1 mature adipocytes. Scale bar, 100 μm. (D) Western blotting analysis of UCP1 and Perilipin‐1 protein expression levels in the 3T3‐L1 mature adipocytes of different groups. (E) Levels of free glycerol released by the 3T3‐L1 mature adipocytes. (F) Concentrations of triglyceride (TG) in the 3T3‐L1 mature adipocytes. Data presented were the mean ± SEM of three independent experiments. # versus CT group, * versus C26 medium group. ## P < 0.01, ### P < 0.001; ns P > 0.05, *P < 0.05, **P < 0.01, ***P < 0.001. Statistical tests one‐way ANOVA/Bonferroni's post hoc test was performed.
To check whether decrease in cachexia‐inducing potency of C26 + AI‐medium was resulted from remaining AI in medium, direct effects of AI on C2C12 myotubes or 3T3‐L1 adipocytes treated with C26 medium were observed. The influence of AI on cell viability of differentiated C2C12 myotubes and differentiated 3T3‐L1 adipocytes upon 48 h treatment was detected (Figure S2B ,C). AI at doses < 100 μM exhibited no influence on viability of C2C12 myotubes and 3T3‐L1 adipocytes. As shown in Figure S2D , compared with C26 cells, the p‐STAT3 and STAT3 expression levels were significantly lower in C2C12 myotubes. The results suggested that the reactivity of C2C12 myotubes to STAT3 inhibitors such as AI might be less sensitive than C26 cells. When C2C12 myotubes were treated with C26 medium, the p‐STAT3 level increased and showed the activation of STAT3 pathway, which is in accordance to our previous report. 28 However, direct treatment of C2C12 myotubes with AI (6.25–100 μM) could not protect C2C12 myotubes from atrophy induced by C26 medium (Figure S2E ). Similarly, direct treatment of 3T3‐L1 adipocytes with AI (6.25–100 μM) could not protect 3T3‐L1 adipocytes from lipolysis induced by C26 medium (Figure S2F ). PDTC, which could directly attenuate atrophy of C2C12 myotubes and lipolysis of 3T3‐L1 mature adipocytes induced by C26 medium, 25 was used as positive control. These results suggested that AI (6.25–100 μM) could not directly attenuate atrophy of C2C12 myotubes and lipolysis of 3T3‐L1 mature adipocytes induced by C26 medium. Therefore, the remaining AI in C26 + AI‐medium (AI at concentrations of 0.62–5 μM) could not contribute to the decrease in the cachexia‐inducing potency of the C26 + AI medium (conditioned medium of C26 tumour cells treated with AI). The decrease in the cachexia‐inducing potency of C26 + AI medium might be resulted by effects of AI in inhibiting EV and IL‐6 secretion of C26 cells.
Atractylenolide I decreased the secretion of extracellular vesicles and IL‐6 from cultured C26 tumour cells
Analysis of C26‐derived EVs by electron microscopy revealed expected cup‐shaped morphology (Figure S3A ). Effects of AI on cell viability of C26 cells using cell count assay (Figure S2A ) showed that AI at doses < 10 μM exhibited no influence on cell viability and number of C26 cells upon 48 h treatment. AI at non‐toxic doses (0.3–5.0 μM) exhibited no influence on the diameter of the C26‐derived EVs (Figure S3B ). EVs were collected from media of C26 cells treated with AI or GW4869 (as positive control 23 ). The dose‐dependent inhibitive effects of AI on EV production of C26 cells were demonstrated by the results of NTA (Figure 3 A ) and measuring the total protein amount (Figure S3C left). In our previous study, the results of AChE activity assay showed that AI exhibited dose‐dependent inhibitive effects on EV production of C26 cells. 26 In this study, the results of AChE activity assay showed that AI time‐dependently decreased the secretion of EVs by C26 tumour cells (Figure S3C right). The levels of multiple positive exosomal markers (CD9, TSG101 and Alix) also showed that AI treatment decreased exosomal marker levels, and the collected EVs were shown to express positive markers and almost none negative markers (Figure 3 C ). Influence of AI treatment on the secretion of IL‐6 was checked by analysing IL‐6 concentration in the culture medium. AI and C188–9 (a STAT3 inhibitor, used as a positive control) treatment could significantly reduce IL‐6 secretion (Figure 3 B ). Overall, the effect of AI‐ameliorated cancer cachexia symptoms may be mediated through a decrease in both EV and IL‐6 secretion.
Figure 3.
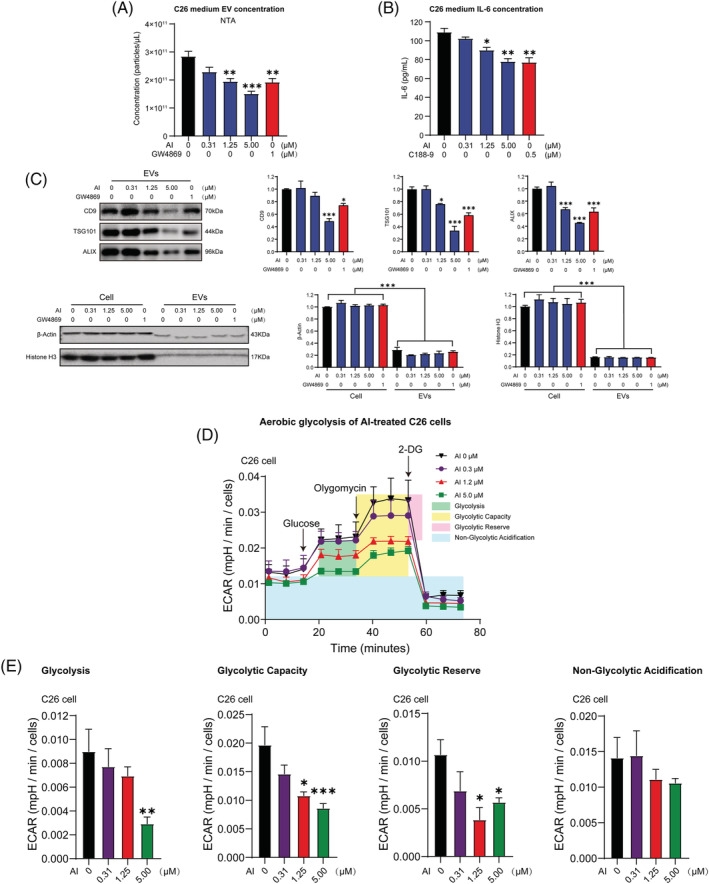
Effects of atractylenolide I (AI) in inhibiting extracellular vesicle (EV) and IL‐6 production of C26 cells as well as ameliorating aerobic glycolysis of C26 cells. (A) C26 cells were treated with varying concentrations of AI for 48 h; then EVs were derived from the media and quantified by NTA (Nanoparticle Tracking Analysis). (B) C26 cells were treated with varying concentrations of AI for 48 h; then the media were derived for IL‐6 detection; results of ELISA assay showed the influence of AI on IL‐6 secretion of C26 cells. (C) Western blotting of EV molecular markers in 20 μg of total cell lysate (TCL) of C26 cells, and 20 μg of EVs derived from C26 cells. Positive EV markers include CD9, TSG101 and Alix, whereas negative EV markers are β‐actin and histone H3. (D) Aerobic glycolysis of C26 cells treated with increasing concentrations of AI for 48 h was evaluated by monitoring extracellular acidification rate (ECAR) using Seahorse XFe96 Analyser. Glucose (10 mM) was first added to boost the glycolysis level, and the addition of ATP synthase inhibitor Oligomycin (2 μM) shut down oxidative phosphorylation, allowing the measurement of glycolytic capacity. The following addition of glycolysis inhibitor 2‐DG (50 mM) inhibited glycolysis and allowed us to evaluate the glycolytic reserve. (E) Results of quantification analysis of glycolysis, glycolytic capacity, glycolytic reserve and non‐glycolytic acidification. Data presented were the mean ± SEM of three independent experiments (A–C). Values were expressed as mean ± SEM (D, E). *P < 0.05, **P < 0.01, ***P < 0.001. Statistical tests one‐way ANOVA/Bonferroni's post hoc test was performed.
Atractylenolide I decreased aerobic glycolysis of C26 cells
Glycolysis potency of AI‐treated C26 cells was evaluated by measuring ECAR. AI treatment reduced overall glycolytic flux in C26 cells (Figure 3 D ). Glycolysis, glycolytic capacity and glycolytic reserve were all significantly reduced by AI treatment. No change was observed in non‐glycolytic acidification (Figure 3 E ). These results suggested that AI treatment caused significant decrease in aerobic glycolysis of C26 cells.
The inhibitive effects of atractylenolide I on STAT3 pathway contributed to its decreasing effects on extracellular vesicle production and aerobic glycolysis of C26 cells
To further investigate whether AI‐mediated inhibitory effect on EV production and aerobic glycolysis is attributed to suppression of p‐STAT3, we tested the effects of AI on STAT3 OE or KO C26 cells. STAT3 OE enhanced STAT3 and p‐STAT3 expression in C26 cells and significantly antagonized AI‐mediated inhibitory effect on p‐STAT3 expression (Figure 4 A ). STAT3 KO suppressed the expression of STAT3 and p‐STAT3 in C26 cells while its p‐STAT3 level could be significantly further augmented by AI treatment (Figure 4 B ). AI treatment suppressed EV secretion of C26 cells, whereas STAT3 OE significantly counteracted AI‐mediated inhibitory effect on EV secretion of C26 cells (Figure 4 C , NTA; Figure S3D left, BCA protein quantitation; Figure S3D right, AChE activity assay). STAT3 KO significantly further enhanced AI‐induced inhibitory effect on the EV secretion of C26 cells (Figure 4 D , NTA; Figure S3E left, BCA protein quantitation; Figure S3E right, AChE activity assay). Glycolysis stress assay showed AI treatment suppressed overall glycolytic flux (Figure 5 A,B ), glycolysis, glycolytic capacity and glycolytic reserve (Figure 5 C,D ) of C26 cells, whereas there was a tendency of STAT3 OE to counteract the AI‐mediated inhibitory effect on the aerobic glycolysis of C26 cells, although there were no significant differences. STAT3 KO enhanced AI‐induced inhibitory effect on aerobic glycolysis of C26 cells. These results revealed that AI suppressed EV production and glycolysis of C26 cells by inhibiting activation of STAT3 pathway.
Figure 4.
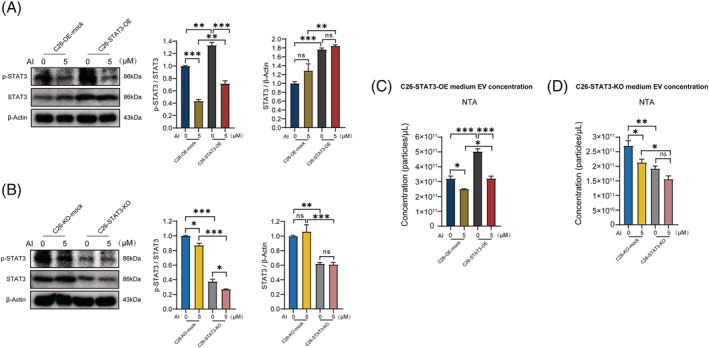
Effects of atractylenolide I (AI) on p‐STAT3 expression in STAT3 overexpression (OE) and knockout (KO) C26 cells. (A, B) Western blotting analysis of p‐STAT3 and STAT3 proteins in AI‐treated C26‐STAT3‐OE and C26‐STAT3‐KO cells. (C, D) Results of NTA (Nanoparticle Tracking Analysis) showed the concentrations of extracellular vesicles (EVs) in conditioned medium of AI‐treated C26‐STAT3‐OE and C26‐STAT3‐KO cells. Data presented are the mean ± SEM of three independent experiments. ns P > 0.05, *P < 0.05, **P < 0.01, ***P < 0.001. Statistical tests one‐way ANOVA/Bonferroni's post hoc test was performed.
Figure 5.
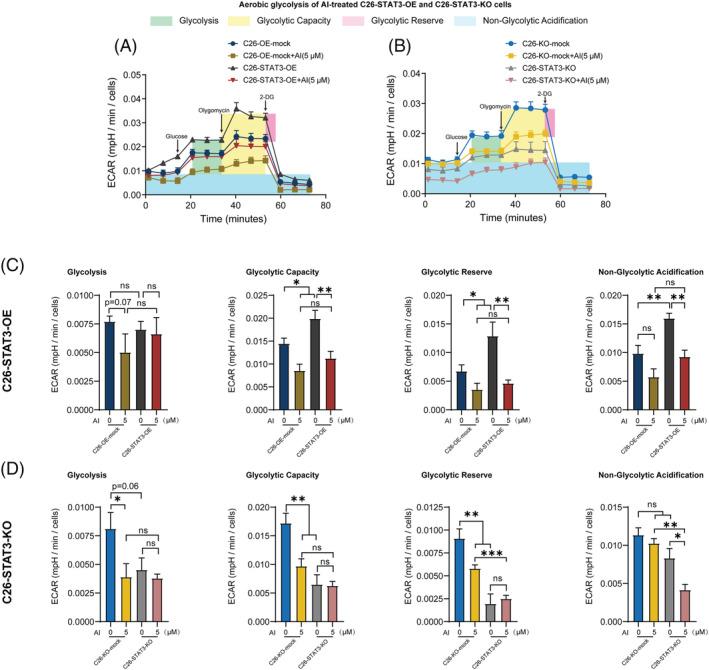
Effects of atractylenolide I (AI) in ameliorating aerobic glycolysis of STAT3 overexpression (OE) and knockout (KO) C26 cells. (A, B) Aerobic glycolysis of AI‐treated C26‐STAT3‐OE and C26‐STAT3‐KO cells was evaluated by monitoring extracellular acidification rate (ECAR) using Seahorse XFe96 Analyser. Glucose (10 mM) was first added to boost the glycolysis level, and the addition of ATP synthase inhibitor Oligomycin (2 μM) shut down oxidative phosphorylation, allowing the measurement of glycolytic capacity. The following addition of glycolysis inhibitor 2‐DG (50 mM) inhibited glycolysis and allowed us to evaluate the glycolytic reserve. (C, D) Results of quantification analysis of glycolysis, glycolytic capacity, glycolytic reserve and non‐glycolytic acidification. Values were expressed as mean ± SEM. ns P > 0.05, *P < 0.05, **P < 0.01, ***P < 0.001. Statistical tests one‐way ANOVA/Bonferroni's post hoc test was performed.
Atractylenolide I attenuated the potency of medium derived from STAT3 knockout or overexpression C26 cells in inducing muscle atrophy and lipolysis
We checked the effects of AI in ameliorating the potency of medium derived from STAT3 KO or OE C26 cells in inducing muscle atrophy and lipolysis. AI treatment suppressed the potency of medium of C26 cells in inducing atrophy of C2C12 myotubes, whereas STAT3 OE significantly counteracted the AI‐mediated alleviation effect on the potency of C26 medium in inducing atrophy of C2C12 myotubes (Figure 6 A ). STAT3 KO slightly enhanced AI‐induced alleviation effect on the potency of C26 medium in inducing atrophy of C2C12 myotubes (Figure 6 B ). AI treatment enhanced MHC and MyoD expression levels and decreased Atrogin‐1 and MuRF‐1 expression levels, whereas STAT3 OE counteracted AI‐mediated alleviation effect on MHC, MyoD, Atrogin‐1 and MuRF‐1 expression levels (Figure 6 C ). STAT3 KO significantly enhanced AI‐induced alleviation effects on MHC level and slightly enhanced AI‐induced alleviation effect on MyoD, Atrogin‐1 and MuRF‐1 expression levels (Figure 6 D ).
Figure 6.
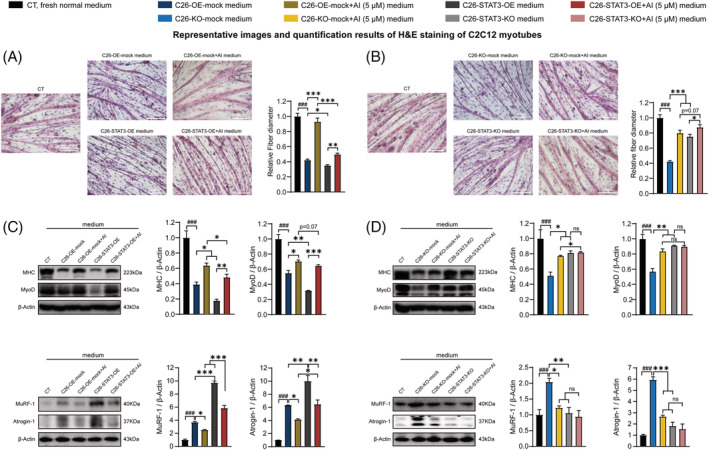
Effects of the media derived from atractylenolide I (AI)‐treated C26‐STAT3‐overexpression (OE) and AI‐treated C26‐STAT3‐knockout (KO) cells in inducing atrophy of C2C12 myotubes. C2C12 myoblasts were differentiated into C2C12 myotubes. The C2C12 myotubes were cultured with media derived from non‐tumour cells (CT, black, 1:1 dilution with fresh normal medium), C26‐OE‐mock cells or C26‐KO‐mock cells (C26‐OE‐mock medium, C26‐KO‐mock medium, blue, 1:1 dilution with fresh normal medium), AI‐treated C26‐OE‐mock cells or AI‐treated C26‐KO‐mock cells (C26‐OE‐mock + AI medium, C26‐KO‐mock + AI medium, yellow, 1:1 dilution with fresh normal medium), C26‐STAT3‐OE cells or C26‐STAT3‐KO cells (C26‐STAT3‐OE medium, C26‐STAT3‐KO medium, grey, 1:1 dilution with fresh normal medium) and AI‐treated C26‐STAT3‐OE cells or AI‐treated C26‐STAT3‐KO cells (C26‐STAT3‐OE + AI medium, C26‐STAT3‐KO + AI medium, red, 1:1 dilution with fresh normal medium) for 48 h for the following experiments. (A, B) Representative images and quantification results of haematoxylin–eosin (H&E) staining of C2C12 myotubes. Scale bar, 100 μm. (C, D) Western blotting analysis of MHC (myosin heavy chain), MyoD, Atrogin‐1 and MuRF‐1 expression levels in different groups. Data presented were the mean ± SEM of three independent experiments. # P < 0.05, ## P < 0.01, ### P < 0.001; ns P > 0.05, *P < 0.05, **P < 0.01, ***P < 0.001. Statistical tests one‐way ANOVA/Bonferroni's post hoc test was performed.
AI treatment suppressed the potency of C26 medium in inducing lipolysis of 3T3‐L1 adipocytes, whereas STAT3 OE counteracted AI‐mediated alleviation effect on the potency of C26 medium in inducing lipolysis of 3T3‐L1 adipocytes (Figure 7 A ). Because STAT3 KO had already greatly decreased the potency of C26 medium in inducing lipolysis, effect of STAT3 KO in enhancing AI‐induced alleviation effect on the potency of C26 medium in inducing lipolysis was not significant (Figure 7 B ). AI treatment suppressed UCP1 and enhanced Perilipin‐1 expression levels of 3T3‐L1 adipocytes, whereas STAT3 OE counteracted AI‐mediated alleviation effect on UCP1 and Perilipin‐1 expression levels (Figure 7 C ). STAT3 KO significantly enhanced AI‐induced alleviation effect on UCP1 and Perilipin‐1 expression levels (Figure 7 D ). Measurement of glycerol and TG showed that AI treatment suppressed release of glycerol from 3T3‐L1 adipocytes and enhanced TG content in 3T3‐L1 adipocytes, whereas STAT3 OE significantly counteracted AI‐mediated alleviation effect on the release of glycerol and the TG content. STAT3 KO enhanced AI‐induced alleviation effect on the release of glycerol and the TG content (Figure 7 E,F ). These results further illustrated that the ameliorating effects of AI on cancer cachexia were based on its inhibitive effects on STAT3 pathway.
Figure 7.
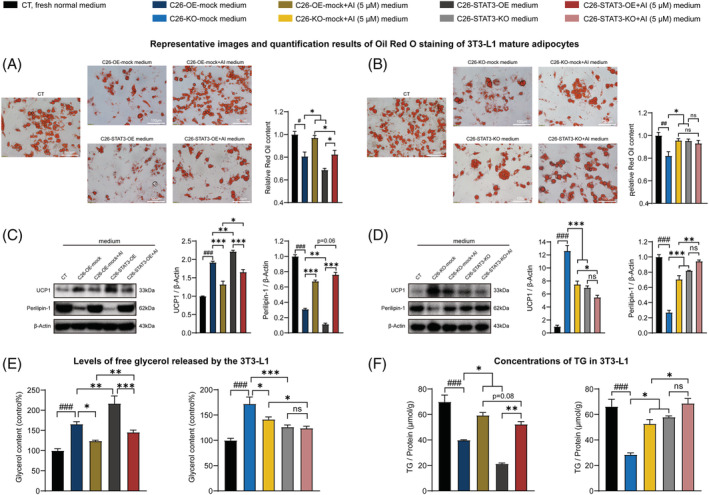
Effects of the media derived from atractylenolide I (AI)‐treated C26‐STAT3‐overexpression (OE) and AI‐treated C26‐STAT3‐knockout (KO) cells in inducing lipolysis of 3T3‐L1 adipocytes. 3T3‐L1 pre‐adipocytes cells were differentiated into 3T3‐L1 mature adipocytes. The 3T3‐L1 mature adipocytes were cultured with media derived from non‐tumour cells (CT, black, 1:1 dilution with fresh normal medium), C26‐OE‐mock cells or C26‐KO‐mock cells (C26‐OE‐mock medium, C26‐KO‐mock medium, blue, 1:1 dilution with fresh normal medium), AI‐treated C26‐OE‐mock cells or AI‐treated C26‐KO‐mock cells (C26‐OE‐mock + AI medium, C26‐KO‐mock + AI medium, yellow, 1:1 dilution with fresh normal medium), C26‐STAT3‐OE cells or C26‐STAT3‐KO cells (C26‐STAT3‐OE medium, C26‐STAT3‐KO medium, grey, 1:1 dilution with fresh normal medium) and AI‐treated C26‐STAT3‐OE cells or AI‐treated C26‐STAT3‐KO cells (C26‐STAT3‐OE + AI medium, C26‐STAT3‐KO + AI medium, red, 1:1 dilution with fresh normal medium) for 48 h for the following experiments. (A, B) Representative images and quantification results of Oil Red O staining of 3T3‐L1 mature adipocytes. Scale bar, 100 μm. (C, D) Western blotting analysis of UCP1 and Perilipin‐1 protein expression levels in the 3T3‐L1 mature adipocytes of different groups. (E) Levels of free glycerol released by the 3T3‐L1 mature adipocytes. (F) Concentrations of triglyceride (TG) in the 3T3‐L1 mature adipocytes. Data presented were the mean ± SEM of three independent experiments. # P < 0.05, ## P < 0.01, ### P < 0.001; ns P > 0.05, *P < 0.05, **P < 0.01, ***P < 0.001. Statistical tests one‐way ANOVA/Bonferroni's post hoc test was performed.
Atractylenolide I decreased the biogenesis of extracellular vesicles through the STAT3/PKM2/SNAP23 pathway
Our previous study reported that the control of EV biogenesis by STAT3 pathway was conducted by regulating aerobic glycolysis through STAT3/PKM2/SNAP23 pathway, 26 so we checked the effects of AI on STAT3/PKM2/SNAP23 pathway both in STAT3 OE and KO C26 cells and in C26 tumours. STAT3 OE enhanced p‐PKM2 and p‐SNAP23 expression of C26 cells and antagonized AI‐mediated inhibitory effect on p‐PKM2 and p‐SNAP23 expression (Figure 8 A ). STAT3 KO decreased the expression of p‐PKM2 and p‐SNAP23 and significantly enhanced AI‐mediated inhibitory effect on p‐PKM2 and p‐SNAP23 expression (Figure 8 B ). Levels of p‐STAT3, p‐PKM2 and p‐SNAP23 in C26 tumour tissues isolated from AI‐treated mice were significantly lower than mice without AI treatment (Figure 8 C,D ). These results indicated that AI could inhibit biogenesis of IL‐6 and EVs through STAT3/PKM2/SNAP23 pathway, thereby ameliorating cancer cachexia.
Figure 8.
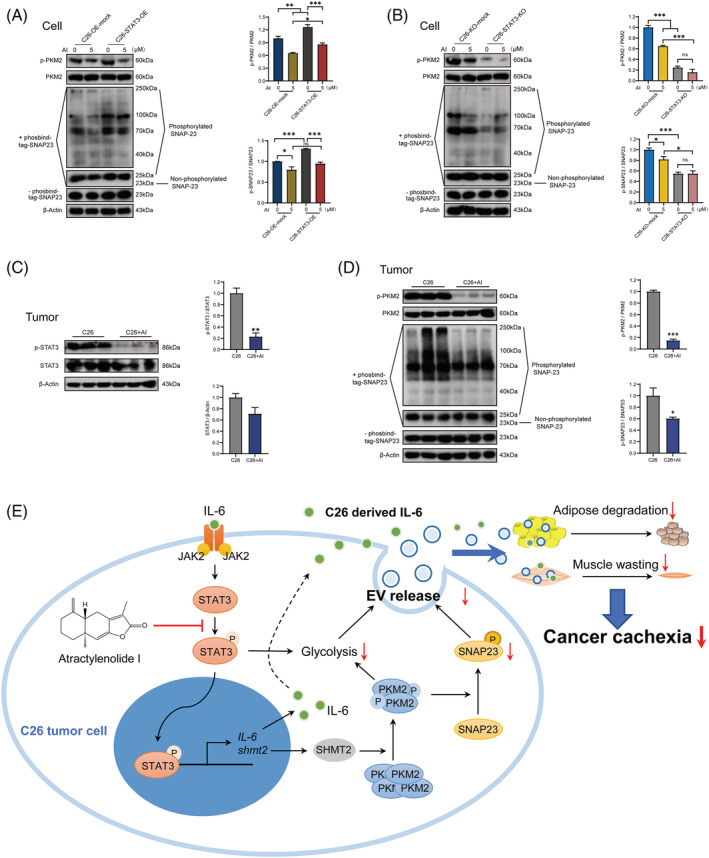
Effects of atractylenolide I (AI) on STAT3/PKM2/SNAP23 pathway. (A) Western blotting analysis of p‐PKM2, PKM2, p‐SNAP23 and SNAP23 proteins in AI‐treated C26‐overexpression (OE)‐mock and AI‐treated C26‐STAT3‐OE cells. (B) Western blotting analysis of p‐PKM2, PKM2, p‐SNAP23 and SNAP23 proteins in AI‐treated C26‐knockout (KO)‐mock and AI‐treated C26‐STAT3‐KO cells. (C) Western blotting analysis of p‐STAT3 and STAT3 proteins in AI‐treated (25 mg/kg) C26 tumours. (D) Western blotting analysis of p‐PKM2, PKM2, p‐SNAP23 and SNAP23 proteins in AI‐treated (25 mg/kg) C26 tumours. (E) Schematic illustration of the mechanism. A diagram of the proposed mechanism shows that AI attenuated cachexia symptoms by targeting STAT3. AI inhibited the phosphorylation of STAT3 and PKM2, leading to downregulation of glycolysis effect and p‐SNAP23 expression, reduced release of extracellular vesicle (EV), thus attenuating muscle wasting and adipose degradation. The inhibition of IL‐6 secretion also played a role. (A, B) Data presented were the mean ± SEM of three independent experiments. (C, D) Values were expressed as mean ± SEM. ns P > 0.05, *P < 0.05, **P < 0.01, ***P < 0.001. Statistical tests were performed as follows: (A, B) one‐way ANOVA/Bonferroni's post hoc test, (C, D) Student's t‐test.
Discussion
The presence of a variety of divergent pro‐cachectic mechanisms makes it complex to define a single standard treatment for cachectic patients. 3 Anamorelin is currently the only approved cancer cachexia therapy, but its impact on physical function and muscle strength is still inconclusive. 2 The usefulness of anti‐inflammatory cytokine therapies on cancer cachexia have been reported, while the results of most of them were less good. 31 Cancer cell‐derived exosomal cargo could exacerbate cachexia by acting on distant adipose and muscle tissues 32 ; thus, inhibition of EV secretion of tumour cells might be an effective therapeutic strategy. There are several studies that confirmed this therapeutic strategy. ZIP4 knockdown in tumours, Omeprazole and Amiloride could ameliorate cancer cachexia by inhibiting cancer cell release of EVs. 12 , 33 , 34 The efficacy of AI in ameliorating cancer cachexia suggested that inhibiting production of both inflammatory cytokines and tumour‐derived EVs of tumour cells might be a promising therapeutic strategy for cancer cachexia.
EVs emerged as a novel mediator for cancer cachexia. 11 , 13 Our previous study revealed that compared with non‐cachectic MC38 colon cancer cell, cachectic C26 colon cancer cell secreted more EVs with capacity of inducing cancer cachexia symptoms. 23 IL‐6 is one of the well‐studied inducers in cancer cachexia. 20 Circulating levels of IL‐6 have been shown to correlate with cachexia in cancer patients. 35 Especially, IL‐6 is functionally linked to cachexia in murine C26 colon adenocarcinoma model of cancer cachexia, 21 which was used in this study. Considering the important roles of EVs and IL‐6 in the development of cancer cachexia, inhibitive effects of AI on production of EVs and IL‐6 would contribute a lot to the ameliorating effects of AI on cancer cachexia, and this was indeed confirmed in the present study.
AI is a well‐known natural STAT3 inhibitor and its inhibitive effects on STAT3 pathway were reported before. 16 , 17 , 36 STAT3 inhibitors could exhibit direct protective effects on myotubes and adipocytes by inhibiting the activation of STAT3 pathway of these cells in cancer cachexia and thus ameliorate muscle atrophy or lipolysis. 37 Our results excluded this effect of AI remaining in C26 medium; direct treatment of C2C12 myotubes or 3T3‐L1 adipocytes with AI could not protect them from atrophy or lipolysis induced by C26 medium. And C26 cells showed significantly higher STAT3 and p‐STAT3 expression levels than C2C12 myotubes. This may at least partly explain the sensitivity of C26 tumour cells to AI treatment.
The decreasing effects of AI on EV and IL‐6 production were resulted from its inhibitive effects on STAT3 pathway of C26 cells. In our previous research, we had found that STAT3/PKM2/SNAP23 pathway and STAT3‐controlled glycolysis play important roles in the regulation of EV biogenesis of tumour cells. 26 PKM2 is an enzyme involved in the tumour cell's reliance on aerobic glycolysis. Activated STAT3 lead to enhanced glycolysis and increased phosphorylation of PKM2 by inducing expression of SHMT2. 38 , 39 PKM2 phosphorylation of SNAP23 is a key to SNARE complex formation and the secretion of EVs in tumour cells. 39 Results of the present study showed that AI inhibited the phosphorylation of STAT3 and PKM2, leading to downregulation of glycolysis effect and p‐SNAP23 expression, and thus decreased EV production of C26 tumour cells both in vitro and in vivo. STAT3 belongs to a family of proteins that generally transduce signals from activated receptors or intracellular kinases to the nucleus, thus activating and regulating gene transcription. Hyperactivation of STAT3 signalling occurs in majority of human cancers and also correlates with a poor prognosis. 15 , 37 In this study, OE of STAT3 antagonized AI‐caused inhibition on activation of STAT3/PKM2/SNAP23 pathway, EV secretion, glycolysis in C26 cells and the potency of C26 medium in inducing muscle atrophy and lipolysis, whereas KO of STAT3 enhanced the inhibitory effect of AI on these values. These results further confirmed the involvement of STAT3 pathway in the EV production and cachexia‐inducing potency of tumour cells and also emphasized the role of STAT3 inhibition in the effects of AI. The involvement of STAT3 pathway in IL‐6 production is well known. 15 Thus, the decreasing effects of AI on IL‐6 production might also be resulted from its inhibitive effects on STAT3 pathway.
Taken together, AI inhibited the phosphorylation of STAT3 and PKM2, leading to downregulation of glycolysis effect and p‐SNAP23 expression, reduced EV secretion, thus attenuating muscle wasting and adipose degradation. Of course, the inhibition of IL‐6 secretion also played a role. Schematic illustration of the mechanisms of AI was shown in Figure 8 E . Results of the present study clarified the mechanisms of AI in ameliorating cancer cachexia and supported the use of traditional Chinese medicine Baizhu in clinic cancer cachexia therapy of Asian countries. Furthermore, results of the current study showed the efficacy of targeting production of cytokines and EVs of tumour cells in the treatment of cancer cachexia, which might be used in combination with other therapeutic strategies for cancer cachexia.
Conflict of interest
All authors declare that they have no conflict of interest.
Supporting information
Figure S1. AI attenuated cachexia symptoms of C26 tumor‐bearing mice. C26 tumor‐bearing mice were administrated with AI (25 mg/kg) by intraperitoneal injection every day for 18 days, and healthy BALB/c mice and C26 model group mice received equal volume solvent. Body weight, food intake and tumor volume were recorded every day. The GA, TAL muscle and eWAT tissues were dissected, weighed and then fixed in 4% PFA at the end of the experiment. A. Changes in body weight of mice. Percent weight change of mice was determined by the following equation: % weight change = ((weight at end day X‐ weight at day 0)/weight at day 0) *100. B. Accumulative food intake of mice. Mice from each group were placed in one cage. Daily food intake per cage was weighed to calculate average daily food intake per mouse. The accumulative food intake per mouse (day 0) = 0 g, the accumulative food intake per mouse (day 1) = the average daily food intake per mouse (day 1) + accumulative food intake per mouse (day 0), the accumulative food intake per mouse (day 2) = the average daily food intake per mouse (day 2) + accumulative food intake per mouse (day 1), and so on successively, until the end of the experiment. C, D. Tumor volume and Tumor weight of mice. E, F. Levels of glycerol and triglyceride (TG) in serum of mice. G. TAL weight of mice. Results of quantification of the myofiber area of TAL tissues and representative photos of H&E‐stained sections of mice TAL. Scale bar, 20 μm. Values were expressed as mean ± SEM (Healthy group: n = 8, C26 model group: n = 7, C26 + AI group: n = 7). # versus Healthy group mice; * versus C26 model group mice. # p < 0.05, ## p < 0.01, ### p < 0.001; * p < 0.05, ** p < 0.01. Statistical tests were performed as follows: (C, D) Student's t‐test, (A, E, F, G) one‐way ANOVA/ Bonferroni's post hoc test.
Figure S2. Effects of AI on C2C12 myotube atrophy and the lipolysis of 3T3‐L1 adipocytes in cancer cachexia model in vitro. A. C26 cells were treated with increasing concentrations of AI for 48 h, then the cell number of C26 cells were measured by the BioTek Cytation 5. B. Results of MTT assay showed the cell viability of C2C12 myotubes treated with increasing concentrations of AI for 48 h. C. Results of MTT assay showed the cell viability of 3T3‐L1 mature adipocytes treated with increasing concentrations of AI for 48 h. D. Western blotting analysis of p‐STAT3 and STAT3 proteins in C26 cells (C26), C2C12 myotubes (C2C12) and atrophied C2C12 myotubes induced by C26 medium (C2C12 + C26 medium). (E‐F) C2C12 myoblasts and 3T3‐L1 pre‐adipocytes cells were differentiated into myotubes and 3T3‐L1 mature adipocytes. The atrophy of C2C12 myotubes and the lipolysis of 3T3‐L1 mature adipocytes were induced by C26‐medium (1:1 dilution with fresh normal medium), at the same time, to check protective effects of AI on atrophy of C2C12 myotubes and lipolysis of 3T3‐L1 mature adipocytes induced by C26 medium, the C2C12 myotubes and 3T3‐L1 mature adipocytes were treated with increasing concentrations of AI or PDTC for 48 h. E. Effects of AI on the cytomorphology of C2C12 myotube atrophy induced by C26 medium. Scale bar, 100 μm. F. Oil Red O stained lipid droplets to detect the effect of AI on the lipolysis of 3T3‐L1 mature adipocyte induced by C26 medium. Scale bar, 100 μm. Data presented were the mean ± SEM of three independent experiments. # p < 0.05, ### p < 0.001; ns p > 0.05, * p < 0.05, *** p < 0.001. Statistical tests one‐way ANOVA/ Bonferroni's post hoc test was performed.
Figure S3. Effects of AI in inhibiting EV production of C26 cells. A. Electron microscopy images of EVs isolated from C26 medium. Scale bars, 400 nm. B. C26 cells were treated with varying concentrations of AI for 48 h, and EVs were derived from the media for particle size analysis. NTA was used for particle size analysis of C26‐derived EVs. C. C26 cells were treated with varying concentrations of AI for 48 h, then EVs were derived from the media and quantified by measuring the total protein amount (left), and the ratios of particles per μg protein showed the high purity of EV‐enriched preparations. C26 cells were treated with AI (5 μM) for various times, then EVs were derived from the media and quantified by AChE activity assay (right). D, E. Results of measuring the total protein amount (left) and AChE activity assay (right) showed the relative amounts of EVs in conditioned medium of AI‐treated (48 h) C26‐STAT3‐OE and C26‐STAT3‐KO cells, and the ratios of particles per μg protein showed the high purity of EV‐enriched preparations. Data presented were the mean ± SEM of three independent experiments. * p < 0.05, ** p < 0.01, *** p < 0.001. Statistical tests one‐way ANOVA/ Bonferroni's post hoc test was performed.
Table S1 Materials and reagents
Table S2 Cell lines
Table S3 Antibodies used in Western blot analysis
Acknowledgements
This work was supported by National Nature Science Foundation of China (81873056 and 81872496), the Science and Technology Commission of Shanghai Municipality (20S11902200 and 16DZ2280100) and the Combination of Medical Care and Health Project of Shanghai University of Traditional Chinese Medicine (YYKC‐2021‐01‐119). The authors certify that they comply with the ethical guidelines for authorship and publishing of the Journal of Cachexia, Sarcopenia and Muscle. 40
Fan M, Gu X, Zhang W, Shen Q, Zhang R, Fang Q, Wang Y, Guo X, Zhang X, and Liu X (2022) Atractylenolide I ameliorates cancer cachexia through inhibiting biogenesis of IL‐6 and tumour‐derived extracellular vesicles, Journal of Cachexia, Sarcopenia and Muscle, 13, 2724–2739, doi: 10.1002/jcsm.13079
Contributor Information
Meng Fan, Email: fanmeng566@163.com.
Xiaodong Guo, Email: gxd1996@shutcm.edu.cn.
Xiongwen Zhang, Email: xwzhang@sat.ecnu.edu.cn.
Xuan Liu, Email: xuanliu@shutcm.edu.cn.
References
- 1. Argilés JM, Busquets S, Stemmler B, López‐Soriano FJ. Cancer cachexia: understanding the molecular basis. Nat Rev Cancer 2014;14:754–762. [DOI] [PubMed] [Google Scholar]
- 2. Wakabayashi H, Arai H, Inui A. The regulatory approval of anamorelin for treatment of cachexia in patients with non‐small cell lung cancer, gastric cancer, pancreatic cancer, and colorectal cancer in Japan: facts and numbers. J Cachexia Sarcopenia Muscle 2021;12:14–16. [DOI] [PMC free article] [PubMed] [Google Scholar]
- 3. Santos JMO, Costa AC, Dias TR, Satari S, Costa e Silva MP, da Costa RMG, et al. Towards drug repurposing in cancer cachexia: potential targets and candidates. Pharmaceuticals (Basel) 2021;14:1084. [DOI] [PMC free article] [PubMed] [Google Scholar]
- 4. Bailly C. Atractylenolides, essential components of Atractylodes‐based traditional herbal medicines: antioxidant, anti‐inflammatory and anticancer properties. Eur J Pharmacol 2021;891:173735. [DOI] [PubMed] [Google Scholar]
- 5. Xiaomei R, Wenwen Q, Bao X. Effects of modified Sijunzi decoction and nutrition preparation on nutritional state of cancer patients. West J Trad Chin Med 2021;34:81–83. [Google Scholar]
- 6. Ko MH, Song SY, Ha SJ, Lee JY, Yoon SW, Park JH, et al. Efficacy and safety of Yukgunja‐tang for patients with cancer‐related anorexia: a randomized, controlled trial, pilot study. Integr Cancer Ther 2021;20:15347354211019107. [DOI] [PMC free article] [PubMed] [Google Scholar]
- 7. Cheon C, Yoo JE, Yoo HS, Cho CK, Kang S, Kim M, et al. Efficacy and safety of Sipjeondaebo‐tang for anorexia in patients with cancer: a pilot, randomized, double‐blind, placebo‐controlled trial. Evid Based Complement Alternat Med 2017;2017:1–9. [DOI] [PMC free article] [PubMed] [Google Scholar]
- 8. Liu Y, Jia Z, Dong L, Wang R, Qiu G. A randomized pilot study of atractylenolide I on gastric cancer cachexia patients. Evid Based Complement Alternat Med 2008;5:337–344. [DOI] [PMC free article] [PubMed] [Google Scholar]
- 9. Zhang WL, Li N, Shen Q, Fan M, Guo XD, Zhang XW, et al. Establishment of a mouse model of cancer cachexia with spleen deficiency syndrome and the effects of atractylenolide I. Acta Pharmacol Sin 2020;41:237–248. [DOI] [PMC free article] [PubMed] [Google Scholar]
- 10. AlSudais H, Rajgara R, Saleh A, Wiper‐Bergeron N. C/EBPβ promotes the expression of atrophy‐inducing factors by tumours and is a central regulator of cancer cachexia. J Cachexia Sarcopenia Muscle 2022;13:743–757. [DOI] [PMC free article] [PubMed] [Google Scholar]
- 11. Chitti SV, Fonseka P, Mathivanan S. Emerging role of extracellular vesicles in mediating cancer cachexia. Biochem Soc Trans 2018;46:1129–1136. [DOI] [PubMed] [Google Scholar]
- 12. Liu Z, Xiong J, Gao S, Zhu MX, Sun K, Li M, et al. Ameliorating cancer cachexia by inhibiting cancer cell release of Hsp70 and Hsp90 with omeprazole. J Cachexia Sarcopenia Muscle 2021;13:636–647. [DOI] [PMC free article] [PubMed] [Google Scholar]
- 13. Pin F, Beltrà M, Garcia‐Castillo L, Pardini B, Birolo G, Matullo G, et al. Extracellular vesicles derived from tumour cells as a trigger of energy crisis in the skeletal muscle. J Cachexia Sarcopenia Muscle 2021;13:481–494. [DOI] [PMC free article] [PubMed] [Google Scholar]
- 14. Valle‐Mendiola A, Soto‐Cruz I. Energy metabolism in cancer: the roles of STAT3 and STAT5 in the regulation of metabolism‐related genes. Cancers (Basel) 2020;12:124. [DOI] [PMC free article] [PubMed] [Google Scholar]
- 15. Johnson DE, O'Keefe RA, Grandis JR. Targeting the IL‐6/JAK/STAT3 signalling axis in cancer. Nat Rev Clin Oncol 2018;15:234–248. [DOI] [PMC free article] [PubMed] [Google Scholar]
- 16. Li Y, Wang Y, Liu Z, Guo X, Miao Z, Ma S. Atractylenolide I induces apoptosis and suppresses glycolysis by blocking the JAK2/STAT3 signaling pathway in colorectal cancer cells. Front Pharmacol 2020;11:273. [DOI] [PMC free article] [PubMed] [Google Scholar]
- 17. Fu XQ, Chou JY, Li T, Zhu PL, Li JK, Yin CL, et al. The JAK2/STAT3 pathway is involved in the anti‐melanoma effects of atractylenolide I. Exp Dermatol 2018;27:201–204. [DOI] [PubMed] [Google Scholar]
- 18. Dorayappan KDP, Wanner R, Wallbillich JJ, Saini U, Zingarelli R, Suarez AA, et al. Hypoxia‐induced exosomes contribute to a more aggressive and chemoresistant ovarian cancer phenotype: a novel mechanism linking STAT3/Rab proteins. Oncogene 2018;37:3806–3821. [DOI] [PMC free article] [PubMed] [Google Scholar]
- 19. McAndrews KM, Kalluri R. Mechanisms associated with biogenesis of exosomes in cancer. Mol Cancer 2019;18:52. [DOI] [PMC free article] [PubMed] [Google Scholar]
- 20. Fearon KC, Glass DJ, Guttridge DC. Cancer cachexia: mediators, signaling, and metabolic pathways. Cell Metab 2012;16:153–166. [DOI] [PubMed] [Google Scholar]
- 21. Rupert JE, Narasimhan A, Jengelley DHA, Jiang Y, Liu J, Au E, et al. Tumor‐derived IL‐6 and trans‐signaling among tumor, fat, and muscle mediate pancreatic cancer cachexia. J Exp Med 2021;218:e20190450. [DOI] [PMC free article] [PubMed] [Google Scholar]
- 22. Redell MS, Ruiz MJ, Alonzo TA, Gerbing RB, Tweardy DJ. Stat3 signaling in acute myeloid leukemia: ligand‐dependent and ‐independent activation and induction of apoptosis by a novel small‐molecule Stat3 inhibitor. Blood 2011;117:5701–5709. [DOI] [PMC free article] [PubMed] [Google Scholar]
- 23. Miao C, Zhang W, Feng L, Gu X, Shen Q, Lu S, et al. Cancer‐derived exosome miRNAs induce skeletal muscle wasting by Bcl‐2‐mediated apoptosis in colon cancer cachexia. Mol Ther – Nucl Acids 2021;24:923–938. [DOI] [PMC free article] [PubMed] [Google Scholar]
- 24. Hayatudin R, Fong Z, Ming LC, Goh BH, Lee WL, Kifli N. Overcoming chemoresistance via extracellular vesicle inhibition. Front Mol Biosci 2021;8:629874. [DOI] [PMC free article] [PubMed] [Google Scholar]
- 25. Miao C, Lv Y, Zhang W, Chai X, Feng L, Fang Y, et al. Pyrrolidine dithiocarbamate (PDTC) attenuates cancer cachexia by affecting muscle atrophy and fat lipolysis. Front Pharmacol 2017;8:915. [DOI] [PMC free article] [PubMed] [Google Scholar]
- 26. Fan M, Sun W, Gu X, Lu S, Shen Q, Liu X, et al. The critical role of STAT3 in biogenesis of tumor‐derived exosomes with potency of inducing cancer cachexia in vitro and in vivo. Oncogene 2022;41:1050–1062. [DOI] [PubMed] [Google Scholar]
- 27. Lu S, Li Y, Shen Q, Zhang W, Gu X, Ma M, et al. Carnosol and its analogues attenuate muscle atrophy and fat lipolysis induced by cancer cachexia. J Cachexia Sarcopenia Muscle 2021;12:779–795. [DOI] [PMC free article] [PubMed] [Google Scholar]
- 28. Shen Q, Kuang JX, Miao CX, Zhang WL, Li YW, Zhang XW, et al. Alantolactone ameliorates cancer cachexia‐associated muscle atrophy mainly by inhibiting the STAT3 signaling pathway. Phytomedicine 2021;95:153858. [DOI] [PubMed] [Google Scholar]
- 29. Webber J, Clayton A. How pure are your vesicles? J Extracell Vesicles 2013;2:eCollection 2013:19861. [DOI] [PMC free article] [PubMed] [Google Scholar]
- 30. van der Pol E, Hoekstra AG, Sturk A, Otto C, van Leeuwen TG, Nieuwland R. Optical and non‐optical methods for detection and characterization of microparticles and exosomes. J Thromb Haemost 2010;8:2596–2607. [DOI] [PubMed] [Google Scholar]
- 31. Marceca GP, Londhe P, Calore F. Management of cancer cachexia: attempting to develop new pharmacological agents for new effective therapeutic options. Front Oncol 2020;10:298. [DOI] [PMC free article] [PubMed] [Google Scholar]
- 32. Kalluri R, LeBleu VS. The biology, function, and biomedical applications of exosomes. Science 2020;367:eaau6977. [DOI] [PMC free article] [PubMed] [Google Scholar]
- 33. Yang J, Zhang Z, Zhang Y, Ni X, Zhang G, Cui X, et al. ZIP4 promotes muscle wasting and cachexia in mice with orthotopic pancreatic tumors by stimulating RAB27B‐regulated release of extracellular vesicles from cancer cells. Gastroenterology 2019;156:722–734.e6. [DOI] [PMC free article] [PubMed] [Google Scholar]
- 34. Zhou L, Zhang T, Shao W, Lu R, Wang L, Liu H, et al. Amiloride ameliorates muscle wasting in cancer cachexia through inhibiting tumor‐derived exosome release. Skelet Muscle 2021;11:17. [DOI] [PMC free article] [PubMed] [Google Scholar]
- 35. Eskiler GG, Bezdegumeli E, Ozman Z, Ozkan AD, Kaleli S. IL‐6 mediated JAK/STAT3 signaling pathway in cancer patients with cachexia. Bratisl Med J 2019;120:819–826. [DOI] [PubMed] [Google Scholar]
- 36. Xiao Q, Zheng F, Wu J, Tang Q, Wang W, Hann SS. Activation of ERK and mutual regulation of Stat3 and SP1 contribute to inhibition of PDK1 expression by atractylenolide‐1 in human lung cancer cells. Cell Physiol Biochem 2017;43:2353–2366. [DOI] [PubMed] [Google Scholar]
- 37. Zimmers TA, Fishel ML, Bonetto A. STAT3 in the systemic inflammation of cancer cachexia. Semin Cell Dev Biol 2016;54:28–41. [DOI] [PMC free article] [PubMed] [Google Scholar]
- 38. Marrocco I, Altieri F, Rubini E, Paglia G, Chichiarelli S, Giamogante F, et al. Shmt2: a Stat3 signaling new player in prostate cancer energy metabolism. Cell 2019;8:1048. [DOI] [PMC free article] [PubMed] [Google Scholar]
- 39. Wei Y, Wang D, Jin F, Bian Z, Li L, Liang H, et al. Pyruvate kinase type M2 promotes tumour cell exosome release via phosphorylating synaptosome‐associated protein 23. Nat Commun 2017;8:14041. [DOI] [PMC free article] [PubMed] [Google Scholar]
- 40. von Haehling S, Morley JE, Coats AJS, Anker SD. Ethical guidelines for publishing in the Journal of Cachexia, Sarcopenia and Muscle: update 2021. J Cachexia Sarcopenia Muscle 2021;12:2259–2261. [DOI] [PMC free article] [PubMed] [Google Scholar]
Associated Data
This section collects any data citations, data availability statements, or supplementary materials included in this article.
Supplementary Materials
Figure S1. AI attenuated cachexia symptoms of C26 tumor‐bearing mice. C26 tumor‐bearing mice were administrated with AI (25 mg/kg) by intraperitoneal injection every day for 18 days, and healthy BALB/c mice and C26 model group mice received equal volume solvent. Body weight, food intake and tumor volume were recorded every day. The GA, TAL muscle and eWAT tissues were dissected, weighed and then fixed in 4% PFA at the end of the experiment. A. Changes in body weight of mice. Percent weight change of mice was determined by the following equation: % weight change = ((weight at end day X‐ weight at day 0)/weight at day 0) *100. B. Accumulative food intake of mice. Mice from each group were placed in one cage. Daily food intake per cage was weighed to calculate average daily food intake per mouse. The accumulative food intake per mouse (day 0) = 0 g, the accumulative food intake per mouse (day 1) = the average daily food intake per mouse (day 1) + accumulative food intake per mouse (day 0), the accumulative food intake per mouse (day 2) = the average daily food intake per mouse (day 2) + accumulative food intake per mouse (day 1), and so on successively, until the end of the experiment. C, D. Tumor volume and Tumor weight of mice. E, F. Levels of glycerol and triglyceride (TG) in serum of mice. G. TAL weight of mice. Results of quantification of the myofiber area of TAL tissues and representative photos of H&E‐stained sections of mice TAL. Scale bar, 20 μm. Values were expressed as mean ± SEM (Healthy group: n = 8, C26 model group: n = 7, C26 + AI group: n = 7). # versus Healthy group mice; * versus C26 model group mice. # p < 0.05, ## p < 0.01, ### p < 0.001; * p < 0.05, ** p < 0.01. Statistical tests were performed as follows: (C, D) Student's t‐test, (A, E, F, G) one‐way ANOVA/ Bonferroni's post hoc test.
Figure S2. Effects of AI on C2C12 myotube atrophy and the lipolysis of 3T3‐L1 adipocytes in cancer cachexia model in vitro. A. C26 cells were treated with increasing concentrations of AI for 48 h, then the cell number of C26 cells were measured by the BioTek Cytation 5. B. Results of MTT assay showed the cell viability of C2C12 myotubes treated with increasing concentrations of AI for 48 h. C. Results of MTT assay showed the cell viability of 3T3‐L1 mature adipocytes treated with increasing concentrations of AI for 48 h. D. Western blotting analysis of p‐STAT3 and STAT3 proteins in C26 cells (C26), C2C12 myotubes (C2C12) and atrophied C2C12 myotubes induced by C26 medium (C2C12 + C26 medium). (E‐F) C2C12 myoblasts and 3T3‐L1 pre‐adipocytes cells were differentiated into myotubes and 3T3‐L1 mature adipocytes. The atrophy of C2C12 myotubes and the lipolysis of 3T3‐L1 mature adipocytes were induced by C26‐medium (1:1 dilution with fresh normal medium), at the same time, to check protective effects of AI on atrophy of C2C12 myotubes and lipolysis of 3T3‐L1 mature adipocytes induced by C26 medium, the C2C12 myotubes and 3T3‐L1 mature adipocytes were treated with increasing concentrations of AI or PDTC for 48 h. E. Effects of AI on the cytomorphology of C2C12 myotube atrophy induced by C26 medium. Scale bar, 100 μm. F. Oil Red O stained lipid droplets to detect the effect of AI on the lipolysis of 3T3‐L1 mature adipocyte induced by C26 medium. Scale bar, 100 μm. Data presented were the mean ± SEM of three independent experiments. # p < 0.05, ### p < 0.001; ns p > 0.05, * p < 0.05, *** p < 0.001. Statistical tests one‐way ANOVA/ Bonferroni's post hoc test was performed.
Figure S3. Effects of AI in inhibiting EV production of C26 cells. A. Electron microscopy images of EVs isolated from C26 medium. Scale bars, 400 nm. B. C26 cells were treated with varying concentrations of AI for 48 h, and EVs were derived from the media for particle size analysis. NTA was used for particle size analysis of C26‐derived EVs. C. C26 cells were treated with varying concentrations of AI for 48 h, then EVs were derived from the media and quantified by measuring the total protein amount (left), and the ratios of particles per μg protein showed the high purity of EV‐enriched preparations. C26 cells were treated with AI (5 μM) for various times, then EVs were derived from the media and quantified by AChE activity assay (right). D, E. Results of measuring the total protein amount (left) and AChE activity assay (right) showed the relative amounts of EVs in conditioned medium of AI‐treated (48 h) C26‐STAT3‐OE and C26‐STAT3‐KO cells, and the ratios of particles per μg protein showed the high purity of EV‐enriched preparations. Data presented were the mean ± SEM of three independent experiments. * p < 0.05, ** p < 0.01, *** p < 0.001. Statistical tests one‐way ANOVA/ Bonferroni's post hoc test was performed.
Table S1 Materials and reagents
Table S2 Cell lines
Table S3 Antibodies used in Western blot analysis