

Abstract
Background
Patients with end‐stage renal disease (ESRD) are at an increased risk of developing sarcopenia, which can lead to various adverse health outcomes. Although the diagnosis of sarcopenia is essential for clinical management, it is not feasible in routine clinical practice for populations undergoing haemodialysis because it is time‐consuming and resources are limited. Serum creatinine levels in patients with ESRD have been gaining attention as a screening parameter for sarcopenia because serum creatinine is a routinely measured byproduct of skeletal muscle metabolism. This study aimed to evaluate the discriminative ability of the creatinine‐derived index for sarcopenia in patients undergoing haemodialysis.
Methods
We diagnosed sarcopenia according to the Asian Working Group for Sarcopenia (AWGS) 2 criteria in 356 clinically stable outpatients with ESRD enrolled from three dialysis facilities. We adopted the modified creatinine index as a simplified discriminant parameter for sarcopenia in addition to the calf circumference, SARC‐F score, and combination of both (i.e. SARC‐CalF score), which are recommended by the AWGS. Receiver operating characteristic analysis and logistic regression analysis were conducted to evaluate the discriminative ability of the modified creatinine index for sarcopenia.
Results
Of the study participants, 142 (39.9%) were diagnosed with sarcopenia. The areas under the curve of the modified creatinine index against sarcopenia in the male and female participants were 0.77 (95% confidence interval [CI]: 0.71 to 0.83) and 0.77 (95% CI: 0.69 to 0.85), respectively. All simplified discriminant parameters were significantly associated with sarcopenia, even after adjusting for patient characteristics and centre. In the comparison of the odds ratios for sarcopenia for 1‐standard deviation change in the simplified discriminant parameters, the odds ratio of the modified creatinine index was 1.92 (95% CI: 1.15 to 3.19), which was lower than that of the calf circumference (odds ratio: 6.58, 95% CI: 3.32 to 13.0) and similar to that of the SARC‐F (odds ratio: 1.57, 95% CI: 1.14 to 2.16) and SARC‐CalF scores (odds ratio: 2.36, 95% CI: 1.60 to 3.47).
Conclusions
This study revealed a strong association between the creatinine‐derived index and sarcopenia in patients undergoing haemodialysis. The modified creatinine index was equal or superior to those of SARC‐F and SARC‐CalF score in discriminability for sarcopenia. However, the ability of the calf circumference to discriminate sarcopenia is extremely high, and further study is needed to determine whether it can be used to detect deterioration of muscle mass and function over time.
Keywords: chronic kidney disease, exercise, physical activity, sarcopenia‐related frailty
1. Introduction
Sarcopenia has been described as a geriatric syndrome characterized by loss of skeletal muscle mass and decreased muscle function and is a serious global public health problem that can lead to various adverse health outcomes. 1 , 2 Patients with end‐stage renal disease (ESRD) are at an increased risk of developing sarcopenia compared with individuals with normal kidney function owing to co‐morbid burden, long‐standing malnutrition, insomnia, metabolic acidosis, anabolic resistance, uremic toxins, proinflammatory cytokines, hormonal changes, dialysis treatment, and physical inactivity in addition to aging. 3 , 4 , 5 , 6 According to a recently performed meta‐analysis, the prevalence rate of sarcopenia in this population was 28.5%, 2 which is extremely high compared with rates ranging from 10% to 14.1% among the general population. 7 , 8 Troublingly, sarcopenia ranges from an asymptomatic illness to a life‐threatening condition, 9 and a silent sarcopenia needs to be identified via objective assessments. The diagnosis of sarcopenia is essential for clinical management and therapeutic decision‐making; however, it is not feasible in routine clinical practice for populations undergoing haemodialysis because it is time‐consuming and resources are limited. Hence, an assessment tool that can be used conveniently, objectively, and rapidly in clinical practice to screen for sarcopenia in patients undergoing haemodialysis whose physical conditions are dramatically altered, even for a short period, is needed.
Serum creatinine levels in patients with ESRD have been gaining attention because serum creatinine is a routinely measured byproduct of skeletal muscle metabolism and is a reliable indicator of an individual's muscle mass and function. Previous studies have reported that the modified creatinine index, 10 which has recently been developed and is calculated using age, sex, pre‐dialysis serum creatinine level, and single‐pool Kt/V for urea, is closely associated with muscle mass measured via bioelectrical impedance analysis (BIA) or dual‐energy X‐ray absorptiometry and muscle strength in patients undergoing haemodialysis. 11 , 12 Despite any studies on the modified creatinine index in recent years, research on its ability to identify sarcopenia remains limited.
This study aimed to evaluate the discriminative ability for sarcopenia of the creatinine index and standardized assessment tools and to identify the cut‐off values in patients who require haemodialysis.
2. Methods
2.1. Study design and participants
Clinically stable outpatients with ESRD were enrolled from three dialysis facilities in Japan between April 2019 and March 2021 and assessed for their eligibility to be included in this cross‐sectional study. Patients over 18 years of age and on haemodialysis at a minimum of three times weekly for at least 3 months were included. Patients who had been hospitalized within 3 months before the study commenced, had recent myocardial infarction or angina pectoris, and had not undergone BIA owing to implanted devices or limb amputation were excluded. Informed consent was obtained in the form of an opt‐out on the boards of each facility; those who did not provide consent were excluded from the study. Prior to data collection, the conduct of the study was announced using a poster, informing that health‐related data of patients by the centre (i.e. information on demographic factors (age, sex, and dialysis vintage), components of sarcopenia, co‐morbid conditions, and laboratory parameters) would be anonymized and provided to the study. Although participants did not provide written or verbal informed consent, they were allowed to refuse or withdraw their participation at any time. This opt‐out procedure conforms to the Japanese Ethical Guidelines for Epidemiological Research for observational studies that use existing data. The study protocol, including the consent procedure (informed consent waiver), was approved by the Ethics Review Board of Hyogo Medical University (approval number: 19026‐3) and conducted in accordance with the principles of the Declaration of Helsinki.
2.2. Patient characteristics
Information on demographic factors (age, sex, and dialysis vintage), physical constitution (body mass index [BMI]), primary kidney diseases, and co‐morbid conditions was collected from medical records at the time physical function was assessed. A co‐morbidity index developed for patients undergoing dialysis and composed of primary ESRD causes, atherosclerotic heart disease, congestive heart failure, cerebrovascular accident/transient ischemic attack, peripheral vascular disease, dysrhythmia, other cardiac diseases, chronic obstructive pulmonary disease, gastrointestinal bleeding, liver disease, cancer, and diabetes was used to quantify co‐morbid illnesses in this study. 13 This index was calculated as previously described and performed well in the analysis of survival in patients undergoing haemodialysis. Data on the following laboratory parameters were extracted from patient hospital charts at the time physical function was assessed: serum creatinine level, single‐pool Kt/V for urea, normalized protein catabolic rate (nPCR = PCR/body weight), serum albumin level and C‐reactive protein level. These were measured at pre‐dialysis on Monday or Tuesday after a lapse of 2‐day from the last dialysis session.
2.3. Diagnosis of sarcopenia
Sarcopenia was diagnosed in accordance with the Asian Working Group for Sarcopenia 2019 (AWGS2) criteria. 1
BIA was performed using the body composition analyser InBody S10, S20, and 770 (InBody Co., Ltd., Seoul, Korea), which is a multifrequency bioimpedance device. Appendicular skeletal muscle mass was used as an index of muscle mass. Furthermore, to adjust for the differences in the physical constitution among the patients, we divided the appendicular skeletal muscle mass by height squared and expressed it as the skeletal muscle index (SMI). The BIA diagnostic criterion for low muscle mass was adopted from that of the AWGS2: SMI of <7.0 kg/m2 for men and <5.7 kg/m2 for women. 1
Handgrip strength was measured twice on each side using a digital dynamometer (TKK 5101 Grip‐D; Takei, Tokyo, Japan) according to a standard protocol. 1 Maximal isometric voluntary contractions of the hands for 3 s each were assessed 2‐trial with the patients in the standing position and full elbow extension, and the highest value was used in the analyses. We permitted sitting for patients who were unable to stand unassisted. 1 We used low muscle strength diagnostic cut‐off points of handgrip of <28.0 kg for men and <18.0 kg for women.
The gait speed, five‐time chair stand time, and short physical performance battery (SPPB) were used for the evaluation of physical performance. To test the gait speed, we measured the time taken to walk 4 m at a normal pace from a moving start without deceleration, 14 taking the average result of two trials. The velocity was converted to meters per second. To test the ability to rise from a chair, we asked the patients to fold their arms across their chest and stand up once from a chair. When successful, they were asked to stand up and sit down five times as rapidly as possible and were timed from the initial sitting position to the final standing position at the end of the fifth stand. The SPPB, which consists of three components (i.e. gait speed, repeated chair stands, and standing balance), was measured using established methods. 14 The patients with a gait speed of <1.0 m/s, a five‐time chair stand time of ≥12 s, or an SPPB score of ≤9 were identified as having low physical performance.
Sarcopenia was diagnosed when patients had low muscle mass and low muscle strength or low physical performance, while severe sarcopenia was diagnosed when all three muscle abnormalities were present, following the AWGS2 criteria. However, because of the small sample size of our study, sarcopenia and severe sarcopenia were pooled together in this study (hereafter referred to as sarcopenia).
2.4. Simplified discriminant parameters for sarcopenia
The calf circumference was measured using a non‐elastic tape at the point of the largest circumference. Both legs were measured, and the maximum value for both calves was adopted.
The patients were asked to complete the SARC‐F questionnaire at the time of the physical performance evaluation. The SARC‐F is a self‐administered questionnaire, which has five components, including strength, assistance in walking, rising from a chair, climbing stairs, and falls, with a three‐level score ranging from 0 to 2 points for each item. 15
The SARC‐CalF score is composed of the calf circumference and SARC‐F score. The calf circumferences recommended by the AWGS2 according to sex (≤34 cm for men and ≤33 cm for women) were adopted as the cut‐off points. In addition, the score attributed to the reduced calf circumference at the aforementioned cut‐off points was 10 points, and the participants with a normal calf circumference received 0 points for this component. The first 5 items were scored the same as the standard SARC‐F. The total possible score ranged from 0 to 20 points, which was obtained by summing the score assigned to each of the six components. 16 Details of the two scales are shown in Table S1.
In addition to the calf circumference, SARC‐F score, and SARC‐CalF score, which are recommended by the AWGS2 as screening tools for sarcopenia, 1 this study employed the modified creatinine index, a disease‐specific measure identifying low muscle mass and poor physical function in patients undergoing haemodialysis. 11 , 12 Based on the methods used in a previous study, 11 the modified creatinine index was calculated in the same week when the baseline assessment of sarcopenia was performed using the following formula:
Modified creatinine index (mg/kg/day) = 16.21 + 1.12 × [1 for men; 0 for women] − 0.06 × age (year) − 0.08 × single‐pool Kt/V urea + 0.009 × serum creatinine level before dialysis (mmol/L).
2.5. Statistical analysis
Data are expressed as means ± standard deviations (SDs) or medians with interquartile ranges for continuous variables and as numbers and percentages for categorical variables. The patients were classified into two groups according to the derived cut‐off points of modified creatinine index. The patient characteristics were compared between the groups using an unpaired t test or the Mann–Whitney U test for continuous variables and the χ 2 test for categorical variables. Additionally, we compared the characteristics between patients with and without sarcopenia. The sarcopenia morbidity rates were calculated by age, sex, and dialysis vintage. To calculate the areas under the curve (AUCs) and cut‐off points of the simplified discriminant parameters for the presence of sarcopenia, we performed receiver operating characteristic (ROC) curve analysis separately for the men and women. Additionally, we compared the AUCs between patients with residual renal function or not as a subgroup analysis. We used the Youden index 17 to determine the sex‐specific cut‐off points for sarcopenia; this index is used as a measure of the overall combined specificity and sensitivity of a factor, defined as the maximum vertical distance between the ROC curve and the diagonal of the chance line, and calculated as follows: maximum [sensitivity + specificity − 1]. The best Youden index was used to determine the best cut‐off point of the simplified discriminant parameters in this study. We calculated sensitivity, specificity, positive predictive value, negative predictive value, and diagnostic accuracy based on the AWGS2 cut‐off and the derived cut‐off. Cohen's kappa statistics were used to compare discriminative ability for sarcopenia between the different simplified discriminant parameters. Cohen's kappa statistics represent the degree of agreement over and above that expected by chance, and it has been suggested that a kappa value of <0.2 represents poor agreement; 0.21 to 0.4, fair agreement; 0.41 to 0.60, moderate agreement; 0.61 to 0.80, good agreement; and 0.81 to 1.00, excellent agreement. 18 Nonlinear associations between the modified creatinine index and sarcopenia were modelled using a restricted cubic spline with three knots. To evaluate the association of the modified creatinine index and the other discriminant parameters with sarcopenia, with an adjustment for potential confounders, including age, sex, BMI, dialysis vintage, co‐morbidity index, serum albumin level, significant diuresis and/or residual renal function, and centre, we conducted univariate and multivariate logistic regression analyses. The odds ratios per 1‐point change and 1‐SD change and 95% confidence intervals (CIs) were calculated. The statistical analyses were performed using EZR version 1.5.1 (R Foundation for Statistical Computing, Vienna, Austria) and Stata version 16.1 (Stata Corp LLC, College Station, TX, USA). In all analyses, P‐values of ≤0.05 were used to determine statistical significance.
3. Results
3.1. Characteristics of the participants
We excluded 31 patients who failed to satisfy the inclusion criteria and 27 patients who had no data on the calf circumference; therefore, 356 patients were finally included in the analyses. The baseline patient characteristics, muscle strength, physical performance, muscle mass, and simplified discriminant parameters, including those of the group stratified according to the derived cut‐off points of modified creatinine index 21.3 mg/kg/day for the male patients and 18.8 mg/kg/day for the female patients, are summarized in Tables 1 and 2. The median age of the participants was 71.3 [62.0, 78.3] years, and 36.2% were female. The median dialysis vintage was 57.0 [22.8, 140.0] months. The most common underlying kidney disease in the study patients was diabetes mellitus (35.4%), and the next most common was glomerulonephritis/cystic kidney disease (25.8%). Serum albumin ranged from 2.3 to 4.7 g/dL in the study population, and only 0.3% of the patients had with serum albumin <2.5 g/dL. The patients in the lower group were significantly older than those in the higher group (P < 0.001). The co‐morbidity score in the lower group was significantly higher than that in the other group (P < 0.001). Significant diuresis and/or residual renal function did not significantly differ between group. All of muscle strength, physical performance, muscle mass, and simplified discriminant parameters in the lower group were significantly worse than those in the higher group (P < 0.001, respectively). In addition, we showed the patient data stratified according to the presence of sarcopenia in Tables S2 and S3. Figure 1 shows the proportion of patients with sarcopenia; 142 patients (39.9%) were diagnosed with sarcopenia. The prevalence rate of sarcopenia in the women and men was 39.5% and 40.1%, respectively, and one in two patients had sarcopenia among those aged 65 years and older (52.8%).
Table 1.
Patient characteristics
| Characteristics | Overall (n = 356) | Modified creatinine index a | P‐value | |
|---|---|---|---|---|
| Lower (n = 167) | Higher (n = 189) | |||
| Age (year) | 71.3 [62.0, 78.3] | 77.6 [71.6, 82.6] | 64.4 [54.0, 71.6] | <0.001 |
| Sex (female) | 129 (36.2) | 58 (34.7) | 71 (37.6) | 0.583 |
| Body mass index (kg/m2) | 21.9 [19.5, 24.9] | 21.6 [18.9, 24.1] | 22.5 [20.1, 25.8] | 0.004 |
| Dialysis vintage (month) | 57.0 [22.8, 140.0] | 40.0 [17.0, 98.0] | 82.0 [35.0, 178.0] | <0.001 |
| Primary ESRD cause | 0.002 | |||
| Glomerulonephritis/cystic kidney disease | 92 (25.8) | 30 (18.0) | 62 (32.8) | |
| Diabetes | 126 (35.4) | 68 (40.7) | 58 (30.7) | |
| Hypertension | 58 (16.3) | 35 (21.0) | 23 (12.2) | |
| Other | 80 (22.5) | 34 (20.3) | 46 (24.3) | |
| Co‐morbid conditions | ||||
| Arteriosclerotic heart disease | 95 (26.7) | 56 (33.5) | 39 (20.6) | 0.008 |
| Congestive heart failure | 41 (11.5) | 21 (12.6) | 20 (10.6) | 0.619 |
| Cerebrovascular accident/transit ischemic attack | 88 (24.7) | 44 (26.3) | 44 (23.3) | 0.539 |
| Peripheral vascular disease | 94 (26.4) | 48 (28.7) | 46 (24.3) | 0.399 |
| Other cardiac disease | 84 (23.6) | 33 (19.8) | 51 (27.0) | 0.133 |
| Chronic obstructive pulmonary disease | 28 (7.9) | 15 (9.0) | 13 (6.9) | 0.555 |
| Gastrointestinal bleeding | 62 (17.4) | 33 (19.8) | 29 (15.3) | 0.327 |
| Liver disease | 30 (8.4) | 20 (12.0) | 10 (5.3) | 0.034 |
| Dysrhythmia | 59 (16.6) | 28 (16.8) | 31 (16.4) | 1 |
| Cancer | 102 (28.7) | 57 (34.1) | 45 (23.8) | 0.035 |
| Diabetes | 163 (45.8) | 91 (54.5) | 72 (38.1) | 0.002 |
| Co‐morbidity score (point) | 6 [4, 8] | 7 [5, 8.5] | 5 [4, 7] | <0.001 |
| Serum creatinine level (mg/dL) | 10.0 ± 2.7 | 8.0 ± 1.7 | 11.8 ± 2.1 | <0.001 |
| Single‐pool Kt/V for urea | 1.3 [1.1, 1.6] | 1.3 [1.1, 1.6] | 1.3 [1.1, 1.6] | 0.639 |
| nPCR (g/kg/day) | 0.9 [0.7, 1.0] | 0.8 [0.7, 0.9] | 0.9 [0.8, 1.0] | <0.001 |
| Serum albumin level (g/dL) | 3.7 [3.5, 3.9] | 3.6 [3.5, 3.8] | 3.7 [3.6, 3.9] | <0.001 |
| C‐reactive protein level (mg/dL) | 0.15 [0.06, 0.50] | 0.14 [0.06, 0.41] | 0.18 [0.08, 0.50] | 0.506 |
| Significant diuresis and/or residual renal function | 143 (40.2) | 71 (42.5) | 72 (38.1) | 0.448 |
Note: Median (25th–75th percentile), n (%), or mean ± standard deviation.
Abbreviations: ESRD, end‐stage renal disease; nPCR, normalized protein catabolic rate.
Patients were classified according to the derived cut‐off points of modified creatinine index 21.3 mg/kg/day for the male patients and 18.8 mg/kg/day for the female patients.
Table 2.
Muscle strength, physical performance, muscle mass, and simplified discriminant parameters
| Characteristics | Overall (n = 356) | Modified creatinine index a | P‐value | |
|---|---|---|---|---|
| Lower (n = 167) | Higher (n = 189) | |||
| Muscle strength | ||||
| Handgrip strength (kg) | 23.6 [18.0, 29.6] | 20.9 [16.8, 27.3] | 26.4 [20.7, 32.9] | <0.001 |
| Physical performance | ||||
| Gait speed (m/s) | 1.0 [0.8, 1.2] | 0.9 [0.7, 1.1] | 1.1 [0.7, 1.3] | <0.001 |
| Five‐time chair stand time (s) | 9.5 [7.7, 12.0] | 10.7 [8.7, 13.5] | 8.6 [7.3, 10.7] | <0.001 |
| Short physical performance battery score | 12 [10, 12] | 11 [9, 12] | 12 [11, 12] | <0.001 |
| Appendicular skeletal muscle mass | ||||
| Skeletal mass index (kg/m2) | 6.6 ± 1.2 | 6.2 ± 1.2 | 7.1 ± 1.2 | <0.001 |
| Simplified discriminant parameters | ||||
| SARC‐F score | 1 [0, 3] | 2 [1, 4] | 1 [0, 3] | <0.001 |
| Calf circumference (cm) | 33.2 [30.8, 36.0] | 32.0 [29.8, 34.5] | 34.6 [32.0, 37.3] | <0.001 |
| SARC‐CalF score | 10 [1, 12] | 11 [3, 14] | 3 [0, 11] | <0.001 |
| Modified creatinine index (mg/kg/day) | 20.3 [18.7, 22.6] | 18.6 [17.7, 20.0] | 22.3 [21.0, 23.7] | <0.001 |
Note: Median (25th–75th percentile), n (%), or mean ± standard deviation.
Patients were classified according to the derived cut‐off points of modified creatinine index 21.3 mg/kg/day for the male patients and 18.8 mg/kg/day for the female patients.
Figure 1.

Prevalence rate of sarcopenia in the 356 patients undergoing haemodialysis.
3.2. Sex‐specific cut‐off points and accuracy of the simplified discriminant parameters against sarcopenia
The ROC curves for the performance of the simplified discriminant parameters for sarcopenia are shown in Figure 2. The AUC of calf circumference, SARC‐F, SARC‐Calf, and modified creatinine index against sarcopenia was 0.88 (95% CI: 0.83 to 0.92), 0.69 (95% CI: 0.62 to 0.76), 0.84 (95% CI: 0.78 to 0.89), and 0.77 (95% CI: 0.71 to 0.83) in the male patients and were 0.87 (95% CI: 0.81 to 0.93), 0.70 (95% CI: 0.61 to 0.79), 0.83 (95% CI: 0.75 to 0.90), and 0.77 (95% CI: 0.69 to 0.85) in the female patients, respectively. Although discrimination ability of modified creatinine index for sarcopenia was inferior to those of calf circumference and SARC‐Calf, it was superior to that of SARC‐F. The cut‐off points for the modified creatinine index identifying those with sarcopenia based on the Youden index were 21.3 mg/kg/day for the male patients and 18.8 mg/kg/day for the female patients. In the subgroup analysis according to the presence or absence of residual renal function, AUC in patients with residual renal function was lower than that of the other, but not to the point of statistical significance (0.70 [95% CI: 0.61 to 0.78] vs. 0.79 [95% CI: 0.73 to 0.85], P = 0.10).
Figure 2.
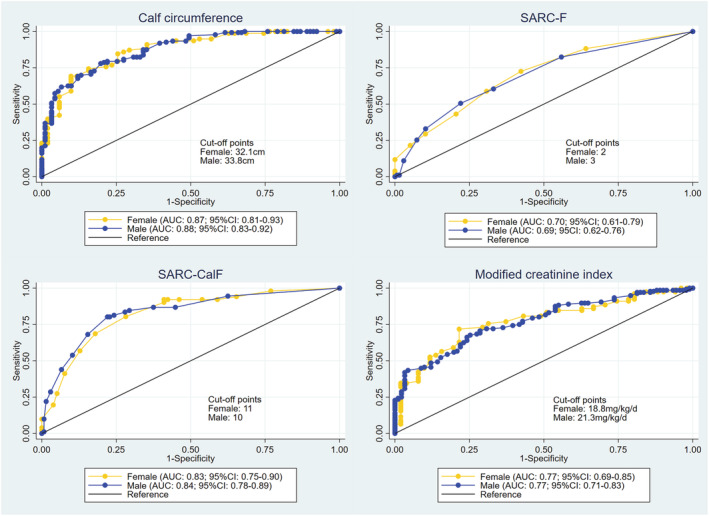
ROC curves of the simplified discriminant parameters against sarcopenia. AUC, area under the curve; CI, confidence interval; ROC, receiver operating characteristic.
A Cohen's kappa value was 0.41 (95% CI: 0.32 to 0.51) indicating moderate agreement between modified creatinine index and diagnosis of sarcopenia based on the AWGS2 criteria (Table 3). Although calf circumference (kappa value, 0.56; 95% CI: 0.47 to 0.64) and SARC‐Calf (kappa value, 0.54; 95% CI: 0.46 to 0.63) also showed moderate agreement to the AWGS2 criteria, SARC‐F showed fair agreement (kappa value, 0.29; 95% CI: 0.19 to 0.39) (Table 3). Diagnostic accuracy of calf circumference, SARC‐F, SARC‐Calf, and modified creatinine index was 0.781, 0.657, 0.775 and 0.711, respectively (Table 3).
Table 3.
Kappa coefficient and diagnostic accuracy of simplified discriminant parameters
| Cut‐off | Discriminant parameters | Subjects | Kappa coefficient (95% CI) | Sensitivity | Specificity | PPV | NPV | Diagnostic accuracy |
|---|---|---|---|---|---|---|---|---|
| The AWGS cut‐off points | Calf circumference | All | 0.52 (0.44–0.61) | 0.838 | 0.710 | 0.657 | 0.869 | 0.761 |
| Female | 0.45 (0.30–0.60) | 0.902 | 0.590 | 0.590 | 0.902 | 0.713 | ||
| Male | 0.57 (0.46–0.68) | 0.802 | 0.779 | 0.709 | 0.855 | 0.789 | ||
| SARC‐F score | All | 0.24 (0.13–0.35) | 0.366 | 0.860 | 0.634 | 0.672 | 0.663 | |
| Female | 0.24 (0.06–0.42) | 0.431 | 0.795 | 0.579 | 0.681 | 0.651 | ||
| Male | 0.25 (0.11–0.39) | 0.330 | 0.897 | 0.682 | 0.667 | 0.670 | ||
| SARC‐CalF score | All | 0.52 (0.43–0.61) | 0.725 | 0.799 | 0.705 | 0.814 | 0.770 | |
| Female | 0.50 (0.35–0.65) | 0.804 | 0.718 | 0.651 | 0.848 | 0.752 | ||
| Male | 0.53 (0.42–0.65) | 0.681 | 0.846 | 0.747 | 0.799 | 0.780 | ||
| Derived cut‐off points | Calf circumference | All | 0.56 (0.47–0.64) | 0.824 | 0.752 | 0.688 | 0.866 | 0.781 |
| Female | 0.54 (0.40–0.69) | 0.882 | 0.692 | 0.652 | 0.900 | 0.767 | ||
| Male | 0.57 (0.46–0.68) | 0.791 | 0.787 | 0.713 | 0.849 | 0.789 | ||
| SARC‐F score | All | 0.29 (0.19–0.39) | 0.585 | 0.706 | 0.568 | 0.719 | 0.657 | |
| Female | 0.28 (0.12–0.45) | 0.725 | 0.577 | 0.529 | 0.763 | 0.636 | ||
| Male | 0.29 (0.16–0.42) | 0.505 | 0.779 | 0.605 | 0.702 | 0.670 | ||
| SARC‐CalF score | All | 0.54 (0.46–0.63) | 0.803 | 0.757 | 0.687 | 0.853 | 0.775 | |
| Female | 0.50 (0.35–0.65) | 0.804 | 0.718 | 0.651 | 0.848 | 0.752 | ||
| Male | 0.57 (0.46–0.68) | 0.802 | 0.779 | 0.709 | 0.855 | 0.789 | ||
| Modified creatinine index | All | 0.41 (0.32–0.51) | 0.725 | 0.701 | 0.617 | 0.794 | 0.711 | |
| Female | 0.45 (0.29–0.60) | 0.725 | 0.731 | 0.638 | 0.803 | 0.729 | ||
| Male | 0.40 (0.28–0.52) | 0.725 | 0.684 | 0.606 | 0.788 | 0.700 |
Note: CI, confidence interval; PPV, positive predictive value; NPV, negative predictive value.
3.3. Association of the simplified discriminant parameters with sarcopenia
The results of the univariate and multivariate logistic regression analyses are presented in Table 4. All simplified discriminant parameters were significantly associated with sarcopenia, even after adjustments for age, sex, BMI, dialysis vintage, co‐morbidity index, serum albumin level, significant diuresis and/or residual renal function, and centre. In the comparison of the odds ratios for sarcopenia for 1‐SD change in the simplified discriminant parameters, the odds ratio became higher in order of the calf circumference (odds ratio: 6.58, 95% CI: 3.32 to 13.0), SARC‐CalF score (odds ratio: 2.36, 95% CI: 1.60 to 3.47), modified creatinine index (odds ratio: 1.92, 95% CI: 1.15 to 3.19), and SARC‐F score (odds ratio: 1.57, 95% CI: 1.14 to 2.16). In the multivariate‐adjusted cubic spline analysis evaluating sarcopenia using the modified creatinine index as a continuous variable, a decrease in the modified creatinine index was associated with increased odds of having sarcopenia (Figure 3).
Table 4.
Associations between the simplified discriminant parameters and sarcopenia in the multivariate logistic regression models
| Crude model | Adjusted model 1 | Adjusted model 2 | |||||||
|---|---|---|---|---|---|---|---|---|---|
| OR | 95% CI | P‐value | OR | 95% CI | P‐value | OR | 95% CI | P‐value | |
| 1‐point change | |||||||||
| Calf circumference (per 1‐cm decrease) | 1.66 | 1.49–1.85 | <0.001 | 1.61 | 1.37–1.89 | <0.001 | 1.61 | 1.35–1.91 | <0.001 |
| SARC‐F score (per 1‐point decrease) | 1.42 | 1.26–1.59 | <0.001 | 1.26 | 1.09–1.46 | 0.002 | 1.24 | 1.07–1.45 | 0.0053 |
| SARC‐CalF score (per 1‐point increase) | 1.27 | 1.21–1.34 | <0.001 | 1.16 | 1.09–1.23 | <0.001 | 1.15 | 1.08–1.23 | <0.001 |
| Creatinine index (per 1‐mg/kg/day decrease) | 1.45 | 1.3–1.6 | <0.001 | 1.25 | 1.05–1.49 | 0.014 | 1.27 | 1.06–1.53 | 0.011 |
| 1‐SD change | |||||||||
| Calf circumference (per 1‐SD decrease) | 7.47 | 4.83–11.5 | <0.001 | 6.66 | 3.52–12.6 | <0.001 | 6.58 | 3.32–13.0 | <0.001 |
| SARC‐F score (per 1‐SD increase) | 2.05 | 1.62–2.6 | <0.001 | 1.61 | 1.19–2.19 | 0.002 | 1.57 | 1.14–2.16 | 0.0053 |
| SARC‐CalF score (per 1‐SD increase) | 4.18 | 3.11–5.61 | <0.001 | 2.38 | 1.65–3.42 | <0.001 | 2.36 | 1.60–3.47 | <0.001 |
| Creatinine index (per 1‐SD decrease) | 2.75 | 2.07–3.67 | <0.001 | 1.83 | 1.13–2.96 | 0.015 | 1.92 | 1.15–3.19 | 0.012 |
Note: Crude model: not adjusted for any variable. Adjusted model 1: adjusted for age, sex, body mass index, and dialysis vintage. Adjusted model 2: adjusted for age, sex, body mass index, dialysis vintage, co‐morbidity index, serum albumin level, diuretic, and centre.
Abbreviations: CI, confidence interval; OR, odds ratio; SD, standard deviation.
Figure 3.

Restricted cubic spline curves of the odds ratio for sarcopenia according to (A) the calf circumference, (B) SARC‐F score, (C) SARC‐CalF score, (D) creatinine index, and outcomes.
4. Discussion
In this cross‐sectional multicentre study, we examined the discriminative ability of the modified creatinine index and standardized assessment tools for sarcopenia among patients undergoing haemodialysis. Our study findings demonstrated that the cut‐off points for the modified creatinine index identifying those with sarcopenia were 21.3 mg/kg/day for the male patients and 18.8 mg/kg/day for the female patients and the modified creatinine index was strongly associated with sarcopenia in patients undergoing haemodialysis, even after adjustments for demographic factors, physical constitution, primary kidney diseases, co‐morbid conditions, nutritional status, remaining renal function, and centre. Although the modified creatinine index was less discriminating than the calf circumference, the discriminative power of the modified creatinine index was moderate and similar to that of the SARC‐F and SARC‐CalF scores. To our knowledge, this is the first study showing the relationship between simplified, standardized discriminant parameters in combination with the modified creatinine index and sarcopenia, which was defined in accordance with the AWGS2 criteria in patients who require haemodialysis. Based on our findings, the modified creatinine index is suitable for risk stratification of sarcopenia because it is an objective indicator excluding various biases of not only patients but also evaluators and is calculated using only the values obtained in routine clinical practice.
According to previous studies, the prevalence rate of sarcopenia is increasing owing to the aging population worldwide. The prevalence rate ranges from 10.0% to 14.1% among community‐dwelling older adults. 7 , 8 Meanwhile, the prevalence rate of sarcopenia was 39.9% in our study participants with ESRD, which is comparable with that of patients undergoing haemodialysis 3 , 19 , 20 , 21 or older adults living in nursing homes 22 previously reported and obviously higher than that of community‐dwelling older adults. This study is the first multicentre study to investigate the prevalence rate of sarcopenia using the AWGS2 criteria in an Asian population and in most patients undergoing haemodialysis. It emphasizes the importance of the management of sarcopenia and the necessity to develop an assessment tool that can be used conveniently, objectively, and rapidly in routine clinical care for individuals undergoing haemodialysis.
We compared the discriminative ability of the modified creatinine index and the standardized assessment instruments for sarcopenia in patients undergoing haemodialysis and found that the calf circumference showed the highest discriminative power. This finding is consistent with the results of a previous study that investigated the clinical efficacy of the calf circumference in individuals with normal kidney function. 23 We were sceptical of the use of the calf circumference in detecting sarcopenia in patients with ESRD before the study because of oedema from malnutrition, consumption of excess salt, and co‐morbidities. 24 , 25 , 26 In our study, clinically stable outpatients who were undergoing haemodialysis at least three times per a week regularly and were without severe malnutrition and severe cardiovascular co‐morbidities developing oedema were enrolled, and the measurers were physical therapists who had received sufficient training; we believe that these study conditions addressed the concerns regarding the use of the calf circumference in detecting sarcopenia in patients requiring haemodialysis. However, data on the association between the calf circumference trajectory and risk of sarcopenia in these patient populations are limited, and further studies are needed to evaluate the calf circumference as an index of weekly or monthly monitoring in terms of reliability and human resources. SARC‐F questionnaire is a widely used initial screening tool for sarcopenia and recommended by the AWGS and the European Working Group on Sarcopenia in Older People. 27 SARC‐F is suited for a rapid screening for sarcopenia in the setting like a community‐based large‐scale survey, and it was reported the significant association of higher score of SARC‐F with impaired physical function 28 and higher mortality risk 29 in the previous studies. However, recent studies treated with patients on dialysis therapy represented a poor association between SARC‐F score and skeletal muscle mass 30 and inadequate accuracy of SARC‐F for discriminating sarcopenia, which was defined using the AWGS2 criteria. 9 , 30 Our findings agree with those of these studies.
Creatinine excretion is well known in previous studies as a measure of muscle metabolism in individuals without chronic kidney disease. 31 Meanwhile, the serum creatinine level is positively associated with muscle mass in patients with extremely impaired renal excretion. 32 Canaud et al. developed an index named the modified creatinine index using the serum creatinine level after taking the effects of age, sex, and single‐pool Kt/V for urea into consideration. 10 This index is easy to apply in clinical practice among patients undergoing haemodialysis, because only routinely gathered data are needed to calculate it, and longitudinal trends can be tracked without any difficulties; this parameter is associated with not only physical functions, such as muscle strength and walking ability, 12 , 33 but also life expectancy. The creatinine index has been reported to decline 6 months before death, potentially serving as an early warning sign. 11 A lower creatinine index was significantly associated with a higher likelihood of adverse health outcomes after adjusting for demographic characteristics, co‐morbidities, and laboratory values 12 ; deterioration in lean body mass as defined using the creatinine index over a 1‐year period was also associated with a poor prognosis among patients receiving haemodialysis. 34 Adding the assessments of the creatinine index into routine clinical care will be a valuable option for not only diagnosing sarcopenia but also improving the prognostic stratification in patients who require haemodialysis. On the other hand, it is known that serum creatinine levels are affected by residual renal function in patients undergoing haemodialysis. 35 As our subgroup analysis showed, discriminative power of the creatinine index for sarcopenia decreased in the patients with residual renal function than the other although not to the point of statistical significance. In addition to this, serum creatinine levels also fluctuate according to period of blood sampling and amount of protein intake. 36 Although we standardized the period of blood sampling in all the study participants, we unfortunately were not able to collect data on the content of meals.
Our study has several limitations. First, this study was limited to Japanese patients receiving haemodialysis, thereby limiting the generalizability of our findings to broader international populations. Therefore, further large‐scale studies are required. Second, our study employed a cross‐sectional design, and the assessments were implemented only at the study entry. We need to consider the fluctuations in the simplified discriminant parameters for sarcopenia over time. Third, although the creatinine‐derived index is affected by day‐to‐day dietary protein intake, 37 we did not collect data on meal content. Finally, the modified creatinine index is affected by residual renal function. 38 However, because we did not collect data on the daily urine volume, we are not certain that we completely accounted for the effect of residual renal function in our analysis.
In conclusion, our study revealed a strong association between the creatinine‐derived index and sarcopenia in patients undergoing haemodialysis. Although the modified creatinine index was inferior to calf circumference in discriminability for sarcopenia, it was equal or superior to those of SARC‐F and SARC‐CalF score. Given the good accessibility of modified creatinine index in routine clinical practice, it could be considered as a potential alternative tool for discriminating sarcopenia in patients undergoing haemodialysis. Meanwhile, the discriminative ability of the calf circumference for sarcopenia was extremely high, and further study is needed to determine whether it can be used to detect the trajectory of muscle mass and function over time.
Funding
This work was supported by research funding from Hyogo University of Health Sciences, Japan (RM), Hyogo Medical University Graduate School of Health Science, Japan (RM) and the JSPS KAKENHI 20K19332, Japan (RM).
Conflicts of interest
The authors declare no conflict of interest.
Supporting information
Table S1. Supporting Information
Table S2. Patient characteristics stratified according to the presence of sarcopenia
Table S3. Muscle strength, physical performance, muscle mass, and simplified discriminant parameters stratified according to the presence of sarcopenia
Acknowledgements
The authors wish to express appreciation to the physicians, nurses, and healthcare providers for all the time and attention they have devoted to our study. The authors certify that they comply with the ethical guidelines for authorship and publishing in the Journal of Cachexia, Sarcopenia and Muscle. 39
Kakita D., Matsuzawa R., Yamamoto S., Suzuki Y., Harada M., Imamura K., Yoshikoshi S., Imai H., Osada S., Shimokado K., Matsunaga A., and Tamaki A. (2022) Simplified discriminant parameters for sarcopenia among patients undergoing haemodialysis, Journal of Cachexia, Sarcopenia and Muscle, 13, 2898–2907, doi: 10.1002/jcsm.13078
Contributor Information
Daisuke Kakita, Email: mhe2104@std.huhs.ac.jp.
Ryota Matsuzawa, Email: ryota122560@gmail.com.
References
- 1. Chen LK, Woo J, Assantachai P, Auyeung TW, Chou MY, Iijima K, et al. Asian Working Group for Sarcopenia: 2019 Consensus Update on Sarcopenia Diagnosis and Treatment. J Am Med Dir Assoc 2020;21:300–7.e2. [DOI] [PubMed] [Google Scholar]
- 2. Shu X, Lin T, Wang H, Zhao Y, Jiang T, Peng X, et al. Diagnosis, prevalence, and mortality of sarcopenia in dialysis patients: a systematic review and meta‐analysis. J Cachexia Sarcopenia Muscle 2022;13:145–158. [DOI] [PMC free article] [PubMed] [Google Scholar]
- 3. Kim JK, Choi SR, Choi MJ, Kim SG, Lee YK, Noh JW, et al. Prevalence of and factors associated with sarcopenia in elderly patients with end‐stage renal disease. Clin Nutr 2014;33:64–68. [DOI] [PubMed] [Google Scholar]
- 4. Vettoretti S, Caldiroli L, Armelloni S, Ferrari C, Cesari M, Messa P. Sarcopenia is Associated with Malnutrition but Not with Systemic Inflammation in Older Persons with Advanced CKD. Nutrients 2019;11. 10.3390/nu11061378 [DOI] [PMC free article] [PubMed] [Google Scholar]
- 5. Hendriks FK, Smeets JSJ, van der Sande FM, Kooman JP, van Loon LJC. Dietary Protein and Physical Activity Interventions to Support Muscle Maintenance in End‐Stage Renal Disease Patients on Hemodialysis. Nutrients 2019;11. 10.3390/nu11122972 [DOI] [PMC free article] [PubMed] [Google Scholar]
- 6. Kim JC, Shapiro BB, Zhang M, Li Y, Porszasz J, Bross R, et al. Daily physical activity and physical function in adult maintenance hemodialysis patients. J Cachexia Sarcopenia Muscle 2014;5:209–220. [DOI] [PMC free article] [PubMed] [Google Scholar]
- 7. Shafiee G, Keshtkar A, Soltani A, Ahadi Z, Larijani B, Heshmat R. Prevalence of sarcopenia in the world: a systematic review and meta‐ analysis of general population studies. J Diabetes Metab Disord 2017;16:21. [DOI] [PMC free article] [PubMed] [Google Scholar]
- 8. Kitamura A, Seino S, Abe T, Nofuji Y, Yokoyama Y, Amano H, et al. Sarcopenia: prevalence, associated factors, and the risk of mortality and disability in Japanese older adults. J Cachexia Sarcopenia Muscle 2021;12:30–38. [DOI] [PMC free article] [PubMed] [Google Scholar]
- 9. Imamura K, Yamamoto S, Suzuki Y, Matsuzawa R, Harada M, Yoshikoshi S, et al. Limitations of SARC‐F as a Screening Tool for Sarcopenia in Patients on Hemodialysis. Nephron 2022;146:32–39. [DOI] [PMC free article] [PubMed] [Google Scholar]
- 10. Canaud B, Granger Vallée A, Molinari N, Chenine L, Leray‐Moragues H, Rodriguez A, et al. Creatinine index as a surrogate of lean body mass derived from urea Kt/V, pre‐dialysis serum levels and anthropometric characteristics of haemodialysis patients. PLoS One 2014;9:e93286. [DOI] [PMC free article] [PubMed] [Google Scholar]
- 11. Canaud B, Ye X, Usvyat L, Kooman J, van der Sande F, Raimann J, et al. Clinical and predictive value of simplified creatinine index used as muscle mass surrogate in end‐stage kidney disease haemodialysis patients‐results from the international MONitoring Dialysis Outcome initiative. Nephrol Dial Transplant 2020;35:2161–2171. [DOI] [PMC free article] [PubMed] [Google Scholar]
- 12. Yamamoto S, Matsuzawa R, Hoshi K, Suzuki Y, Harada M, Watanabe T, et al. Modified Creatinine Index and Clinical Outcomes of Hemodialysis Patients: An Indicator of Sarcopenia? J Ren Nutr 2021;31:370–379. [DOI] [PubMed] [Google Scholar]
- 13. Liu J, Huang Z, Gilbertson DT, Foley RN, Collins AJ. An improved comorbidity index for outcome analyses among dialysis patients. Kidney Int 2010;77:141–151. [DOI] [PubMed] [Google Scholar]
- 14. Guralnik JM, Ferrucci L, Pieper CF, Leveille SG, Markides KS, Ostir GV, et al. Lower extremity function and subsequent disability: consistency across studies, predictive models, and value of gait speed alone compared with the short physical performance battery. J Gerontol A Biol Sci Med Sci 2000;55:M221–M231. [DOI] [PMC free article] [PubMed] [Google Scholar]
- 15. Malmstrom TK, Morley JE. SARC‐F: a simple questionnaire to rapidly diagnose sarcopenia. J Am Med Dir Assoc 2013;14:531–532. [DOI] [PubMed] [Google Scholar]
- 16. Barbosa‐Silva TG, Menezes AM, Bielemann RM, Malmstrom TK, Gonzalez MC, (COCONUT) GdEeCCeN . Enhancing SARC‐F: Improving Sarcopenia Screening in the Clinical Practice. J Am Med Dir Assoc 2016;17:1136–1141. [DOI] [PubMed] [Google Scholar]
- 17. Perkins NJ, Schisterman EF. The inconsistency of "optimal" cutpoints obtained using two criteria based on the receiver operating characteristic curve. Am J Epidemiol 2006;163:670–675. [DOI] [PMC free article] [PubMed] [Google Scholar]
- 18. Brennan P, Silman A. Statistical methods for assessing observer variability in clinical measures. BMJ 1992;304:1491–1494. [DOI] [PMC free article] [PubMed] [Google Scholar]
- 19. Isoyama N, Qureshi AR, Avesani CM, Lindholm B, Bàràny P, Heimbürger O, et al. Comparative associations of muscle mass and muscle strength with mortality in dialysis patients. Clin J Am Soc Nephrol 2014;9:1720–1728. [DOI] [PMC free article] [PubMed] [Google Scholar]
- 20. Lamarca F, Carrero JJ, Rodrigues JC, Bigogno FG, Fetter RL, Avesani CM. Prevalence of sarcopenia in elderly maintenance hemodialysis patients: the impact of different diagnostic criteria. J Nutr Health Aging 2014;18:710–717. [DOI] [PubMed] [Google Scholar]
- 21. Mori K, Nishide K, Okuno S, Shoji T, Emoto M, Tsuda A, et al. Impact of diabetes on sarcopenia and mortality in patients undergoing hemodialysis. BMC Nephrol 2019;20:105. [DOI] [PMC free article] [PubMed] [Google Scholar]
- 22. Shen Y, Chen J, Chen X, Hou L, Lin X, Yang M. Prevalence and Associated Factors of Sarcopenia in Nursing Home Residents: A Systematic Review and Meta‐analysis. J Am Med Dir Assoc 2019;20:5–13. [DOI] [PubMed] [Google Scholar]
- 23. Kawakami R, Murakami H, Sanada K, Tanaka N, Sawada SS, Tabata I, et al. Calf circumference as a surrogate marker of muscle mass for diagnosing sarcopenia in Japanese men and women. Geriatr Gerontol Int 2015;15:969–976. [DOI] [PubMed] [Google Scholar]
- 24. Flanigan M. Dialysate composition and hemodialysis hypertension. Semin Dial 2004;17:279–283. [DOI] [PubMed] [Google Scholar]
- 25. Agarwal R, Andersen MJ, Pratt JH. On the importance of pedal edema in hemodialysis patients. Clin J Am Soc Nephrol 2008;3:153–158. [DOI] [PMC free article] [PubMed] [Google Scholar]
- 26. Inaba M, Okuno S, Ohno Y. Importance of Considering Malnutrition and Sarcopenia in Order to Improve the QOL of Elderly Hemodialysis Patients in Japan in the Era of 100‐Year Life. Nutrients 2021;13. 10.3390/nu13072377 [DOI] [PMC free article] [PubMed] [Google Scholar]
- 27. Cruz‐Jentoft AJ, Bahat G, Bauer J, Boirie Y, Bruyère O, Cederholm T, et al. Sarcopenia: revised European consensus on definition and diagnosis. Age Ageing 2019;48:16–31. [DOI] [PMC free article] [PubMed] [Google Scholar]
- 28. Malmstrom TK, Miller DK, Simonsick EM, Ferrucci L, Morley JE. SARC‐F: a symptom score to predict persons with sarcopenia at risk for poor functional outcomes. J Cachexia Sarcopenia Muscle 2016;7:28–36. [DOI] [PMC free article] [PubMed] [Google Scholar]
- 29. Wu AH, Setiawan VW, Lim U, Tseng CC, White KK, Shepherd J, et al. Prognostic utility of self‐reported sarcopenia (SARC‐F) in the Multiethnic Cohort. J Cachexia Sarcopenia Muscle 2022;13:987–1002. [DOI] [PMC free article] [PubMed] [Google Scholar]
- 30. Lin YL, Hou JS, Lai YH, Wang CH, Kuo CH, Liou HH, et al. Association of SARC‐F Questionnaire and Mortality in Prevalent Hemodialysis Patients. Diagnostics (Basel) 2020;10. 10.3390/diagnostics10110890 [DOI] [PMC free article] [PubMed] [Google Scholar]
- 31. Baxmann AC, Ahmed MS, Marques NC, Menon VB, Pereira AB, Kirsztajn GM, et al. Influence of muscle mass and physical activity on serum and urinary creatinine and serum cystatin C. Clin J Am Soc Nephrol 2008;3:348–354. [DOI] [PMC free article] [PubMed] [Google Scholar]
- 32. Delgado C, Johansen KL. Revisiting serum creatinine as an indicator of muscle mass and a predictor of mortality among patients on hemodialysis. Nephrol Dial Transplant 2020;35:2033–2035. [DOI] [PMC free article] [PubMed] [Google Scholar]
- 33. Plytzanopoulou P, Politis P, Papachrysanthou T, Andriopoulos C, Drakou A, Papachristou E, et al. Creatinine index as a predictive marker of sarcopenia in patients under hemodialysis. Int Urol Nephrol 2021;54:1565–1573. [DOI] [PubMed] [Google Scholar]
- 34. Suzuki Y, Matsuzawa R, Kamiya K, Hoshi K, Harada M, Watanabe T, et al. Trajectory of Lean Body Mass Assessed Using the Modified Creatinine Index and Mortality in Hemodialysis Patients. Am J Kidney Dis 2020;75:195–203. [DOI] [PubMed] [Google Scholar]
- 35. Walther CP, Carter CW, Low CL, Williams P, Rifkin DE, Steiner RW, et al. Interdialytic creatinine change versus predialysis creatinine as indicators of nutritional status in maintenance hemodialysis. Nephrol Dial Transplant 2012;27:771–776. [DOI] [PMC free article] [PubMed] [Google Scholar]
- 36. Kaysen GA, Chertow GM, Adhikarla R, Young B, Ronco C, Levin NW. Inflammation and dietary protein intake exert competing effects on serum albumin and creatinine in hemodialysis patients. Kidney Int 2001;60:333–340. [DOI] [PubMed] [Google Scholar]
- 37. Ikizler TA, Burrowes JD, Byham‐Gray LD, Campbell KL, Carrero JJ, Chan W, et al. KDOQI Clinical Practice Guideline for Nutrition in CKD: 2020 Update. Am J Kidney Dis 2020;76:S1–S107. [DOI] [PubMed] [Google Scholar]
- 38. Sabatino A, Broers NJH, van der Sande FM, Hemmelder MH, Fiaccadori E, Kooman JP. Estimation of Muscle Mass in the Integrated Assessment of Patients on Hemodialysis. Front Nutr 2021;8:697523. [DOI] [PMC free article] [PubMed] [Google Scholar]
- 39. von Haehling S, Morley JE, Coats AJS, Anker SD. Ethical guidelines for publishing in the Journal of Cachexia, Sarcopenia and Muscle: update 2021. J Cachexia Sarcopenia Muscle 2021;12:2259–2261. [DOI] [PMC free article] [PubMed] [Google Scholar]
Associated Data
This section collects any data citations, data availability statements, or supplementary materials included in this article.
Supplementary Materials
Table S1. Supporting Information
Table S2. Patient characteristics stratified according to the presence of sarcopenia
Table S3. Muscle strength, physical performance, muscle mass, and simplified discriminant parameters stratified according to the presence of sarcopenia