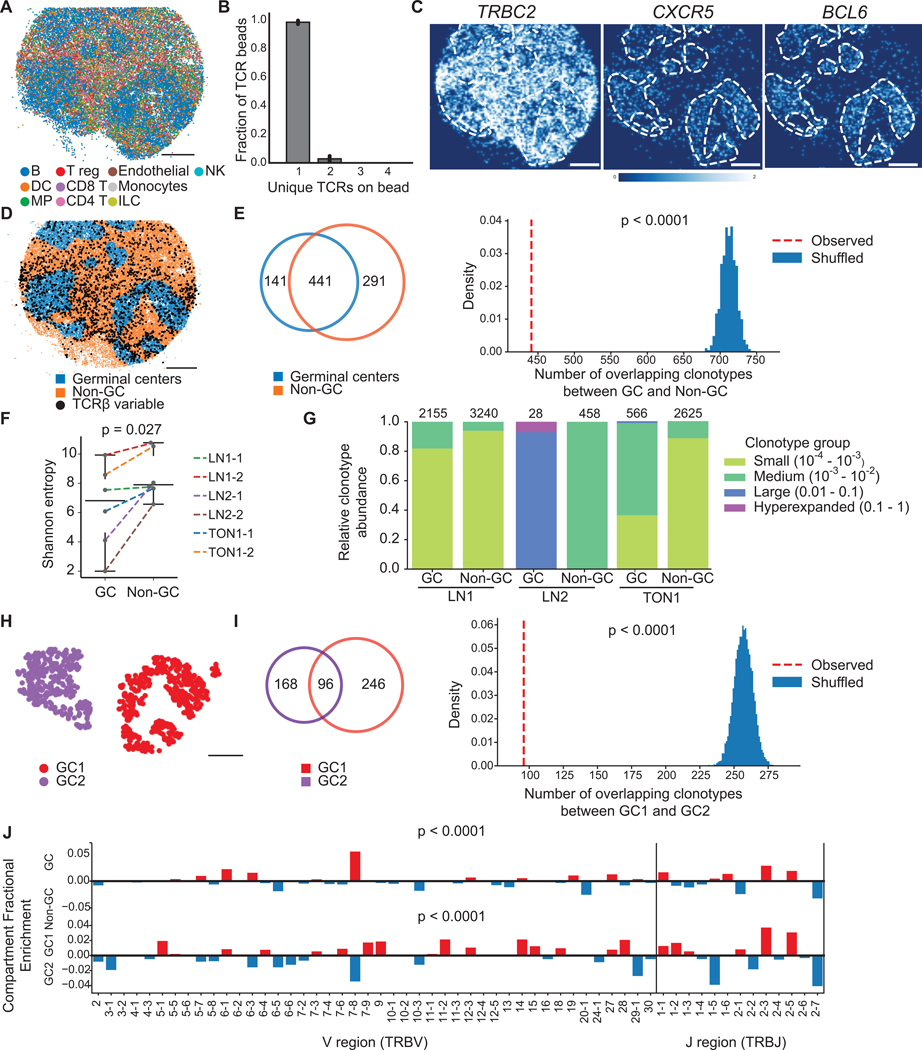
Figure 2. T cell receptor repertoire differences between spatial compartments in human lymph node and tonsil.
(A) Spatial reconstruction of a representative Slide-TCR-seq array from two technical replicates a 10 μm section of human reactive lymph node, LNl, with RCTD cell type assignment. Cell types are plotted individually in Figure S2C.
(B) Characterization of the number of unique TCRs on beads that contain TCRs across lymph node and tonsil samples (n=l0, bar plots indicate means, and error bars indicate standard deviation of replicates.)
(C) Gene expression gaussian-filtered heatmap of a representative Slide-TCR-seq array from two technical replicates for visualizing the spatial distribution of gene markers for T cells (TRBC2) and germinal centers (GCs; CXCRS, BCL6).
(D) Bead designation of a representative Slide-TCR-seq array from two technical replicates into either GC regions (blue) or non-GC (orange) regions based on unsupervised clustering and GC markers on LN1. Beads with TCRβ CDR3 sequences detected are shown by black dots, but only for CDR3 sequences detected on >1 bead.
(E) For LNl, Left: For clonotypes found on >1 bead, a Venn diagram showing the clonotype overlap between GC (blue) and non-GC (orange) regions. Right: the significance of the observed number of shared clonotypes compared to the expected number from randomly shuffled assignments.
(F) Shannon entropy (i.e., a measure of diversity) of the TCR repertoire in GC vs. non-GC regions for six arrays across three human secondary lymphoid organs.
(G) Clonotypes grouped by clonotype fraction, normalized by the total number of TCRs in each compartment, in GC and non-GC regions in lymph node and tonsil, with the number of corresponding beads along the top axis.
(H) K-means clustering distinguishing two GCs in a human reactive lymph node.
(I) Left: For clonotypes detected on >l bead, a Venn diagram showing clonotype overlap between GC1 (purple) and GC2 (red) regions. Right: The significance of the observed number of shared clonotypes between GCs compared to the expected number from randomly shuffled assignments.
(J) Differential enrichment of TRBV and TRBJ sequences in GC (red) vs non-GC (blue) regions (top) and GC1 (red) vs GC2 (blue) regions (bottom). All scale bars: 500 μm. LN = lymph node. TON = tonsil. See also Figure S2.

