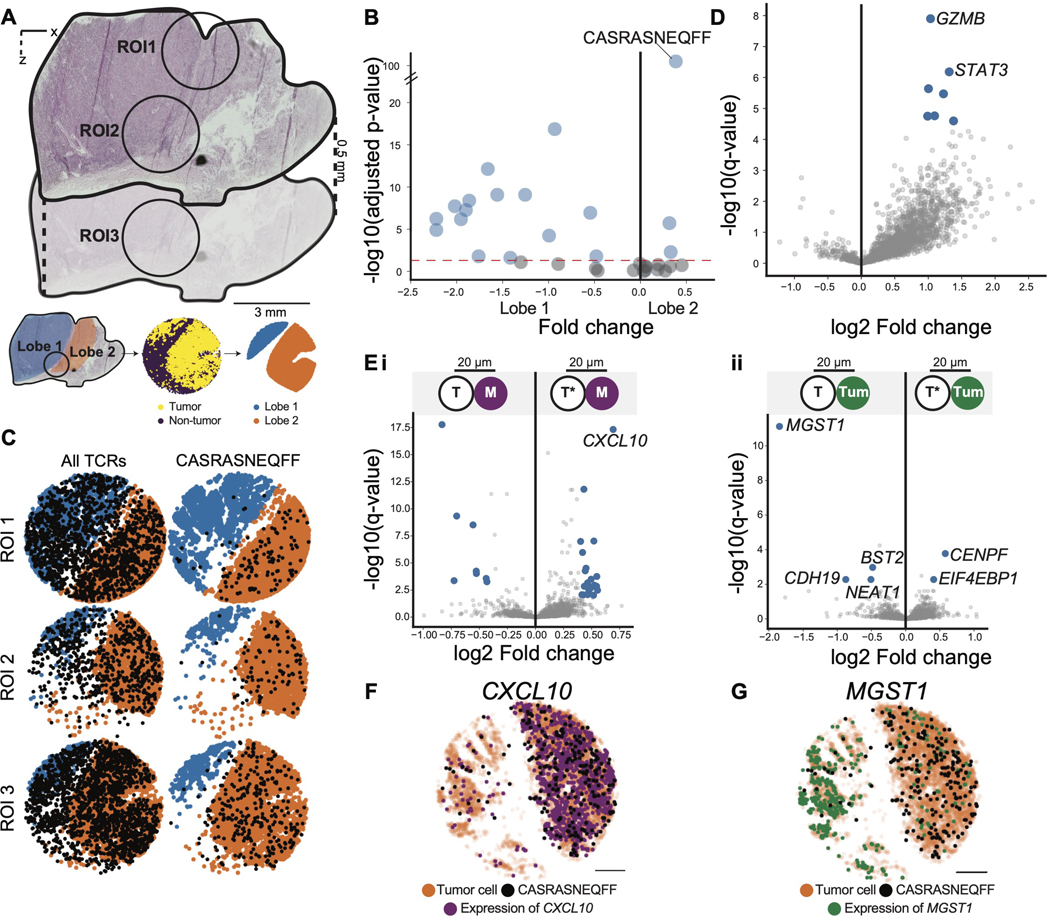
Figure 5. Interactions between a spatially unique T cell clone and tumor cells in melanoma.
(A) H&E of melanoma tumor sample (top) and schematic illustrating the delineation of two distinct lobes (orange and blue) of the tumor across the corresponding H&E, Slide-TCR-seq arrays, and constructed region masks (bottom). ROI = region of interest.
(B) Spatial enrichment of TCRs between the two lobes, tested by chi-square test (n=7 arrays across three regions).
(C) Visualization of all TCRs (left) and the CASRASNEQFF TCR clonotype (right) across one array from each of the three regions. These visualizations are representative of the findings across the seven arrays, shown in Figure S5.
(D) Differentially expressed genes between T cells with the CASRASNEQFF clonotype (right) and all other TCRs (left) (STAR Methods), with blue dots representing statistically significant differentially-expressed genes with absolute log fold change > 0.4 (n=7 arrays across three regions).
(E) i. Differentially expressed genes between monocytes (M) within 20 μm of T cells with CASRASNEQFF (right; T*) and monocytes within 20 μm of all other TCRs (left; T), excluding any monocytes that are within 20 μm of both T cells with CASRASNEQFF and other TCRs. ii. Differentially expressed genes between tumor cells (Turn) within 20 μm of T cells with CASRASNEQFF (right; T*) and tumor cells within 20 μm of all other TCRs (left; T), excluding any tumor cells that are within 20 μm of both T cells with CASRASNEQFF and other TCRs (STAR Methods). Blue dots represent statistically significant differentially-expressed genes with absolute log fold change > 0.4 (n=7 arrays across three regions).
(F) Beads colored by CXCL10 expression (purple, counts ≥2) in one representative array of seven. arrays
(G) Beads colored by MGST1 expression (green, counts ≥1) in one representative array of seven arrays. Scale bars: 500 μm See also figure S5.

