Abstract
Variant calling has been widely used for genotyping and for improving the consensus accuracy of long-read assemblies. Variant calls are commonly hard-filtered with user-defined cutoffs. However, it is impossible to define a single set of optimal cutoffs, as the calls heavily depend on the quality of the reads, the variant caller of choice, and the quality of the unpolished assembly. Here, we introduce Merfin, a k-mer based variant filtering algorithm for improved accuracy in genotyping and genome assembly polishing. Merfin evaluates each variant based on the expected k-mer multiplicity in the reads, independently of the quality of the read alignment and variant caller’s internal score. Merfin increased the precision of genotyped calls in several benchmarks, improved consensus accuracy and reduced frameshift errors when applied to human and non-human assemblies built from Pacific Biosciences HiFi and CLR reads, or Oxford Nanopore reads, including the first complete human genome. Moreover, we introduce novel assembly quality and completeness metrics that account for the expected genomic copy numbers.
Introduction
Accurate variant calling has been a challenge in medical genomics, especially to achieve both high recall and precision in hard to measure regions1. The advent of Next Generation Sequencing (NGS) and long-read sequencing technologies streamlined variant calling2, which typically includes: 1) aligning all reads to a reference genome; 2) calling variants from the alignment; and 3) filtering to remove false positives. The final outcome relies heavily on the precision of this multistep procedure, which depends on: 1) the quality of the read set; 2) the precision of the read mapping algorithm; and 3) the precision of the variant caller in generating reliable calls3. To remove false positives, variant calls are often hard-filtered using heuristics, such as requiring a minimum coverage support, genotype quality, or other internal quality scores2. However, no universally applicable cutoffs exist as they vary depending on the sequencing technology used. Therefore, the accuracy of a variant corresponds to the theoretical limit of the algorithms and the cutoffs employed, and not the theoretical limit given the quality of the raw data.
In parallel, new sequencing technologies greatly expanded our genome assembly toolkit. While the short-read assemblies stumbled resolving repetitive regions4, long-reads have considerably improved the contiguity of genome assemblies5. However, reduced consensus accuracy (hereby noted as QV) has been progressively acknowledged due to the lower base calling accuracy in long-reads, at least until the more recent Pacific Biosciences (PacBio) High-Fidelity (HiFi) reads became available6. Still, lower QV remains even in HiFi reads for simple repeat sequences, particularly homopolymers7,8. Reduced QV has detrimental impacts on many downstream analyses, e.g. gene annotation, which requires an accurate consensus to predict the correct coding sequence7. To mitigate this issue, “polishing” tools have been developed, such as Pilon, Arrow, Racon and Medaka9–11, while established variant calling tools such as GATK, Freebayes, DeepVariant12–14 have been repurposed to detect errors and find candidate corrections. Unlike re-sequencing based methods, the assembly from the same genome is used as a reference for polishing, and thus all homozygous variants suggest corrections to be made. Once corrections are collected, the consensus can be updated using tools such as Bcftools15. The process is usually repeated with different read sets (e.g. long and short-reads), until the QV reaches a set standard.
QV has been historically measured from the variant calling process as described above, however, bearing biases caused from mapping or variant calling. In our previous work, we presented Merqury16, an alignment-free approach to estimate base-level QV using k-mers (genomic substrings of length k). In Merqury, k-mers found only in the assembly and not in the reads are considered as errors, disregarding the expected copy number. As a result, overly represented k-mers from sequence expansion (i.e. false duplications) in the assembly are considered as correct bases. Merqury also presents a completeness metric from the portion of k-mers found in the assembly from a given reliable k-mer set in reads. However, this k-mer completeness metric does not account for the k-mer multiplicity in the reads, limiting the scope in the non-repetitive k-mer space. As a result, any two assemblies with identical distinct k-mers will score the same completeness metric, regardless of one having higher sequence collapses or expansions.
Ideally, the sequence of an error-free and complete genome assembly is in perfect agreement with the sequence data, assuming genomic DNA is randomly sampled with negligible sequencing biases. Therefore, any changes introduced during polishing should improve the assembly-read agreement. This principle has been widely used to visually evaluate genome assembly copy number spectrum (e.g. spectra-cn analysis16,17), and more recently, used to detect errors and improve read alignment18–20. However, none of the evaluation metrics or polishing methods have fully utilized assembly-read agreement.
Here, we introduce a k-mer based filtering approach applicable on genomic variant calls, which achieved higher F1 scores compared to parameter based hard-filtering methods. Next, we propose revised QV and completeness scores that account for the expected sequence copy number given a k-mer frequency, driven by our refined K* definition21 for genome assembly evaluation. Our K* enables the detection of collapses and expansions, and significantly improves the QV when used to filter variants for polishing. We applied this approach to evaluate the most complete HiFi-based assembly of CHM1322–25, simultaneously released by the Telomere-to-Telomere (T2T) Consortium22. Next, we polished a Nanopore-based trio assembly from the Human Pangenome Reference Project (HPRC) and three CLR-based haploid and pseudo-haploid assemblies (a fish, reptile, and bird) generated by the Vertebrate Genomes Project (VGP)5, all resulting in significantly higher consensus accuracy and annotation quality. This approach is implemented as Merfin (k-mer based finishing tool) and is publicly available. Merfin requires k-mers from highly accurate reads (e.g. Illumina) that reflect the k-mer frequency in the genome.
Results
Variant call filtering for higher precision
A reference genome (i.e. GRCh38) with its sequence replaced at all alternate variant calls can be considered a “consensus” sequence and evaluated with k-mers. Unlike using a de novo assembled genome of the same individual as a reference, natural biological differences between the sequenced individual and the reference genome or the incomplete state of the reference (i.e. missing a segmental duplication) imposes challenges to reliably call variants. Nevertheless, it is possible to construct consensus paths from a variant or series of variants within k base pairs (bp) and confirm its validity. We can score each path by the number of k-mers never found in the reads (error k-mer) and choose the best path to contain minimal error k-mers (Fig. 1a and Extended Data Fig. 1a, “-filter” mode).
Fig. 1 |. Algorithms and results used in Merfin.
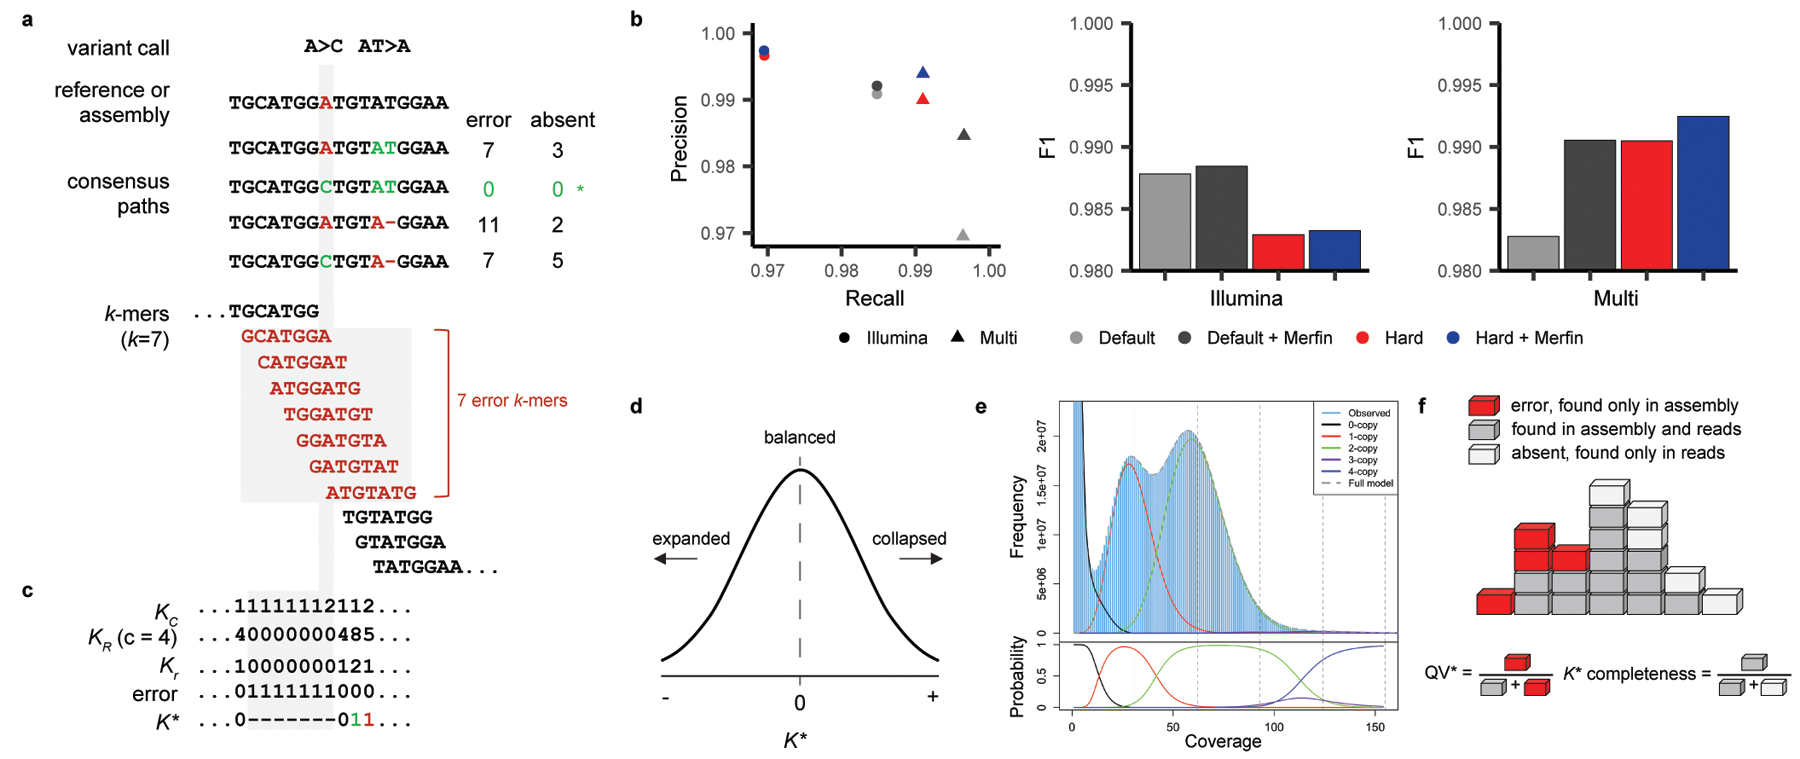
a, Two variant calls and its potential consensus paths. The bases and k-mers in red are errors not found in the reads. The path with A>C has no error k-mers and gets chosen for genotyping (*). For polishing, the average K* is computed in addition to the missing k-mers using the predicted absent k-mers. b, Precision, recall, and F1 from a benchmark on HG002 genotyping. Merfin always achieves higher precision and F1 scores compared to the hard-filtered approach with almost no loss in recall. Default, no filtering; Red, hard-filtering on default. c, K-mer frequency found in the consensus sequence (KC), reads (KR) with average coverage at 4 (c), expected copy number based on the corrected k-mer frequency (Kr = KR / c), and K*. Positive and negative K* values are colored in green and red. The highlighted region (gray) shows the same k-mers and values used to compute K* as affected by the A base in the reference. If two alternatives bear the same number of missing k-mers the alternative with the K* closest to zero is chosen. d. K* distribution. K* values deviated from 0 indicate collapsed (+) or expanded (−) k-mers in the assembly. e, Genomescope 2.0 k-mer frequency histogram with theoretical k-multiplicity curves (top) and probabilities (bottom) for 0, 1, 2, 3, and 4-copy k-mers, generated using the --fitted_hist option. Note that the 3-copy peak is fully contained in the 2 and 4-copy peaks. f, Diagram for estimating QV* and completeness from k-mers. Each k-mer is a block colored by its state of presence. In the block tower, each column represents the identical k-mer with its state colored by its presence in the assembly, reads, or in both. Note the QV* and K* completeness is using all k-mers including their frequency.
To test the validity of this filtering approach, we benchmarked against unfiltered (default) and hard-filtered variant calls submitted to precisionFDA challenge II, HG0021. The variants were called from Illumina reads or from multiple platforms (Illumina, PacBio HiFi, and ONT) using GRCh38 as the reference with GATK HaplotypeCaller. Hard-filtering was performed using the variant caller’s internal scores such as PASS, QD, MQ and QUAL. When comparing precision, recall, and F1 (harmonic mean of precision and recall) on a truth set of Chr. 2026, Merfin always achieved higher precision with minimal loss in recall on both default and hard-filtered sets (Fig. 1b). The hard-filtered set had higher precision, with the price of losing more true positives, resulting in a lower F1 score when compared to the default set. Merfin was able to remove additional false positives on the hard-filtered set. True positive variants used in this analysis, ranging from 48 bp deletions to 47 bp insertions, were all recovered by Merfin.
Assembly evaluation
When a reference genome is constructed from the same individual, the k-mer multiplicity seen in the reads is expected to match the reference. This property can be used for evaluating de novo assembled genomes. Here, we introduce our revised K*, which identifies potentially collapsed and expanded regions in an assembly, and quantitative metrics for representing assembly copy-number concordance and completeness.
Identifying collapsed and expanded regions
The K* metric was defined previously to detect identical collapsed repeats on each k-mer in the assembly21. The method proposed K* = KR / KC, where KR is the frequency of a k-mer found in the reads; and KC is the frequency of a k-mer across the entire consensus sequence of the assembly. In regions with no collapsed repeats, K* will be equal to c, the average coverage of sequencing reads. Here we revised the K* such that it evaluates both collapses and expansions. We propose K* = (Kr - KC) / min (Kr, KC), where Kr is the expected copy number inferred from the reads (Fig. 1c). For a perfect genome assembly and an unbiased read set, K* is normally distributed with mean 0, and deviations from the mean reflect natural variation in the Poisson sampling process (Fig. 1d). Conversely, any large deviation from the normal distribution can be interpreted either as a bias in the assembly (i.e. an assembly error) or a bias in the read set. Specifically, a positive K* implies that the assembly contains fewer copies of k-mers than suggested by the read set (collapsed), while negative K* implies more copies in the assembly than suggested by the read set (expanded).
The Kr can be obtained by rounding to the nearest integer, ⎿ KR / c ⏌, where c is the haploid (1-copy) peak of the k-mer distribution of the reads. Here we assume that rounding Kr is sufficient to account for the standard deviation associated with the Poisson process underlying read generation. While this is true in the case of a perfectly sampled sequencing set, the validity of this generalization is challenged in the presence of sampling bias, systematic error in the reads, and variable degrees of heterozygosity that results in different likelihoods of specific copy-numbers. To account for this uncertainty and improve the accuracy of the results, we modified Genomescope227 to probabilistically infer Kr for each KR, using the observed k-mer count distribution in the read set. If supplied, Merfin will use these probabilities for Kr ≤4. (Fig. 1e).
QV* estimation
An average genome-wide QV accounting for excessive copy numbers (hereby defined as QV*) can be obtained using ∑ KC - Kr as errors when KC > Kr for all positions in the assembly (Fig. 1f and Extended Data Fig. 1b, “-hist” mode). These excessive and error k-mers can be generalized as ‘errors’ in Phred-scale QV, as in Merqury16 or YAK28.
Assembly completeness
The sum of Kr – KC (over all positions where Kr > KC) expresses absent k-mers that should be present in the assembly, and can be directly translated into a measure of assembly completeness as 1 - ∑ (Kr – KC) / Kr (Fig. 1f). Importantly, contrary to other measures of assembly completeness based on a subset of the k-mers (e.g. relying only on the occurrence of distinct k-mers as in Merqury16), Merfin uses all k-mers, including their frequency, and computes the fraction of the expected total number of k-mers (Extended Data Fig. 1b, “-completeness” mode).
Sequence polishing
The K* becomes particularly useful in polishing. Increased QV is achievable through a dedicated polishing tool or via corrections identified by a standard variant calling method. Even when using polishing tools, generating a set of potential corrections in variant call format (VCF) allows finer control over the outcome and can be assessed with Merfin. In Merfin, the impact of each correction or combination of corrections are assessed from the given correction candidates by comparing the change in K*- metrics (Fig. 1a,c and Extended Data Fig. 1a, “-polish” mode). In addition to the error k-mers collected in each predicted consensus path, we compute the consequent k-mer frequency change, and choose the correction only when it improves the assembly-read agreement. For example, when a suggestive correction (replacing AT with A as shown in Fig. 1a) introduces more error k-mers, it should not be used for polishing. Even when no error k-mers are introduced, K* theoretically informs whether a path improves the assembly-read agreement in polishing. The current implementation evaluates each path independently, and thus only a local optimum is guaranteed. Variants within distance k are considered in all combinations, allowing Merfin to filter variant calls close to each other. This approach is fully independent of the raw dataset employed. For instance, the assembly could be generated using long-reads, and the calls evaluated using either short or long-reads or both, taking advantage of the strengths of each sequencing platform, making accurate orthogonal validation possible, ultimately maximizing the assembly-read agreement.
Evaluating a complete human genome: T2T-CHM13
The CHM13hTERT (CHM13) cell line originates from a complete hydatidiform mole (46, XX), where both haplotypes are nearly identical29. This cell line was used to generate the most complete high-quality human reference to date, resolving all centromeric and telomeric repeats and all segmental duplications and satellite arrays22,23. Notably, T2T-CHM13v0.9 was polished from a variety of variant calls, filtered with an earlier version of Merfin, which improved the consensus accuracy of the final assembly25. We further evaluated candidate assemblies to identify collapses and expansions using Merfin using k-mers from HiFi and Illumina reads. We found that the T2T-CHM13v1.0 assembly shows a remarkable agreement with the raw data, with only a few regions having K* largely different from 0, coinciding with satellite repeats (Fig. 2a). Rather than being assembly errors, these disagreements were associated with context-dependent augmentation or depletion in HiFi and GC bias in Illumina22,25. In HiFi, the sequencing coverage depends on sequence content22. Illumina has a similar dependence in GC context, introducing biases during library preparation, but not necessarily in the same direction seen in HiFi. Indeed, K* derived from HiFi and Illumina k-mers showed opposite behavior in some regions, i.e. the HSat3 of Chr. 9 (Fig. 2b). These effects were observed only on the highly repetitive regions of the genome.
Fig. 2 |. CHM13 evaluation and polishing.
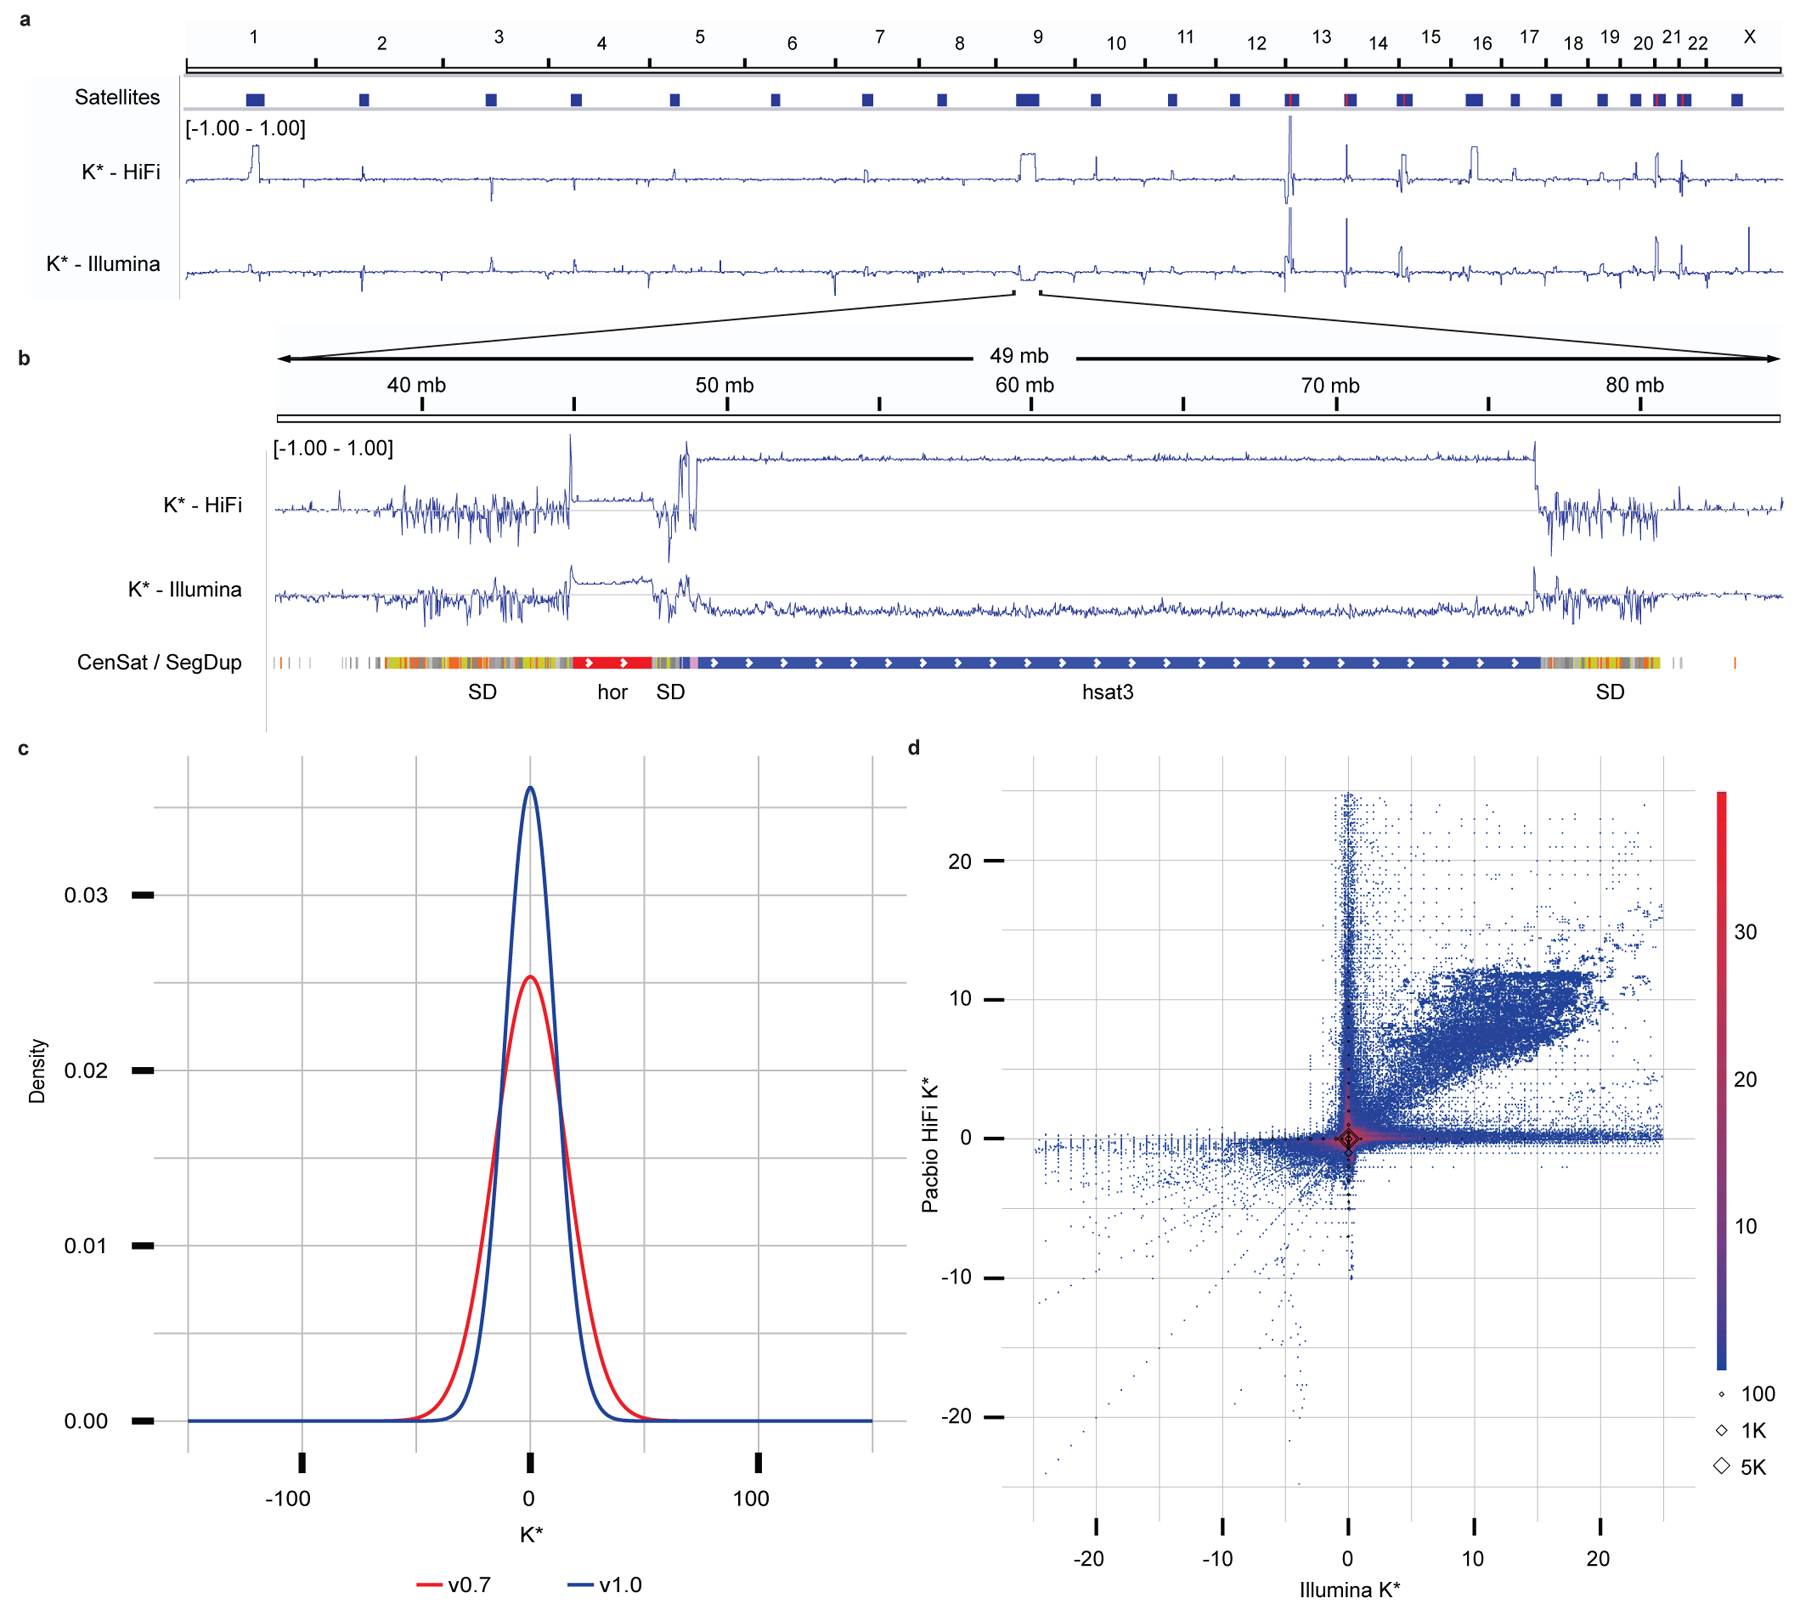
a, Genome-wide K* for the CHM13 assembly v1.0. Satellites are associated with repeat- and technology-specific biases. Yet to be resolved rDNA arrays (red) are highlighted by positive K*. b, Highlight of the centromeric satellite repeats (manuscript in preparation) and segmental duplications23 (orange most similar, yellow less, gray least) on chromosome 9. c, Genome-wide density distribution of the K* using HiFi k-mers. When the assembly is in agreement with the raw data, the K* is normally distributed with mean 0, and the smaller the standard deviation the higher the agreement. CHM13 v1.0 shows a less dispersed distribution of the K* compared to a less complete v0.7 assembly. d, Genome-wide comparison of the K* computed using HiFi vs Illumina k-mers on the CHM13 v1.0 assembly. Agreement between the assembly and the raw reads supported by the two technologies is found around (0, 0). The upper right quadrant highlights where both HiFi vs Illumina technologies suggest the presence of underrepresented k-mers that were largely contributed from the un-assembled rDNAs later resolved in v1.122; the lower left quadrant highlights where both technologies suggest the presence of overrepresented k-mers (with perfect agreement found on the diagonals). The axes correspond to regions of substantial disagreement between the two technologies. Diamonds indicate k-mers missing from one (x or y axis) or both (0, 0) technologies.
Compared to a less complete and less accurate preliminary assembly, T2T-CHM13v0.730, T2T-CHM13v1.0 had a higher agreement of the assembly with the k-mers derived from HiFi (Fig. 2c) and Illumina reads (Extended Data Fig. 2). We found a general agreement in K* between HiFi and Illumina PCR-free k-mers, including regions with sequencing bias common to the two technologies (Extended Data Fig. 3). In other cases, the direct comparison of the K* computed from the two technologies highlighted technology-specific sequencing biases (Fig. 2a,d). Particularly, genome-wide comparison of the K* computed using HiFi vs Illumina k-mers on the CHM13 v1.0 assembly show substantial agreement between the assembly and the raw reads (Fig. 2d, coordinates 0, 0). The only k-mers consistently seen as underrepresented in both technologies (Fig. 2d, upper right quadrant) were mostly contributed from the un-assembled rDNAs later resolved in v1.122. At base resolution, the K* could distinguish regions with accurate consensus from base pair errors, small and large indels, heterozygous sites, and collapsed/expanded regions (Extended Data Figs. 4a-b).
Both QV and QV* measured with Merqury and Merfin improved from v0.7 to v0.9 25, which involved a complete reassembly of the genome using HiFi reads and patches from v0.7 at GA-rich sequence dropouts in the HiFi reads (Supplementary Table 1). Merqury QV improved from v0.7 to v0.9, due to the dramatic decrease in error k-mers, however the Merfin QV* only marginally increased as the number of error k-mers is small compared to the number of overly-represented k-mers, likely due to sequencing biases. We argue that QV* may still be a more reliable metric, because it accounts for all expected k-mer copy numbers, reflecting the full extent of genome representation. QV* is also only marginally influenced by the coverage, as shown by a titration experiment (Extended Data Fig. 5, Supplementary Table 2).
Polishing a completely phased assembly: HG002
The need for polishing is particularly evident in genome assemblies generated using noisy long reads. Therefore, we tested Merfin’s variant calling filtering algorithm on a Nanopore-based assembly of human HG002 trio data generated by the HPRC using Flye31,32. We benchmarked Merfin on Medaka, by comparing polishing outcomes from Medaka with or without filtering with Merfin. In a trio setting, the optimal approach is to polish each parental assembly separately, by aligning the binned reads and performing variant calling5,33. This will reduce the introduction of haplotype switches. However, our k-mer based evaluation of the corrections is best performed on a combined assembly so that it faithfully represents the expected copy-number of each k-mer given the read set.
We first called variants separately from the binned reads used in the assembly with Medaka, and then combined the variant calls and the parental assemblies for the Merfin variant filtering step. K-mers used in Merfin were computed from Illumina sequencing reads. We conducted five different experiments using read sets that differ in coverage, version of the Guppy basecaller, and read length cut-off (Supplementary Table 3). Two rounds of polishing were conducted in all experiments, with the second round performed on the consensus from the first round generated with the additional Merfin step. Overall, in all experiments we observed comparable improvements in base calling accuracy as measured by Merqury QV when Merfin filtering was applied (Supplementary Table 3). This increase reflected a dramatic positive shift in the QV distribution of individual contigs, with most low-quality contigs being rescued by Merfin, and a sharp increase in the number of contigs found without errors, leading to a final Q43.2 and Q42.8 for maternal and paternal haplotypes, respectively (Fig. 3a). In the second round of polishing, the QV ceased to improve or even decreased when Merfin was not applied (Fig. 3a, Supplementary Table 3), suggesting that the best trade-off between errors corrected and introduced in the assembly was already reached in the first round. In contrast, QV continued to increase relative to the first round with Merfin. Haplotype blocks as defined by Merqury increased in a comparable if not better way when using Merfin (Fig. 3b), while haplotypes remained fully phased (Extended Data Fig. 6). Importantly, the results with Merfin were achieved by introducing only a fraction of the variants proposed by Medaka, making this approach more conservative than regular polishing (Fig. 3c).
Fig. 3. |. HG002 human trio polishing and evaluation.
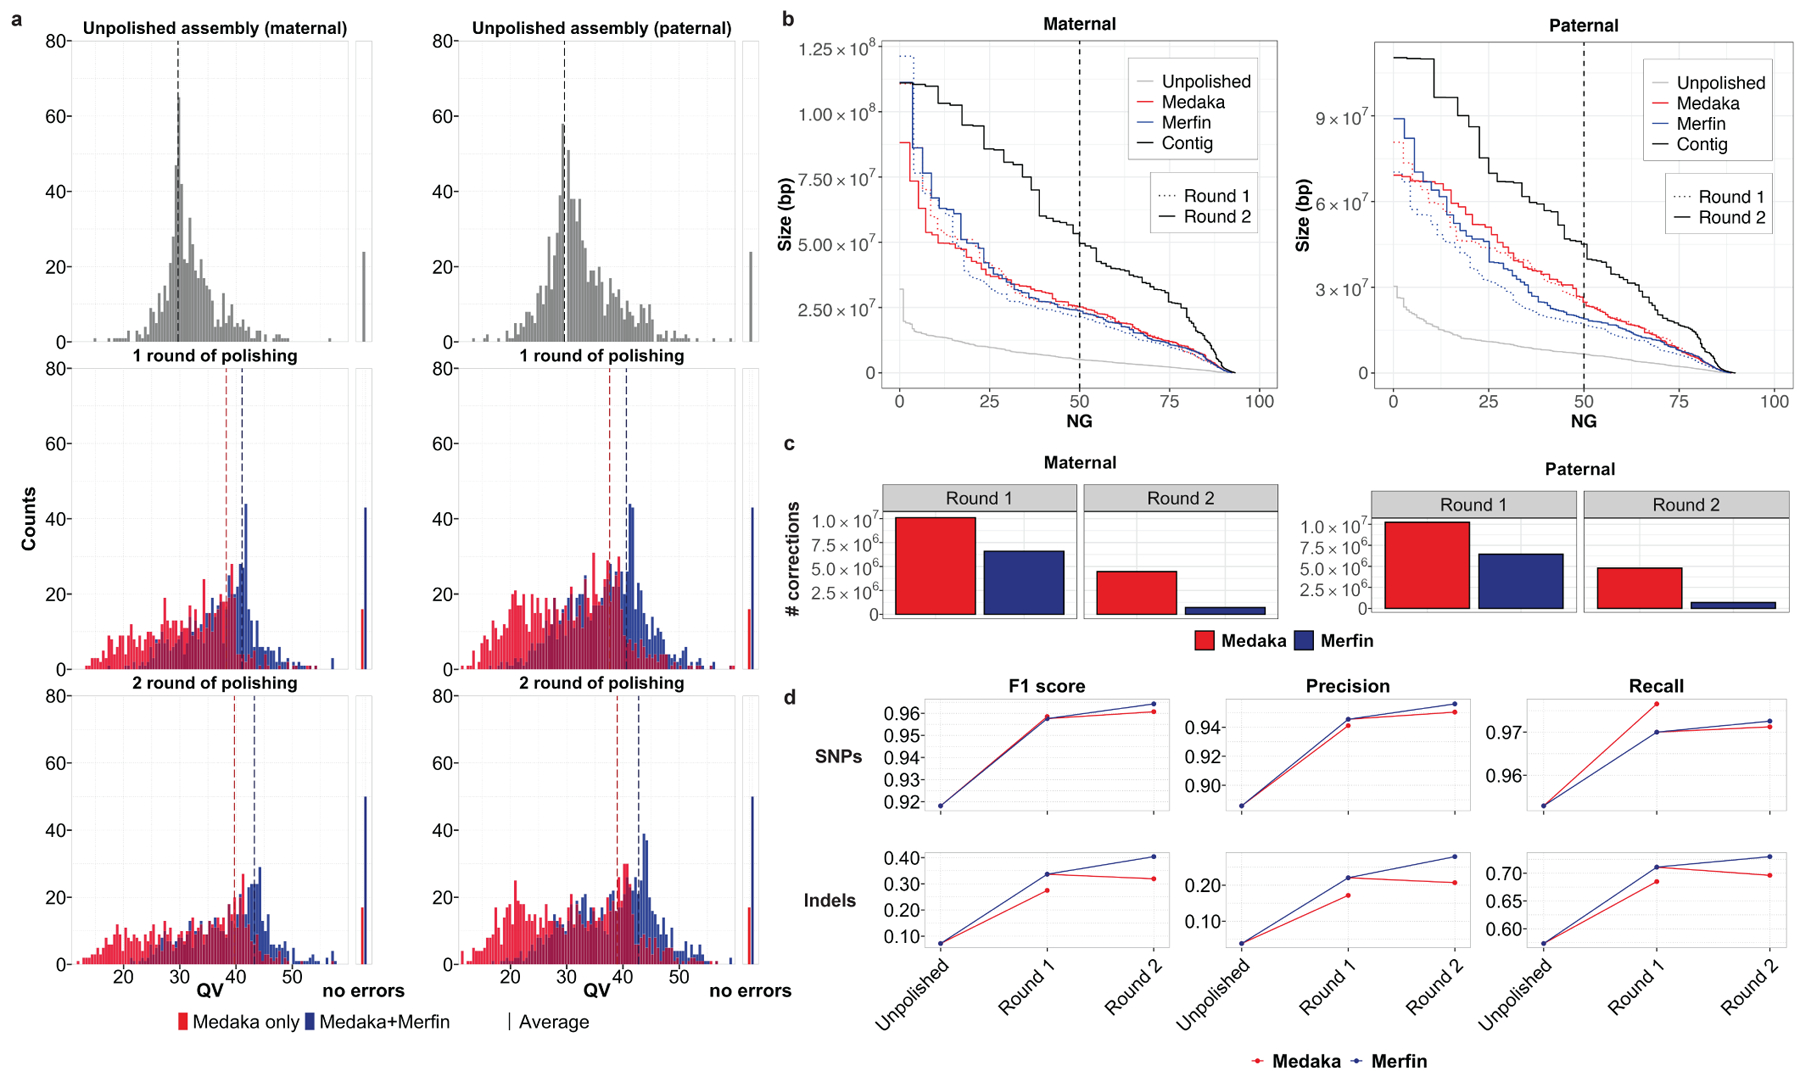
a, Distribution of QV scores as measured by Merqury for maternal and paternal contigs polished with Medaka only, or with variants generated by Medaka filtered with Merfin, from the experiment (test 4, Supplementary Table 3) using latest basecaller (Guppy 4.2.2) and highest coverage (~50x). The first panel represents the unpolished contigs, the mid panel the first round of Medaka polishing and filtering, and the last panel the second round applied to the Merfin results from the previous round. The number of contigs without evidence of errors as judged by Merqury QV are reported on the right side. b, Size of the haplotype blocks before and after polishing with or without Merfin for both the maternal and paternal assemblies. First round of polishing is represented by the dotted lines. c, Number of variants generated by Medaka for polishing and remaining variants after Merfin filtering for both the maternal and paternal assemblies. d, Assembly-based HG002 small variant calling performance of Merfin vs regular Medaka against GIAB truth set. Variants from the assembly are derived against GRCh38 using dipcall.
We further validated the HG002 unpolished and polished assembly by aligning each haplotype assembly to GRCh38 and deriving small variants. When benchmarked against GIAB v4.2.1 truth set26, the results show that using Merfin we get a better F1-score, particularly at INDELs (Fig. 3d, Supplementary Table 4)26,34,35.
Evaluation, polishing and annotation of pseudo-haploid assemblies
We next applied Merfin to the polishing steps of the VGP assembly pipeline5 (Extended Data Fig. 7) on pseudo-haploid assemblies from three species (flier cichlid, Archocentrus centrarchus, fArcCen1; Goode’s desert tortoise, Gopherus evgoodei, rGopEvg1; and zebra finch, Taeniopygia guttata, bTaeGut1). Using PacBio continuous long-reads (CLR) and 10x Genomics linked-reads for polishing, we observed a general improvement in QV as measured by Merqury (Fig. 4a, Supplementary Table 5). The largest improvement was observed in the first round of Arrow polishing step using CLR. Arrow can replace low quality sequences with patch sequences generated de novo from the reads that align to the region, i.e., independent of the original reference quality. We observed low coverage sequencing biases (i.e. homopolymer shortening), and mosaic haplotypes in the generated patches, leading to cases of lower QV in the polished assembly (e.g. Fig. 4a, rGopEvg1). Merfin rescued the QV decrease or improved the QV in all cases. The variant length range (−453:2,242) was not compromised after Merfin (−453:1,618), and many of the variants well above 50 bp were retained by Merfin (Supplementary Table 6), supporting the notion that if the quality of the consensus sequence is sufficient, large calls will not be negatively impacted.
Fig. 4. |. Polishing and evaluation of VGP pseudo-haploid assemblies.
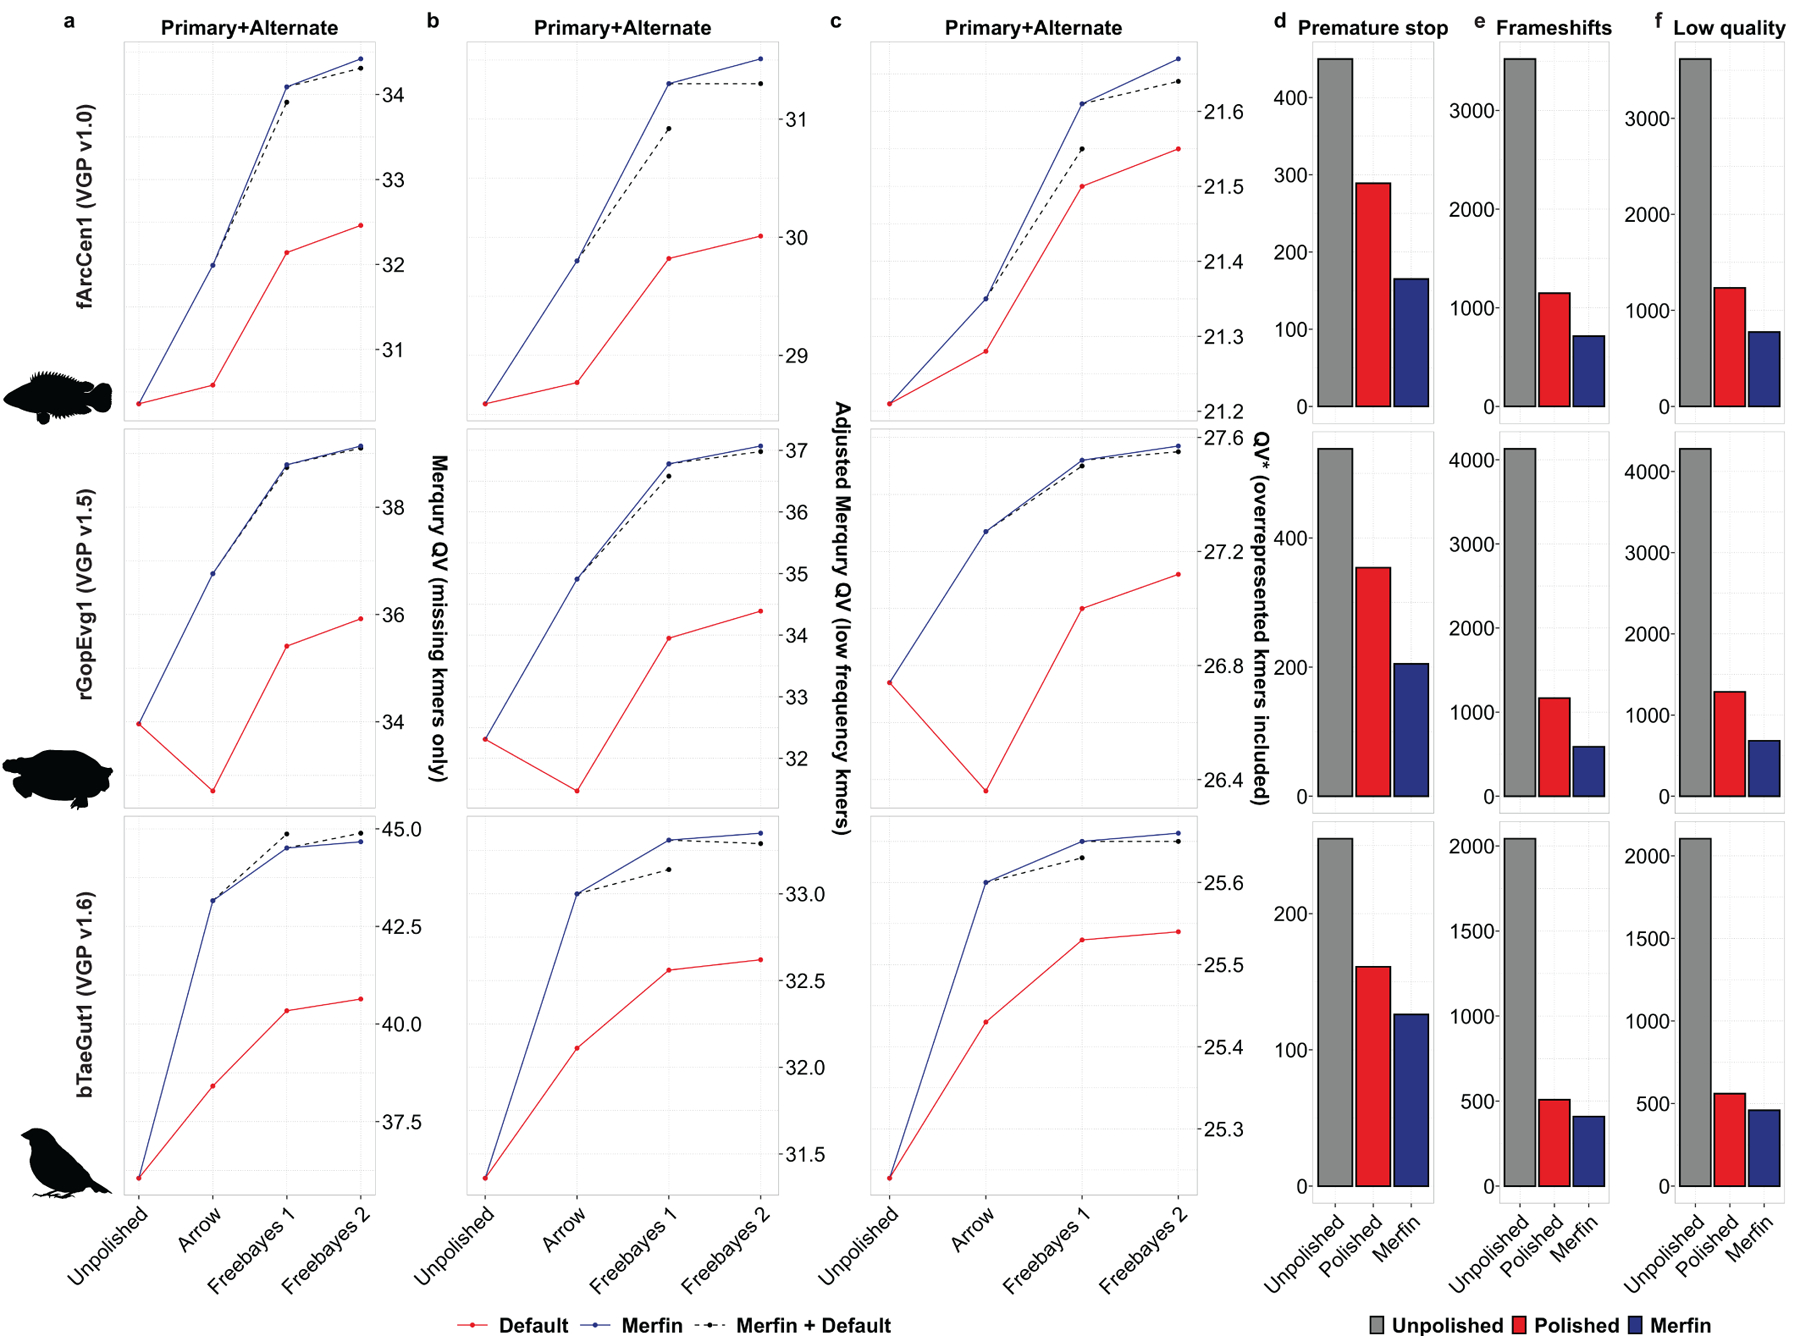
a-c, Polishing results of primary and alternate assemblies for the flier cichlid (fArcCen1), the Goode’s desert tortoise (rGopEvg1), and the zebra finch (bTaeGut1) using the VGP pipeline. Graphed are the unpolished QV values, and the Merqury QV that accounts only for missing k-mers (a), the Merqury QV corrected using Merfin models for 0-copy k-mers (b), and QV* that also accounts for overrepresented k-mers (c). d-f, the general QV increase was reflected in the quality of the gene annotation, with consistent reduction in the number of genes affected by premature stop codons (d), frameshifts errors (e), and low quality protein-coding gene predictions (f).
In the subsequent polishing steps performed using Freebayes, the benefit of running Merfin to filter the variant set was less pronounced but still present (Fig. 4a, dashed lines). This was true in all cases but the zebra finch, where the default pipeline performed marginally better. However, when considering low frequency k-mers as errors from the probability model in Merfin, the QV as well as QV* increased in all cases (adjusted QV and QV* in Fig. 4b,c, Supplementary Table 5). Merqury QV counts all k-mers never seen in the reads as errors, while the adjusted QV additionally counts low frequency k-mers based on the k-mer frequency spectrum as errors. The QV* further includes overrepresented k-mers as errors, therefore capturing not only base accuracy errors, but also false duplications, expressing the uncertainty associated with any particular base given the support from the raw reads.
Most long-read assemblers generate locally phased haplotypes (e.g. Falcon-Unzip36), and it is therefore important that the polishing does not introduce haplotype switches. To test whether the increase in QV from Merfin was due to introducing haplotype switches, we tested a zebra finch (Taeniopygia guttata, bTaeGut2) pseudo-haploid assembly for which parental sequence information is available to evaluate, using parent-specific k-mers, the size of haplotype blocks and the number of haplotype switches5. When Merfin was applied to filter variants generated by Freebayes on the Longranger alignments of the 10x reads in the zebra finch pseudo-haploid setting, we noticed an increase in the number of haplotype switches as measured with Merqury (Supplementary Table 7). We realized that this was due to many heterozygous variants being called by Freebayes, when individual reads were mapped to collapsed regions or preferentially to the more accurate primary assembly5. The missing true heterozygous k-mers in the collapsed or lower quality regions were recovered by the heterozygous variant call, and thus preferred by Merfin. Further, even in almost complete pseudo-haploid assemblies, short-reads can be easily mis-mapped, leading to spurious heterozygous calls. To overcome this issue, we decided to remove all heterozygous variants before applying Merfin. This substantially prevented haplotype switches (Extended Data Fig. 8), wihtout affecting the QV increase (Supplementary Table 7). In conclusion, we suggest removing all heterozygous variants prior to Merfin as the best practice for polishing pseudo-haploid and haploid assemblies.
In addition, we validated our results using gene annotations, which are sensitive to consensus accuracy error, and particularly to frameshift errors caused by indel errors. We performed de novo gene annotation using the RefSeq37 gene annotation pipeline (GNOMON)38 on the VGP assemblies polished with the conventional VGP pipeline (v1.6) and compared against assemblies where Merfin was applied at every polishing step. In GNOMON, if a protein alignment supports a predicted model with an indel introducing frameshift or premature stop codons, the model is labeled as ‘low quality’ and a base is added or removed from the predicted model to compensate for the indel in the genome. If more than 1 in 10 coding genes in an assembly require corrections, the assembly is excluded from RefSeq. Based on information provided by the submitters, almost all rejected assemblies used ONT or PacBio CLR reads.
Again, Merfin substantially reduced the number of genes affected by frameshifts, validating QV and QV* results (Fig. 4d-f, Supplementary Table 8 and example in Extended Data Fig. 9). Premature stop codons were significantly reduced with respect to the default polishing in all cases (Fig. 4d), with 42.9%, 42% and 21.7% reduction in fArcCen1, rGopEvg1 and bTaeGut1, respectively. Ultimately, 1% or less of genes had code breaks in all cases when using Merfin. Frameshifts were also positively affected (Fig. 4e), with 38%, 49.6% and 19.5% reductions in fArcCen1, rGopEvg1 and bTaeGut1, respectively. Less than 3% of genes had frameshifts in all cases when using Merfin. Similarly, the number of protein-coding gene predictions labelled as ‘low quality’ were reduced (Fig. 4f). From these results, Merfin has been included in the VGP pipeline (v1.7).
Consistent with the variant filtering for genotyping, the improvements in QV with Merfin superseded any hard-filtering attempt using variant call quality score (QUAL) cutoffs at the Arrow polishing step (Fig. 5a-c, Supplementary Table 9). For the primary assembly, QV* estimates were consistently higher than the best results attainable by hard filtering (fArcCen1: Q32.5 vs. Q31.9 at QUAL≥18, rGopEvg1: Q38.7 vs. Q36.7 at QUAL≥21, bTaeGut1: Q44.4 vs. Q42.4 at QUAL≥21). The best QUAL cutoff was not necessarily consistent between species, indicating that a single cutoff cannot produce the best outcome in all cases. The alternate assembly (i.e. alternate haplotype) behaved similarly to the primary assembly, again with Merfin always performing best (fArcCen1: Q31.6 vs Q31.1 at QUAL≥23, rGopEvg1: Q35.2 vs. Q34.2 at QUAL≥26, bTaeGut1: Q42.0 vs. Q40.6 at QUAL≥23). However, it notably differed in best QUAL cutoff values to maximize QV. At increased QUAL cutoffs, both genuine and erroneous corrections are filtered out. Thus, hard-filtering cutoffs perform best when the number of errors corrected exceeds the number of errors introduced at maximum. In contrast, variants selected by Merfin had a wide range of quality scores, with the majority containing higher quality scores, and yet including many below 25 (Fig. 5d-f). Notably, a significant fraction of variants with the highest quality score assigned were introducing error k-mers and thus were rejected by Merfin. Potentially, accumulated sequencing biases in long-reads could lead to erroneous variant calls but can be filtered with more accurate k-mers from short-reads. No hard-filtering methods were able to achieve QV improvements in polishing as observed with Merfin.
Fig. 5. |. Merfin results against quality scores.
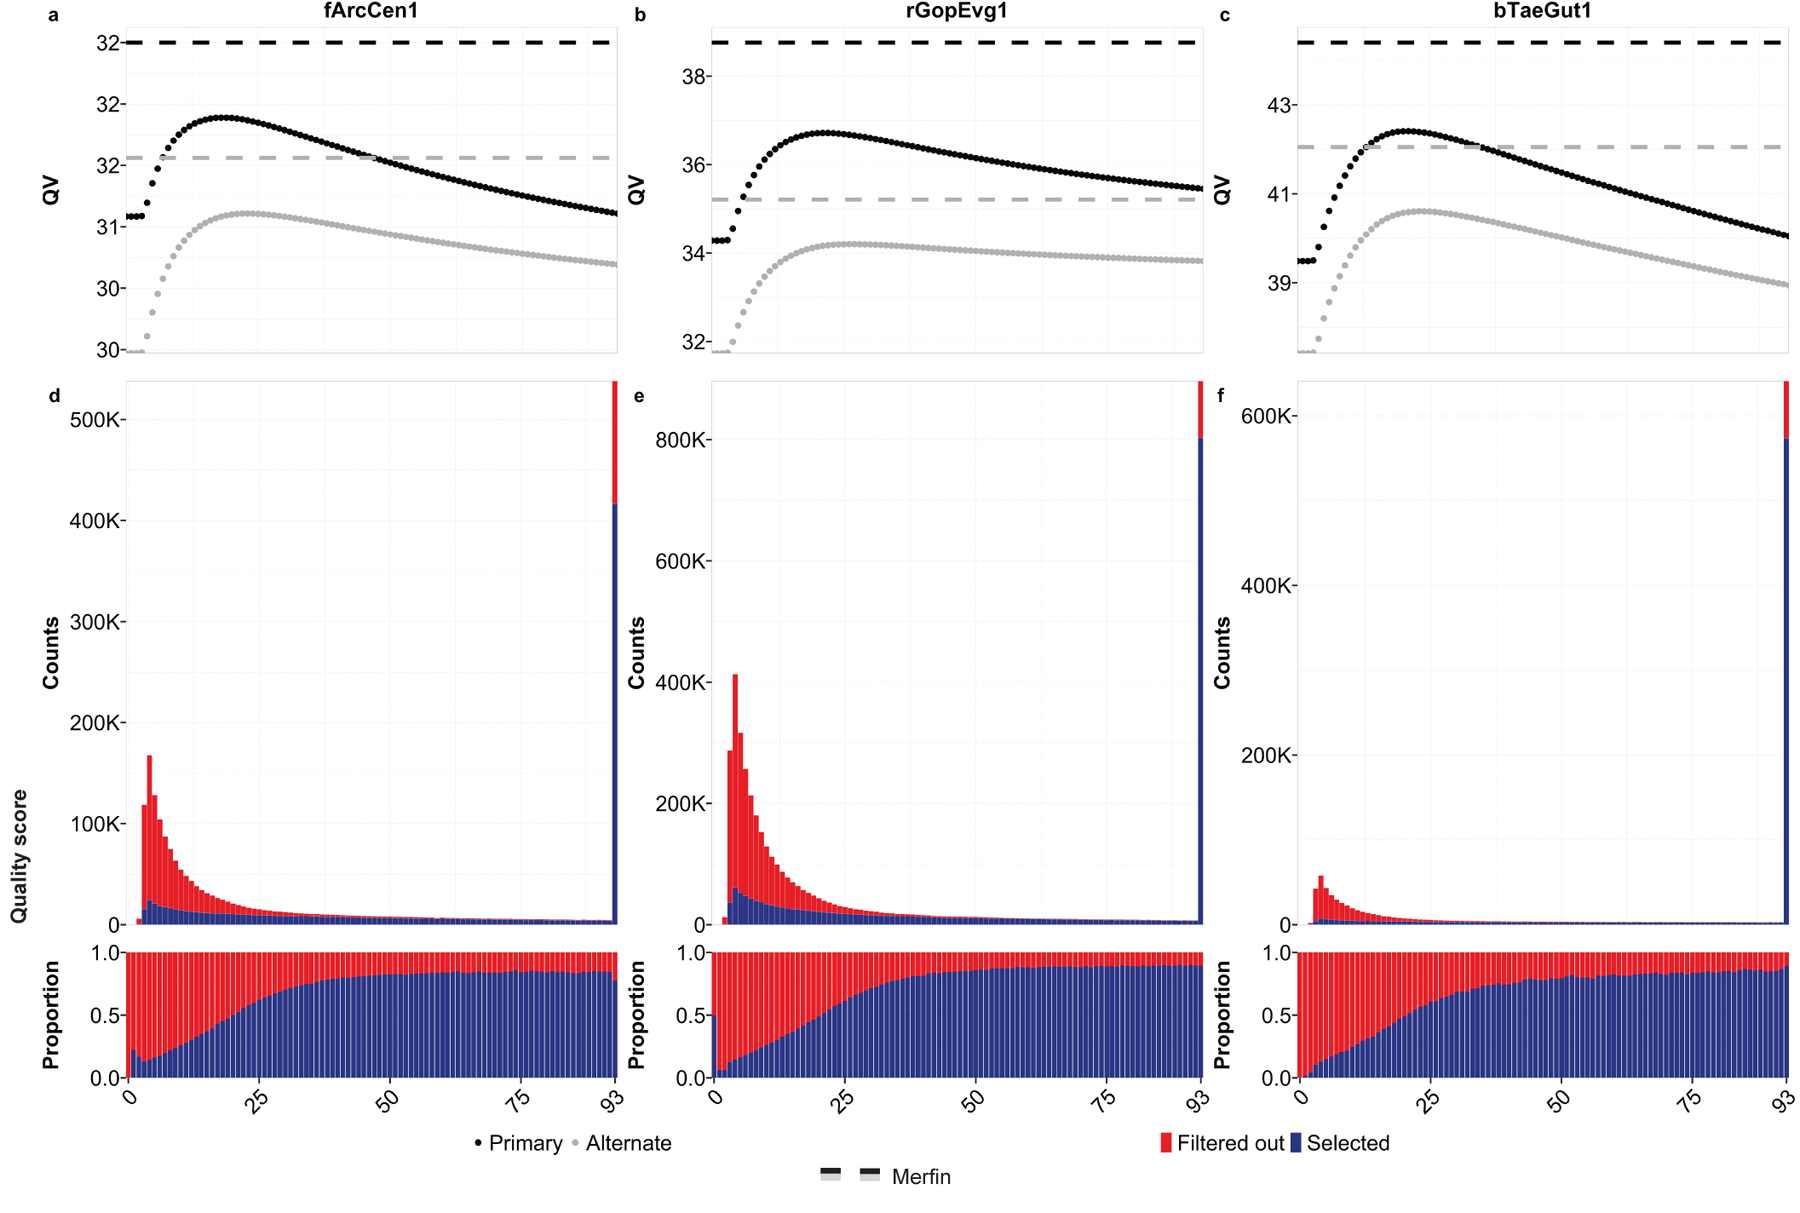
a-c, QV after polishing as a function of hard-filtered quality score cutoff in primary (black) and alternate (gray) assembly. Results achieved with Merfin are represented by the horizontal lines for comparison. d-f, Number and proportion of variants by quality score selected by Merfin.
Effect of k-size and computational requirements
The minimum size of k can be determined by a given genome size and a tolerable k-mer collision rate39. This has been adapted in Merqury16 and used for k-mer based assembly evaluation. In brief, under a maximum allowed collision rate of 0.5%, k=21 is suggested as the minimum length of k for genomes of size typically found in vertebrate species (1.2 ~ 4 Gb), including human, and is used throughout our benchmarks. In theory, a larger k-size could result in more accurate filtering variants with the cost of k-mer coverage drop and increased computational burden. We tested if using k=31 provides a better F1 score over k=21 on the variant filtering GIAB benchmark, and found it provided a marginal improvement in the F1 scores (0.04%, Supplementary Table 10) at the cost of using 1.5 times more memory and 1.6 to 2.6 times more computation. As a large fraction of the read k-mers occur exactly once in the reads (72~89% of all distinct k-mers), we tested how excluding these would affect the performance of Merfin. Excluding unique k-mers in the filtering slightly increased the F1 score (0.01% to 0.03%) compared to using the entire k-mer set, by removing additional false positive calls. Memory requirement significantly reduced from 122.6 GB to 49.2 GB for loading k-mers obtained from ~60x Illumina reads and 68 GB to 24.3 GB for loading ~25x Illumina reads along with reduced CPU hours (Supplementary Tables 10-12). As the filtering, evaluation, and polishing results at different k-size or filtering were nearly identical, we recommend avoiding using larger k and excluding all unique k-mers before applying Merfin to maximize results with minimal computational burden.
Discussion
We described and demonstrated Merfin, a k-mer based tool to evaluate and filter variant calls for improved genotyping accuracy and polishing. Importantly, while adding only a modest runtime to variant calling, Merfin allows an innovative alignment-free evaluation and filtering of variants (VCF) generated from any dataset or variant calling method. Merfin successfully removes false positive calls, superseding any hard-filter based cutoff for both genotyping and polishing. Contrary to the plateau effect usually observed in traditional polishing, our approach is a monotonic function, predicted to improve the consensus accuracy until no more useful variants are produced by the variant caller. This lets polishing pipelines have a stopping condition to set, i.e. to stop iterative polishing when no more variants survives Merfin’s filtering. Merfin depends on the accuracy of the bases in the suggested alternate sequence called by the variant caller. Long alternate insertion-like sequence from noisy long-reads (e.g. CLR or ONT) bear a higher chance to have base errors, which are more likely to get rejected. This could be avoided by applying other tools to validate large insertions such as VaPoR40 before running Merfin. However, we note that the variant size ranges from CLR and ONT before and after polishing were well preserved as shown in Supplementary Table 6.
In addition to implementing variant evaluation and filtering in Merfin, we revised K*, a metric based on the copy number agreement between the reads and the assembly, to identify and analyze local expansions and collapses at each k-mer genome-wide. We also devised QV* and K* completeness, new quality metrics that account for over and underrepresented k-mers undetected by previous methods16. On the first complete human genome, we demonstrated that our approach allows orthogonal validation of both consensus sequence and variants with multiple sequencing data type.
Like all k-mer-based estimates, K* is influenced by the choice of k, which is dependent on the quality of the reads. The results presented here assume high-accuracy reads (e.g. Illumina) for evaluation and variant filtering, and may therefore not work best with k-mers derived from noisy long-reads (i.e. CLR reads and early ONT data). Presence of sequencing biases also results in biased K*, such as the GC bias in Illumina reads or the GA dropouts in HiFi reads25. We found Illumina reads were overall better in correcting systematic homopolymer and 2-mer microsatellite errors often introduced by HiFi reads41. Yet, these effects are limited only to certain regions of the genome, and it could be potentially further mitigated by methods that correct sequencing reads for known biases42.
In parallel, the completeness of the assembly also affects the K*. Pseudo-haploid or haploid representation of a genome may potentially lead to suboptimal evaluation because of the missing sequence. However, we argue this is a limitation of the assemblies, rather than a limitation of the methods used to evaluate and polish them. Representing a diploid genome as a haploid or pseudo-haploid assembly introduces complications in the evaluation, since the k-mers in the consensus will not fully reflect the k-mers in the read set. Homozygous k-mers will be underrepresented, and some of the alternate haplotype k-mers will be completely missing. While haploid or partially phased (e.g. FALCON-Unzip36) assemblies can be preferred for some applications, a faithful reconstruction of the complete genome (e.g. using trio binning33,43) should be preferred for both evaluation and comparative purposes, as well as for many biological analyses that can benefit from the presence of both haplotypes. The recent developments in assembly graphs enable the representation of complete haplotypes with enhanced accuracy and completeness44, suggesting that assembly tools and state-of-the-art assemblies are moving in this direction. If this condition is met, the information contained in the reads can be fully harnessed to evaluate and improve genome assemblies.
Merfin presents the first k-mer based variant filtering to the best of our knowledge, enabling higher precision in genotyping and improving assembly accuracy. This will become critical particularly in medical genomics and many other applications, where reliable genotyping is essential. Polishing with Merfin will also rescue assemblies built from noisy long-reads when more accurate reads are not accessible, or when sequencing biases are subject for correction using complementary sequencing data.
Methods
Genotyping benchmark
Variant calls from HG002 submitted to precisionFDA Truth Challenge1 were downloaded from https://data.nist.gov/od/id/mds2-2336 (SEX9X, NFT0L, 23O09, and QUE7Q). In brief, ~35x Illumina PCRfree, ~36x PacBio HiFi, and ~47x ONT reads were aligned to the human genome reference (GRCh38) with no alternates. Variants were called with GATK HaplotypeCaller v4. Unfiltered and hard-filtered set was downloaded and a subset of the call on Chr. 20 was extracted with bcftools v1.10.2 (https://github.com/samtools/bcftools). The variant calls were then benchmarked against the GIAB truth set v4.2.1 within the confident region using hap.py (v0.3.12–2-g9d128a9, https://github.com/Illumina/hap.py)26. The GIAB variant calling truth set and confident region for HG002 can be found in: ftp://ftp-trace.ncbi.nlm.nih.gov/giab/ftp/release/AshkenazimTrio/HG002_NA24385_son/NISTv4.2.1. We used the following commands for the evaluation:
hap.py \
 HG002_GRCh38_1_22_v4.2.1_benchmark.chr20.vcf \
 $QRY.vcf. \
 -f HG002_GRCh38_1_22_v4.2.1_benchmark_noinconsistent.bed \
 -r GCA_000001405.15_GRCh38_no_alt_analysis_set.fna \
 -o OUTPUT \
 --threads 24
Precision and recall were then collected before and after filtering the variants with Merfin from happy.py output.
To run Merfin filtering, PCR-free Illumina paired-end reads (2×250 bp) were obtained from NIST (https://ftp-trace.ncbi.nlm.nih.gov/giab/ftp/data/AshkenazimTrio/HG002_NA24385_son/NIST_Illumina_2×250bps/) and 21-mers were collected using Meryl v1.3. K-mers with frequency > 1 were used as read k-mers to avoid k-mer collisions from sequencing errors and improved computational performance. Likewise, 21-mers from GRCh38 primary assembly (GCA_000001405.15) were collected with Meryl and used as the sequence k-mers. The following commands were used to build meryl k-mer databases:
meryl count k=21 reads.fastq.gz output HG002.k21.meryl
meryl count k=21 hg38.fna output hg38.k21.meryl
Command lines to run Merfin can be found in the Runtime and memory section below.
Revised K*
K-mers are substrings of length k of a given DNA sequence. Given the assembly consensus sequence, we compute all its constituent k-mers. Similarly, we compute all k-mers represented in a set of WGS reads from the same individual. We then ask how the frequency of each k-mer in the read set is mirrored in the assembly k-mer set. If the read set is a faithful representation of the genome (i.e. in the absence of random DNA sampling and sequencing biases), then the closer the consensus sequence is to the read set, the closer it is also to the genome the reads were generated from. This principle can be usefully represented by our revised K*, where for each k-mer in the consensus we can calculate (Fig. 1a):
KC = k-mer count in the consensus sequence
KR = k-mer count in the read set
To account for the uncertainty associated with the underlying Poisson sampling process, in any sequencing experiment the read set covers on average the original genome multiple times. It is therefore useful to determine the expected copy number of a particular k-mer in the assembly given the read set, Kr, as:
c = haploid peak from KR histogram
Kr = the k-mer count expected in the consensus based on the read set, i.e. ⎿ KR / c ⏌
Note that Kr - KC expresses the number of copies of any particular k-mer that is underrepresented (collapsed; positive value) or overrepresented (expanded; negative value) in the assembly.
With these definitions, we can now define K* as:
K* = Kr / KC – 1 if Kr > KC (collapsed k-mers)
K* = – (KC / Kr – 1) if Kr < KC (expanded k-mers)
Which can be reduced to:
Note that K* converges to 0 if the k-mer frequency in the assembly matches the expected copy number in the reads. Missing k-mers (i.e. found in the assembly but not in the read set) have a special behavior, with K* being “undefined” for Kr = 0.
Probabilistic K-mer copy-number estimation
To estimate k-mer copy-number in the genome, we modified Genomescope227 to obtain the associated probability at each KR. Our additions were subsequently integrated in the current version of Genomescope2 (https://github.com/tbenavi1/genomescope2.0). Unmodified fitted model 1- to 4-copy k-mer distributions were used to infer the probability that a particular k-mer frequency observed in the read set implied a particular copy k-mer in the genome. Using this model, Merfin provides a script generating a lookup table for each k-mer frequency in the raw data with the most plausible k-mer multiplicity and its associated probability (https://github.com/arangrhie/merfin/tree/master/scripts/lookup_table).
QV estimation using the K*
An average genome-wide QV* is obtained by counting all k-mers not present compared to the expected copy number estimated from the read set. We collect all k-mers excessively found in the assembly (KE) and estimate the error rate given all k-mers in the assembly (Ktotal).
KE = ∑ KC - Kr when KC > Kr for all positions in the assembly
The Phred-scaled QV* can be computed using the implementation in Merqury16.
We follow the implementation in Merqury and compute the probability P that a base in the assembly is correct and in its expected frequency:
Which leads to error rate E being:
Hence the Phred scaled QV* becomes:
Assembly completeness using the K*
To estimate completeness, we collect all k-mers that should be present but are absent from the assembly. Unlike Merqury, we account for the k-mer frequency and count any k-mer that should be added to meet the expected frequency from the reads KA.
KA = ∑ (Kr - KC) when Kr > KC for all Kr, including KC = 0
We compute the completeness Comp given all Kr:
Sequence data
For the HG002 results, data can be found at https://github.com/human-pangenomics/HG002_Data_Freeze_v1.0. For the VGP datasets, PacBio CLR and 10x Genomics linked reads can be found at https://vgp.github.io/genomeark/5.
Evaluation of CHM13 assemblies
All scripts used for CHM13 evaluation can be found here: https://github.com/gf777/misc/tree/master/merfin. Briefly, we generated genome-wide K* tracks using Merfin option -dump (merfin_dump.sh). K-mer counts databases for both the assemblies and the raw Illumina and HiFi reads were computed using Meryl (https://github.com/marbl/meryl). Peak values of 106.8 and 31.8 derived as the kcov value from Genomescope were used for Illumina and HiFi k-mers, respectively, which is now obtainable with Genomescope2 -p 1(commit version fdeb89178d506c9af2c5d0d103e0135a164889a3). The tracks were converted to bigWig and loaded in IGV45 for visualization. We used a custom script (simplify_dump.sh) to count the number of bases with the same K* values for both Illumina and HiFi k-mers, which were then used to generate the genome-wide K* comparison. The titration experiment was performed downsampling the reads with the ‘seqtk sample’ command (https://github.com/lh3/seqtk, v1.3).
Variant calling and polishing of HG002 assemblies
Variant calling and polishing of HG002 assemblies was performed using medaka v1.2.6 (https://github.com/nanoporetech/medaka) using the models specified in Supplementary Table 3 for each dataset. Medaka was first run in the consensus mode (medaka_consensus) and subsequently in the variant mode (medaka_variant) to generate the vcf of the variant calls. Illumina 21-mers from the HG002 benchmark were re-used for evaluation and filtering with Merfin. Medaka filtered variant set was then used in conjunction with bcftools v1.9 in the consensus mode with the -H 1 option to generate a consensus sequence. The same procedure was followed for the Merfin assemblies, except that Merfin was used to filter Medaka vcf prior to consensus generation. Polishing was repeated twice, and in the second round the assembly polished with Merfin was used as reference. Additional best practices for running Merfin can be found in the Github repository (https://github.com/arangrhie/merfin/wiki/Best-practices-for-Merfin).
Assembly-based small variant calling assessment
We used dipcall v0.3 (https://github.com/lh3/dipcall) to generate the small variants from the assembly. Dipcall takes a diploid assembly and a reference genome to produce a variant call file (vcf) that contains all variants that are present in the assembly compared to the reference. We then compared the variant calls against GIAB truth set v4.2.1 using hap.py as described in the Genotyping benchmark session. We used the following commands for the evaluation:
./run-dipcall <output_prefix> <GRCh38.fa> <pat.fa> <mat.fa> -t 8 -x hs38.PAR.bed
hap.py HG002_GRCh38_1_22_v4.2.1_benchmark.vcf.gz \
 DIPCALL_OUTPUT.dip.vcf.gz \
  -f HG002_GRCh38_1_22_v4.2.1_benchmark_noinconsistent.chr20.bed \
  -r GCA_000001405.15_GRCh38_no_alt_analysis_set.fna -o OUTPUT \
  --pass-only --engine=vcfeval --threads=32
Variant calling and polishing of VGP assemblies
While the original assemblies were generated with different versions of the VGP pipeline5 (https://github.com/VGP/vgp-assembly/tree/master/pipeline), to polish the assemblies of the flier cichlid (v1.0), the Goode’s thornscrub tortoise (v1.5), and the zebra finch (v1.6) with Merfin we used the VGP pipeline v1.6 (Extended Data Fig. 7). In the first round of polishing, PacBio CLR reads were aligned with pbmm2 v1.0.0, variants were called with variantCaller v2.3.3 (arrow) with the -o ${asm}.vcf option. A custom script (https://github.com/arangrhie/merfin/blob/master/scripts/reformat_arrow/) included in Merfin was used to properly format the vcf file (reshape_arrow.sh). 21-mer databases for both the assemblies and the 10x linked-reads were generated with Meryl. 10x barcodes were trimmed from the reads using the script available in Meryl. The haploid 21-mer coverage and the lookup tables were computed using our modified Genomescope2 script included in Merfin:
Rscript $merfin/lookup.R ${asm}.21.meryl.hist 21 ${asm}.21.lookup 2
Similarly to HG002, the consensus was generated with bcftools v1.9 using the filtered vcf generated by Merfin. The same strategy was applied for the other polishing steps, except that Longranger v2.2.2 was used for mapping the 10x Genomics linked-reads and Freebayes v1.3.1 (https://github.com/freebayes/freebayes) for variant calling.
For variant calling and polishing of zebra finch trio, curated primary (bTaeGut2.pri.cur.20191112.fasta) and alternate (bTaeGut2.alt.cur.20181019.fasta) pseudo-haploid assembles were downloaded from genomeark (https://genomeark.s3.amazonaws.com/index.html?prefix=species/Taeniopygia_guttata/bTaeGut2/assembly_curated/). 10x linked reads were aligned with Freebayes on the primary and alternate assembly using Longranger with default options. Freebayes calls were filtered using Bcftools v1.9 with the -i’(GT=“AA” || GT=“Aa”)’ option prior to Merfin filtering. K-mer counts databases for both the assemblies and the raw Illumina reads were computed using Meryl, and Merfin was run with a peak value of 35.2 derived as the kcov value from Genomescope2.
Evaluation of the assemblies
QV and phasing analyses of HG002 and zebra finch trios were performed using Merqury16 (https://github.com/marbl/merqury/) in the trio mode using 21-mers and default parameters. Similarly, primary and alternate scaffolds of the VGP assemblies were separated and Merqury QV was estimated on both using 21-mers and default parameters.
Gene annotation of VGP assemblies
Annotation was performed using the NCBI annotation pipeline5, using the same transcript, protein and RNA-Seq input evidence for the annotation of the unpolished, polished and Merfin assemblies of each species. For Taeniopygia guttata, a total of 100,000 Taeniopygia guttata ESTs, GenBank and known RefSeq37 and 10 billion same-species reads for over 13 tissues were aligned to the genome, in addition to all GenBank Aves proteins, known Aves, human and Xenopus RefSeq proteins, and RefSeq model proteins for Parus major, Gallus gallus, Columbia livia and Pseudopodoces humilis. For Gopherus evgoodei, 1.22 billions RNA-Seq reads from 5 tissue types from Gopherus and Chelonoidis species were aligned to the assemblies in addition to all known RefSeq proteins from human, Xenopus, and Sauropsida, and model RefSeq proteins from Chrysemys picta, Pelodiscus sinensis. For Archocentrus centrarchus, 476 million same species RNA-Seq reads from 9 tissue types were aligned to the assemblies in addition to all Actinoipterygii GenBank proteins, human and Actinopterygii known RefSeq proteins and Oryzias latipes, Oreochromis niloticus, Monopterus albus, Xiphophorus maculatus model RefSeq proteins. In brief, the genome sequences masked with Windowmasker46 before annotation. Transcription RNA-Seq data were aligned with BLAST47 followed by Splign48, and RefSeq and GenBank proteins were aligned using Blast and ProSplign. The gene model’s structure and boundaries were obtained with Gnomon (https://www.ncbi.nlm.nih.gov/genome/annotation_euk/gnomon/) by manipulating a hidden Markov model trained on the species. tRNAs were prediced with tRNAscan-SE v1.2349 and small non-coding RNAs were predicted with RFAM v12.0 HMMs using cmsearch from the Infernal package50.
Runtime and memory requirements
Computational requirements for k=21 and k=31 are reported in Supplementary Table 10-12. Commands used were:
HG002 GIAB benchmark:
Merfin -filter       \
 -sequence GRCh38_no_alt_analysis_set_clean.fasta \
 -seqmers hg38.meryl      \
 -readmers HG002.k$K.[gt1.]meryl    \
 -vcf $in_vcf -debug -output $out
T2T-CHM13v1.0 assembly evaluation:
merfin -hist -threads 24 -sequence $fasta   \
 -seqmers $fasta.k21.[gt1.]meryl     \
 -readmers chm13.k21.[gt1.]meryl     \
 -prob lookup_table.k21.txt -peak 106.7 -output $out.hist
merfin -hist -sequence $fasta      \
 -seqmers $fasta.k31.[gt1.]meryl     \
 -readmers chm13.k31.[gt1.]meryl     \
 -prob lookup_table.k31.txt -peak 99.59 -output $out.hist
fArcCen1 Arrow polishing:
merfin -polish -sequence fArcCen1_s4.fasta.gz   \
 -readmers fArcCen1.k21.[gt1.]meryl    \
 -prob lookup_table.k21.txt      \
 -peak 10.8 -vcf fArcCen1_s4.reshaped.vcf.gz -output $out
merfin -polish -sequence fArcCen1_s4.fasta.gz   \
 -seqmers $seqmers -readmers fArcCen1.k31.[gt1.]meryl \
 -prob lookup_table.k31.txt -peak 9.1     \
 -vcf fArcCen1_s4.reshaped.vcf.gz -output $out
Output variants from the fArcCen1 experiment were compressed with bcftools (bcftools consensus -f $fa -H 1 $vcf.gz > $out.fasta) and used for generating the polished consensus. Evaluation of the polished fArcCen1 experiments were performed on k=21 with merfin options -hist -prob lookup_table.k21.txt -peak 10.8 -readmers fArcCen1.k21.meryl. All probability lookup tables were generated with Genomescope2 with options --fitted_hist -p 1 (ploidy=1) for CHM13 evaluation. Experiments were run on Biowulf, NIH HPC clusters with 24 threads allowed. Maximum memory and detailed cluster specifications are in Supplementary Tables 10–12.
Data Availability
HG002 variant call data was downloaded from https://data.nist.gov/od/id/mds2-2336 (SEX9X, NFT0L, 23O09, and QUE7Q). Sequencing data and assemblies for CHM13, HG002, and VGP genomes are available at https://github.com/marbl/CHM13, https://github.com/human-pangenomics/HG002_Data_Freeze_v1.0 and https://vgp.github.io/.
Source data used for generating all figures in this manuscript are available at https://github.com/gf777/misc/tree/master/merfin/paper/figures.
The K* tracks for HiFi and Illumina of the CHM13 are browsable in the associated UCSC browser (http://genome.ucsc.edu/cgi-bin/hgTracks?db=hub_2395475_t2t-chm13-v1.1). All variant calls used in the genotyping benchmarks, k-mer databases, fitted histogram tables and K* tracks are available to download at https://s3-us-west-2.amazonaws.com/human-pangenomics/index.html?prefix=publications/MERFIN_2021/ with a step-by-step guideline available at https://github.com/arangrhie/merfin/wiki/Best-practices-for-Merfin. All data are publicly open for download with no restrictions.
Code Availability
A stable release and the C++ source code for Merfin, and examples from this work are available under Apache License 2.0 at GitHub (https://github.com/arangrhie/merfin) and Zenodo (https://doi.org/10.5281/zenodo.5527270)51. The only dependency is the k-mer counter Meryl, which comes with the release. Merfin can be run in five modes: 1) the -filter mode scores each variant, or variants within distance k and their combinations by error k-mers for improved genotyping; 2) the -completeness mode generates completeness metrics; 3) the -dump mode computes KC, KR, K* for each base in the assembly along with QV and QV* for each sequence; 4) the -hist mode provides a K* histogram and genome-wide QV and QV* averages; 5) the -polish mode scores each variant, or variants within distance k and their combinations by the K* for polishing. Merfin is fully parallelized using OpenMP. A combination of bash and Rscript used for data analysis and visualization is available at https://github.com/gf777/misc/tree/master/merfin/paper/figures.
Extended Data
Extended Data Fig. 1 |. Flowchart diagram of each mode in Merfin.
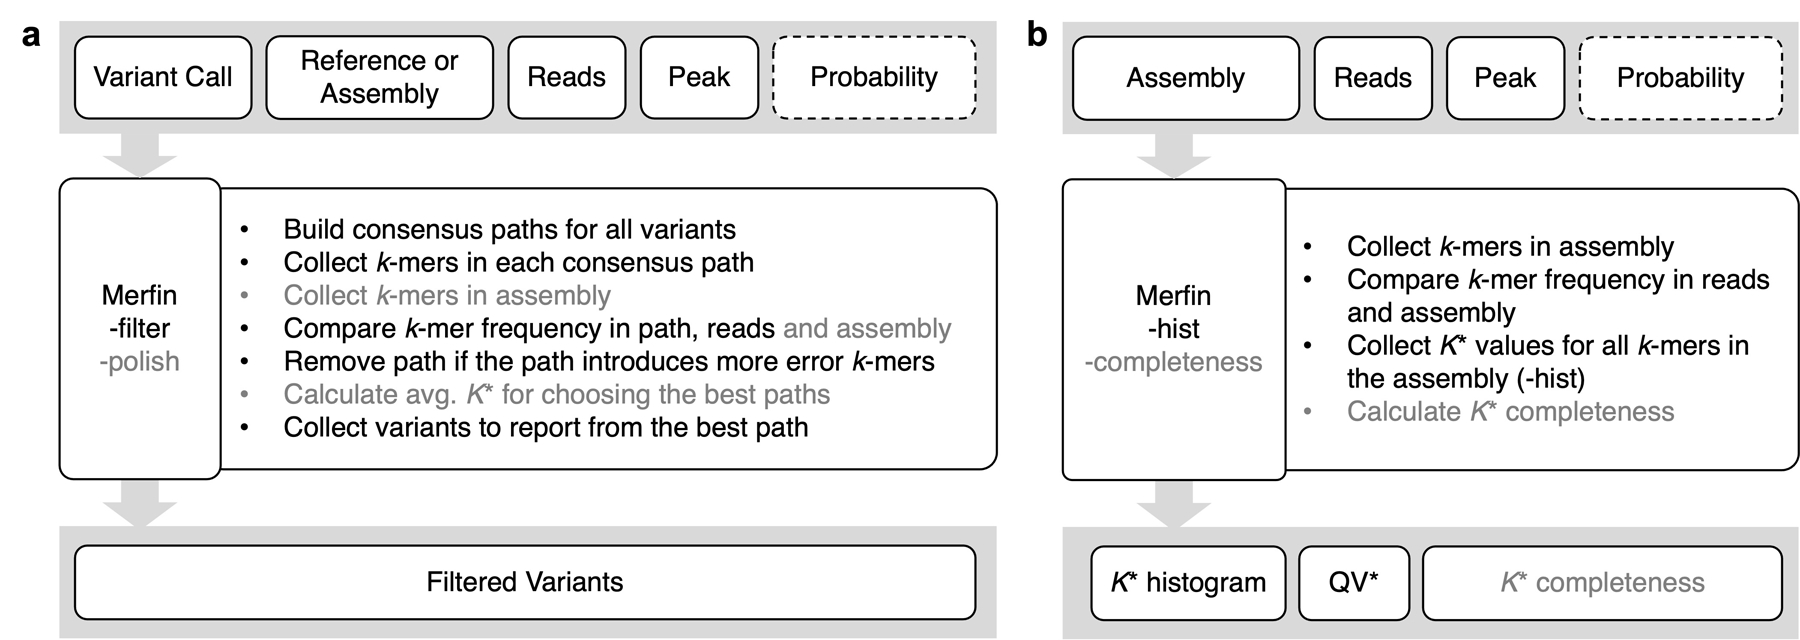
Text inside gray boxes on the top represents input files required (solid) or optional (dashed) for Merfin. a, genotyping (-filter) and polishing (-polish) modes. b, K* histogram (-hist) and K* completeness (-completeness) modes. Steps listed in bullet points are marked in gray if it is only applicable in -polish (a) or -completeness (b) mode.
Extended Data Fig. 2 |. Genome-wide density distribution of the K* using Illumina k-mers.
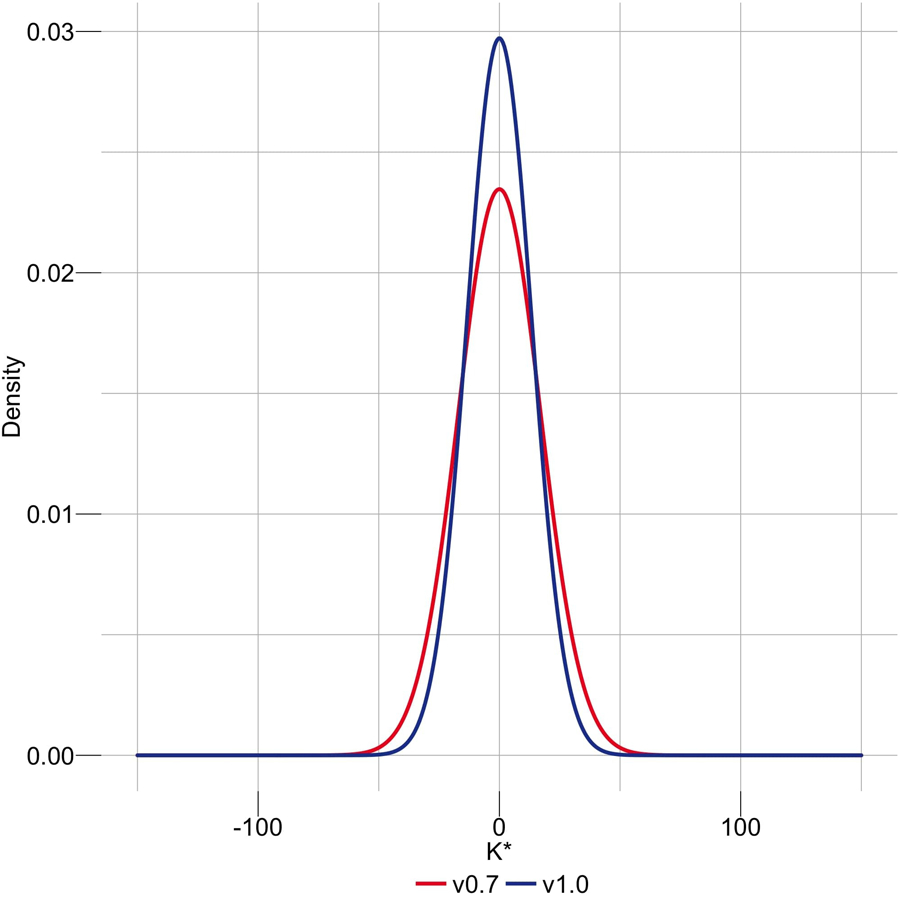
When the assembly is in agreement with the raw data, the K* is normally distributed with mean 0, and the smaller the standard deviation the higher the agreement. CHM13v1.0 shows a less dispersed distribution of the K* compared to a regular HiCanu assembly.
Extended Data Fig. 3 |. A region of negative K* highlighting sequencing bias.
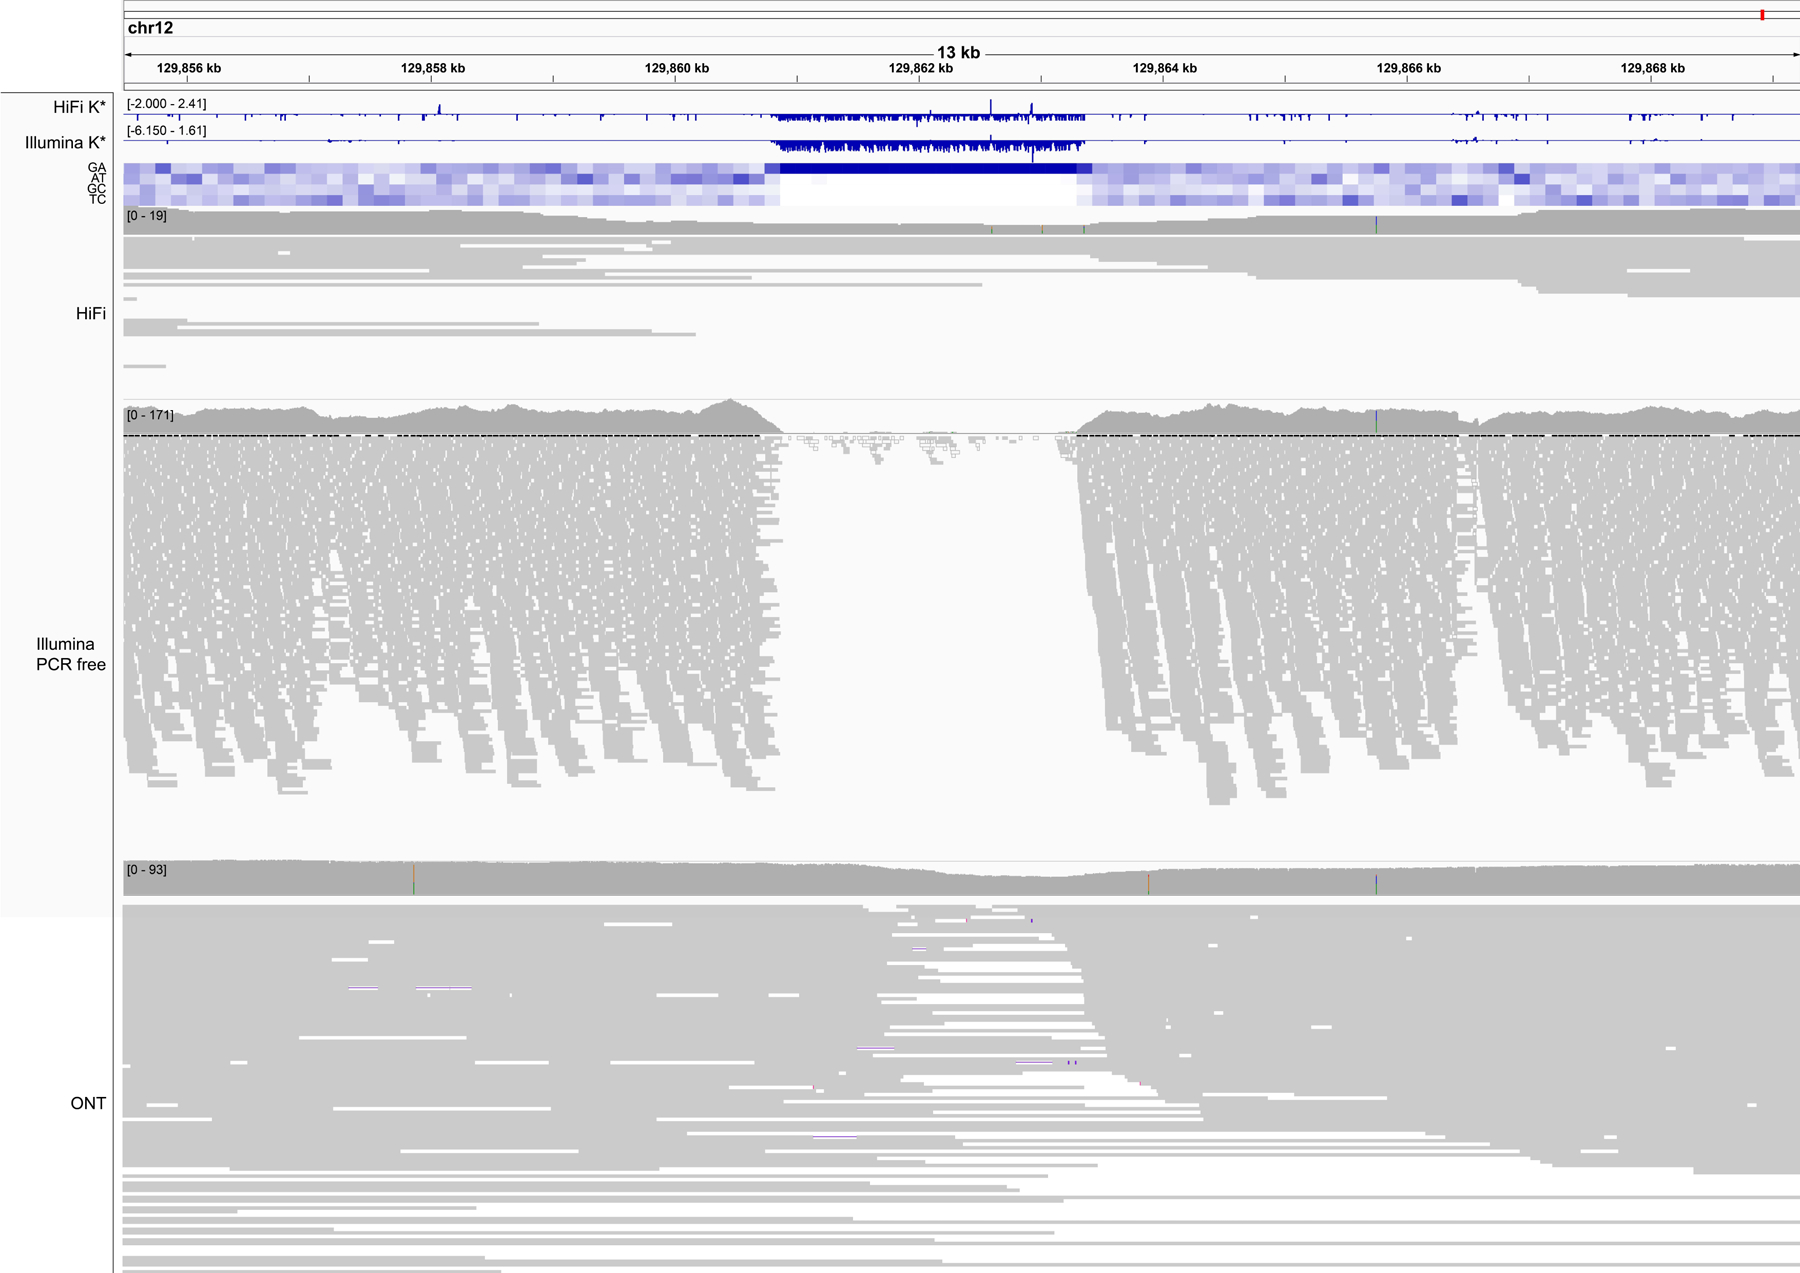
An example of low coverage in both HiFi and Illumina reads associated with high guanine content, and specifically a GA-rich repeat (heatmap). GA bias has been reported in PacBio HiFi data, and results in gaps in the assembly that in CHM13 were filled with Nanopore data22. The K* both from HiFi and Illumina k-mers (top tracks) recapitulate the coverage drop. Nanopore coverage appears less affected. Position Chr. 12:~129,862,000 bp.
Extended Data Fig. 4 |. The K* can identify issues in the assembly at the base level.
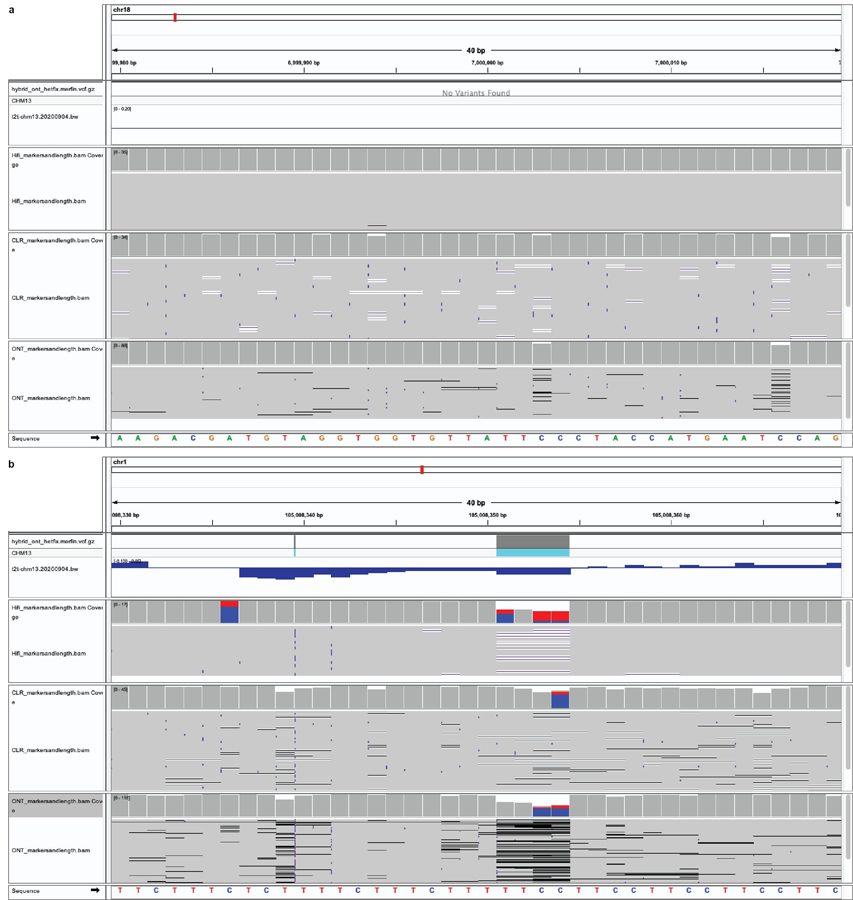
a, 40 bp window with K* close to 0, highlighting perfect agreement of the assembly with the raw reads. Position Chr18:~7,000,000 bp. b, A region of negative K* in coincidence with two heterozygous indels. Position Chr1:~105,008,350 bp.
Extended Data Fig. 5 |. Coverage titration experiment and impact on QV*.
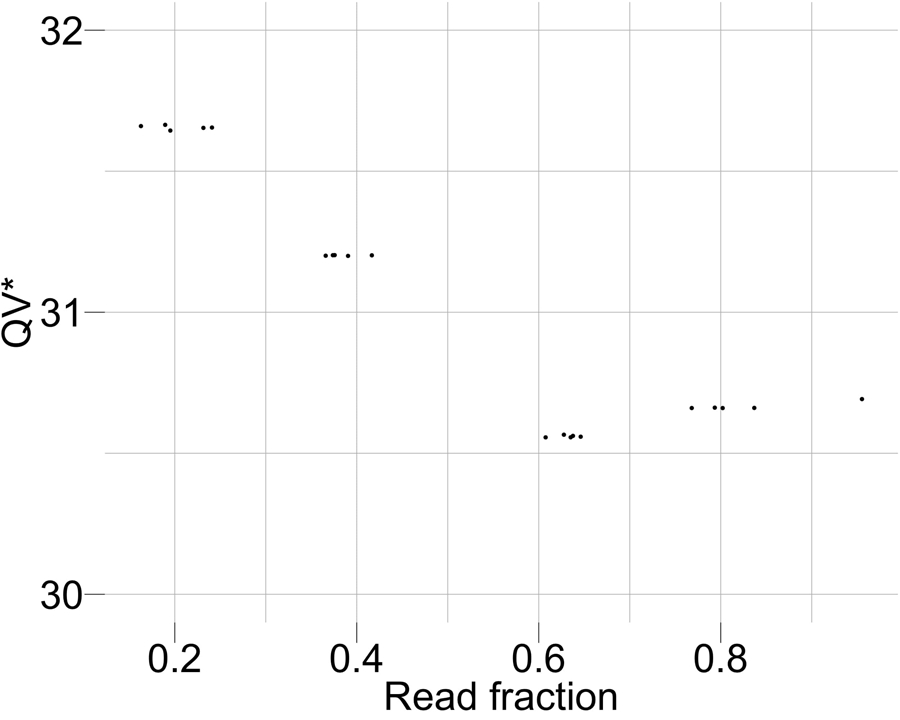
The QV* is only marginally influenced by the coverage of the dataset being considered.
Extended Data Fig. 6 |. Haplotype phasing before and after polishing with Merfin.
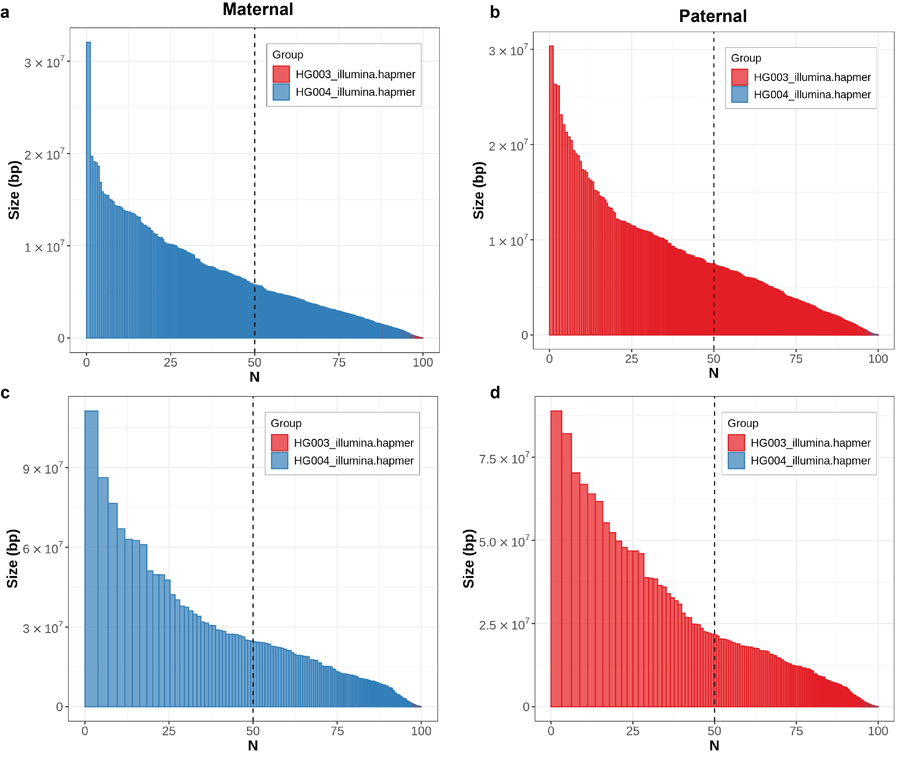
In both parental assemblies, the haplotypes remained fully phased, and the size of the blocks significantly increased compared to the unpolished version (a,b) after polishing with Merfin (c,d). A theoretical human genome size of 3.1 Gbp was used to normalize NG* values.
Extended Data Fig. 7 |. VGP assembly pipeline.
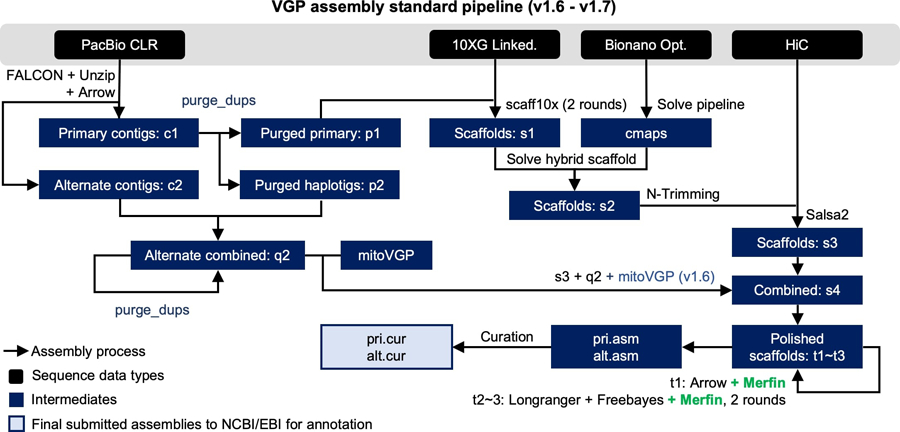
Compared to the previous v1.6, the introduction of Merfin in v1.7 (green) resulted in a minimal change of the workflow, but in a generalized improvement in QV scores and gene annotations. Pipeline available at https://github.com/VGP/vgp-assembly.
Extended Data Fig. 8 |. Phase block analysis of zebra finch pseudo-haploid assembly.
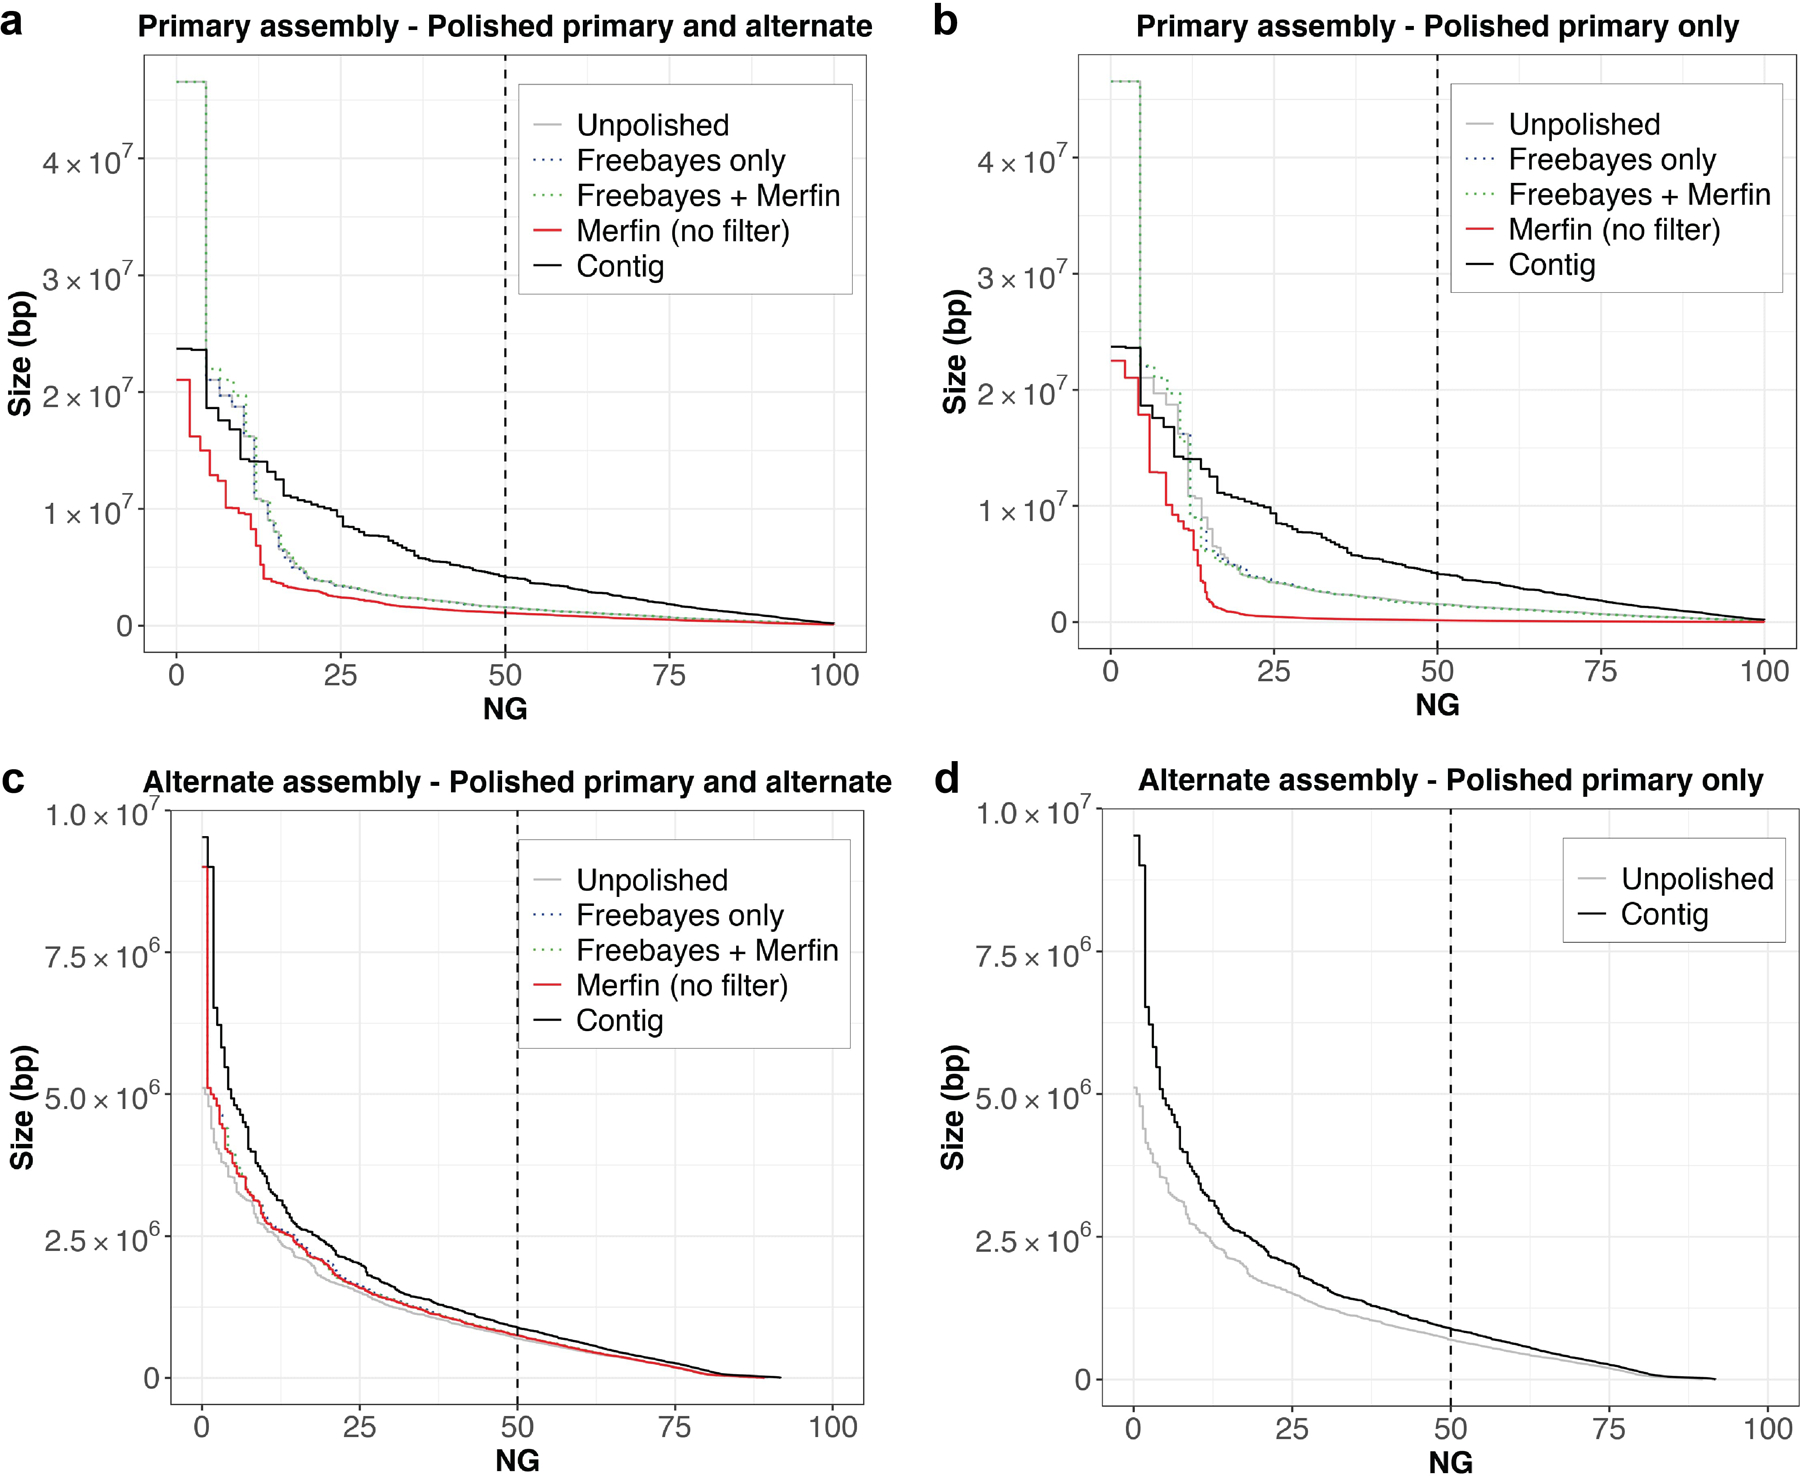
a, Phase blocks in the primary assembly after mapping the reads to both the primary and alternate assemblies. b, Phase blocks in the primary assembly after mapping the reads to both the primary only. c, Phase blocks in the alternate assembly after mapping the reads to both the primary and alternate assemblies. d, Phase blocks in the alternate assembly. In all cases, the application of Merfin filtering minor heterozygous variants (green) leads to block sizes better or comparable to prior polishing methods alone (blue). Unpolished assembly in gray. Results of Merfin without filtering in red. A genome size of ~1.03 Gbp derived from Genomescope2 was used to normalize NG* values.
Extended Data Fig. 9 |. Effect of merfin correction on the kinetochore scaffold 1 (KNL1) annotation.
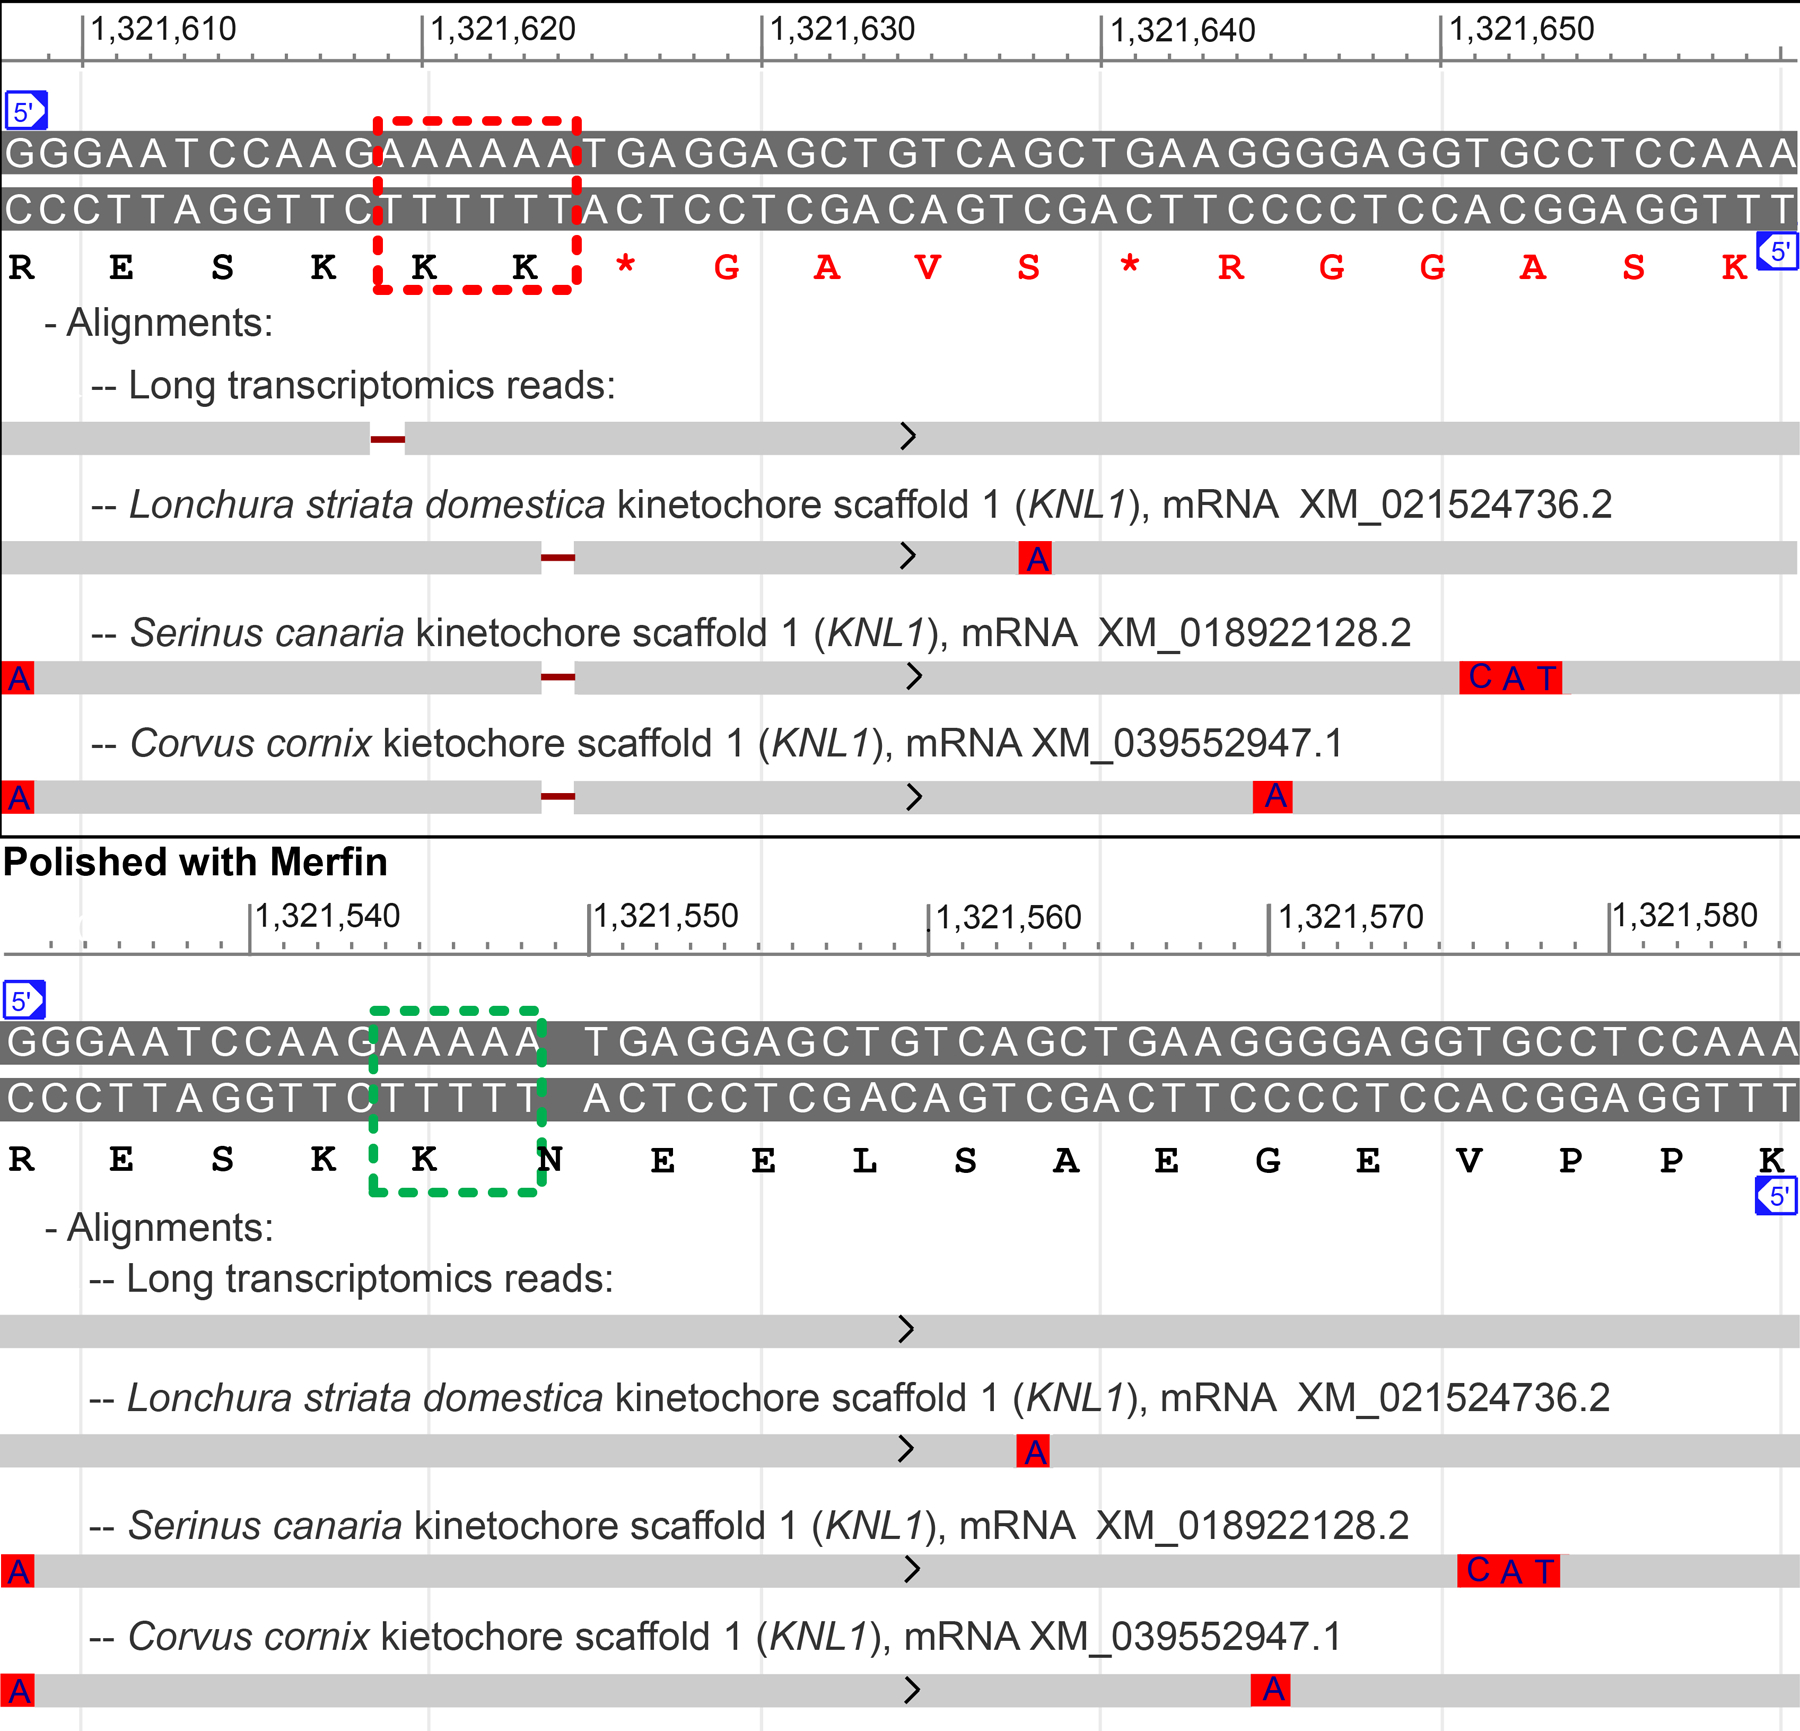
a, Deleterious presence of an extra A around position 1,321,620 of scaffold_7 (red box) in the polished, non-merfin-corrected sequence is indicated by a 1-base gap in the alignments of zebra finch PacBio IsoSeq SRR8695295.20794.1 and KNL1 transcripts from three other Passeriformes songbirds. This insertion causes a disruption in the frame and a premature stop codon in the translated sequence (see amino acid sequence in red). b, Corresponding span in the merfin-corrected assembly, with gapless alignments of the IsoSeq read and Passeriformes transcripts, and uninterrupted translation.
Supplementary Material
Acknowledgments
We thank T. Rhyker Ranallo-Benavidez and Michael C. Schatz for the useful discussion on adapting Genomescope2 models. We also thank the communities of the T2T, HPRC and VGP consortia for their constant support. G. F. and E. D. J were supported by Rockefeller University and HHMI funds. A. R., B. P. W., S. K, and A. M. P. were supported by the Intramural Research Program of the National Human Genome Research Institute, National Institutes of Health (1ZIAHG200398). The work of F.T-N was supported by the Intramural Research Program of the National Library of Medicine, National Institutes of Health. K.S. was supported by NIH/NHGRI (R01HG010485, U41HG010972, U01HG010961, U24HG011853, OT2OD026682). E.W.M. was partially supported by the German Federal Ministry of Education and Research (01IS18026C). Part of this work used the computational resources of the NIH HPC Biowulf cluster (https://hpc.nih.gov).
Footnotes
Competing Interests Statement
S.K. has received travel funds to speak at symposia organized by Oxford Nanopore. The remaining authors declare no competing interests.
References
- 1.Olson ND et al. precisionFDA Truth Challenge V2: Calling variants from short- and long-reads in difficult-to-map regions. bioRxiv 2020.11.13.380741 (2021) doi: 10.1101/2020.11.13.380741. [DOI] [PMC free article] [PubMed]
- 2.Koboldt DC Best practices for variant calling in clinical sequencing. Genome Med 12, 91 (2020). [DOI] [PMC free article] [PubMed] [Google Scholar]
- 3.Guo Y, Ye F, Sheng Q, Clark T & Samuels DC Three-stage quality control strategies for DNA re-sequencing data. Brief. Bioinform 15, 879–889 (2014). [DOI] [PMC free article] [PubMed] [Google Scholar]
- 4.Giani AM, Gallo GR, Gianfranceschi L & Formenti G Long walk to genomics: History and current approaches to genome sequencing and assembly. Comput. Struct. Biotechnol. J 18, 9–19 (2020). [DOI] [PMC free article] [PubMed] [Google Scholar]
- 5.Rhie A et al. Towards complete and error-free genome assemblies of all vertebrate species. Nature 592, 737–746 (2021). [DOI] [PMC free article] [PubMed] [Google Scholar]
- 6.Wenger AM et al. Accurate circular consensus long-read sequencing improves variant detection and assembly of a human genome. Nat. Biotechnol 37, 1155–1162 (2019). [DOI] [PMC free article] [PubMed] [Google Scholar]
- 7.Watson M & Warr A Errors in long-read assemblies can critically affect protein prediction. Nature biotechnology vol. 37 124–126 (2019). [DOI] [PubMed] [Google Scholar]
- 8.Nurk S et al. HiCanu: accurate assembly of segmental duplications, satellites, and allelic variants from high-fidelity long reads. Genome Res 30, 1291–1305 (2020). [DOI] [PMC free article] [PubMed] [Google Scholar]
- 9.Walker BJ et al. Pilon: an integrated tool for comprehensive microbial variant detection and genome assembly improvement. PLoS One 9, e112963 (2014). [DOI] [PMC free article] [PubMed] [Google Scholar]
- 10.Hepler NL, Delaney N, Brown M, Smith ML, Katzenstein D, Paxinos EE, Alexander D. An Improved Circular Consensus Algorithm with an Application to Detect HIV-1 Drug-Resistance Associated Mutations (DRAMs). Poster presentation
- 11.Vaser R, Sović I, Nagarajan N & Šikić M Fast and accurate de novo genome assembly from long uncorrected reads. Genome Res 27, 737–746 (2017). [DOI] [PMC free article] [PubMed] [Google Scholar]
- 12.McKenna A et al. The Genome Analysis Toolkit: a MapReduce framework for analyzing next-generation DNA sequencing data. Genome Res 20, 1297–1303 (2010). [DOI] [PMC free article] [PubMed] [Google Scholar]
- 13.Garrison E & Marth G Haplotype-based variant detection from short-read sequencing. arXiv [q-bio.GN] (2012).
- 14.Poplin R et al. A universal SNP and small-indel variant caller using deep neural networks. Nat. Biotechnol 36, 983–987 (2018). [DOI] [PubMed] [Google Scholar]
- 15.Li H A statistical framework for SNP calling, mutation discovery, association mapping and population genetical parameter estimation from sequencing data. Bioinformatics 27, 2987–2993 (2011). [DOI] [PMC free article] [PubMed] [Google Scholar]
- 16.Rhie A, Walenz BP, Koren S & Phillippy AM Merqury: reference-free quality, completeness, and phasing assessment for genome assemblies. Genome Biol 21, 245 (2020). [DOI] [PMC free article] [PubMed] [Google Scholar]
- 17.Mapleson D, Garcia Accinelli G, Kettleborough G, Wright J & Clavijo BJ KAT: a K-mer analysis toolkit to quality control NGS datasets and genome assemblies. Bioinformatics 33, 574–576 (2017). [DOI] [PMC free article] [PubMed] [Google Scholar]
- 18.Kundu R, Casey J & Sung W-K HyPo: Super Fast & Accurate Polisher for Long Read Genome Assemblies. Cold Spring Harbor Laboratory 2019.12.19.882506 (2019) doi: 10.1101/2019.12.19.882506. [DOI]
- 19.Jain C et al. Weighted minimizer sampling improves long read mapping. Bioinformatics 36, i111–i118 (2020). [DOI] [PMC free article] [PubMed] [Google Scholar]
- 20.Jain C, Rhie A, Hansen N, Koren S & Phillippy AM A long read mapping method for highly repetitive reference sequences. bioRxiv 2020.11.01.363887 (2020) doi: 10.1101/2020.11.01.363887. [DOI] [PMC free article] [PubMed]
- 21.Phillippy AM, Schatz MC & Pop M Genome assembly forensics: finding the elusive mis-assembly. Genome Biol 9, R55 (2008). [DOI] [PMC free article] [PubMed] [Google Scholar]
- 22.Nurk S et al. The complete sequence of a human genome. bioRxiv (2021).
- 23.Vollger Mitchell R., Guitart Xavi, Dishuck Philip C., Mercuri Ludovica, Harvey William T., Gershman Ariel, Diekhans Mark, Sulovari Arvis, Munson Katherine M., Lewis Alexandra M., Hoekzema Kendra, Porubsky David, Li Ruiyang, Nurk Sergey, Koren Sergey, Miga Karen H., Phillippy Adam M., Timp Winston, Ventura Mario, Eichler Evan E. Segmental duplications and their variation in a complete human genome. bioRxiv (2021). [DOI] [PMC free article] [PubMed]
- 24.Gershman A et al. Epigenetic patterns in a complete human genome. bioRxiv (2021). [DOI] [PMC free article] [PubMed]
- 25.Cartney Mc, Alonge Michael +, Jain Chirag, Formenti Giulio, Fungtammasan Arkarachai, Shafin Kishwar, Paten Benedict, Miga Karen H., Bzikadze Andrey V., Mikheenko Alla, Logsdon Glennis A., Wood Jonathan MD, Howe Kerstin, Shumate Alaina, Sović Ivan, Zook Justin M., Koren Sergey, Phillippy Adam M., Rhie Arang, A. M. Chasing Perfection: Validation and Polishing Strategies for Telomere-to-Telomere Genome Assemblies. biorxiv (2021). [DOI] [PMC free article] [PubMed]
- 26.Krusche P et al. Best practices for benchmarking germline small-variant calls in human genomes. Nat. Biotechnol 37, 555–560 (2019). [DOI] [PMC free article] [PubMed] [Google Scholar]
- 27.Ranallo-Benavidez TR, Jaron KS & Schatz MC GenomeScope 2.0 and Smudgeplot for reference-free profiling of polyploid genomes. Nat. Commun 11, 1432 (2020). [DOI] [PMC free article] [PubMed] [Google Scholar]
- 28.Cheng H, Concepcion GT, Feng X, Zhang H & Li H Haplotype-resolved de novo assembly using phased assembly graphs with hifiasm. Nat. Methods 18, 170–175 (2021). [DOI] [PMC free article] [PubMed] [Google Scholar]
- 29.Huddleston J et al. Discovery and genotyping of structural variation from long-read haploid genome sequence data. Genome Res 27, 677–685 (2017). [DOI] [PMC free article] [PubMed] [Google Scholar]
- 30.Miga KH et al. Telomere-to-telomere assembly of a complete human X chromosome. Nature 585, 79–84 (2020). [DOI] [PMC free article] [PubMed] [Google Scholar]
- 31.Zook JM et al. Extensive sequencing of seven human genomes to characterize benchmark reference materials. Scientific data vol. 3 160025 (2016). [DOI] [PMC free article] [PubMed] [Google Scholar]
- 32.Kolmogorov M, Yuan J, Lin Y & Pevzner PA Assembly of long, error-prone reads using repeat graphs. Nat. Biotechnol 37, 540–546 (2019). [DOI] [PubMed] [Google Scholar]
- 33.Koren S et al. De novo assembly of haplotype-resolved genomes with trio binning. Nat. Biotechnol (2018) doi: 10.1038/nbt.4277. [DOI] [PMC free article] [PubMed]
- 34.Li H et al. A synthetic-diploid benchmark for accurate variant-calling evaluation. Nat. Methods 15, 595–597 (2018). [DOI] [PMC free article] [PubMed] [Google Scholar]
- 35.Wagner J et al. Benchmarking challenging small variants with linked and long reads. bioRxiv 2020.07.24.212712 (2020) doi: 10.1101/2020.07.24.212712. [DOI] [PMC free article] [PubMed]
- 36.Chin C-S et al. Phased diploid genome assembly with single-molecule real-time sequencing. Nat. Methods 13, 1050–1054 (2016). [DOI] [PMC free article] [PubMed] [Google Scholar]
- 37.O’Leary NA et al. Reference sequence (RefSeq) database at NCBI: current status, taxonomic expansion, and functional annotation. Nucleic Acids Res 44, D733–45 (2016). [DOI] [PMC free article] [PubMed] [Google Scholar]
- 38.Gnomon - the NCBI eukaryotic gene prediction tool. https://www.ncbi.nlm.nih.gov/genome/annotation_euk/gnomon/.
- 39.Fofanov Y et al. How independent are the appearances of n-mers in different genomes? Bioinformatics 20, 2421–2428 (2004). [DOI] [PubMed] [Google Scholar]
- 40.Zhao X, Weber AM & Mills RE A recurrence-based approach for validating structural variation using long-read sequencing technology. Gigascience 6, 1–9 (2017). [DOI] [PMC free article] [PubMed] [Google Scholar]
- 41.Mc Cartney AM et al. Chasing perfection: validation and polishing strategies for telomere-to-telomere genome assemblies. bioRxiv 2021.07.02.450803 (2021) doi: 10.1101/2021.07.02.450803. [DOI] [PMC free article] [PubMed]
- 42.Benjamini Y & Speed TP Summarizing and correcting the GC content bias in high-throughput sequencing. Nucleic Acids Res 40, e72 (2012). [DOI] [PMC free article] [PubMed] [Google Scholar]
- 43.Yang C et al. Evolutionary and biomedical insights from a marmoset diploid genome assembly. Nature (2021) doi: 10.1038/s41586-021-03535-x. [DOI] [PMC free article] [PubMed]
- 44.Cheng H, Concepcion GT, Feng X, Zhang H & Li H Haplotype-resolved de novo assembly with phased assembly graphs. arXiv [q-bio.GN] (2020). [DOI] [PMC free article] [PubMed]
Methods References
- 45.Robinson JT et al. Integrative genomics viewer. Nat. Biotechnol 29, 24–26 (2011). [DOI] [PMC free article] [PubMed] [Google Scholar]
- 46.Morgulis A, Gertz EM, Schäffer AA & Agarwala R WindowMasker: window-based masker for sequenced genomes. Bioinforma. Oxf. Engl 22, 134–141 (2006). [DOI] [PubMed] [Google Scholar]
- 47.Altschul SF, Gish W, Miller W, Myers EW & Lipman DJ Basic local alignment search tool. J. Mol. Biol 215, 403–410 (1990). [DOI] [PubMed] [Google Scholar]
- 48.Kapustin Y, Souvorov A, Tatusova T & Lipman D Splign: algorithms for computing spliced alignments with identification of paralogs. Biol. Direct 3, 20 (2008). [DOI] [PMC free article] [PubMed] [Google Scholar]
- 49.Lowe TM & Eddy SR tRNAscan-SE: a program for improved detection of transfer RNA genes in genomic sequence. Nucleic Acids Res 25, 955–964 (1997). [DOI] [PMC free article] [PubMed] [Google Scholar]
- 50.Nawrocki EP et al. Rfam 12.0: updates to the RNA families database. Nucleic Acids Res 43, D130–137 (2015). [DOI] [PMC free article] [PubMed] [Google Scholar]
- 51.Formenti G, Rhie A & Walenz B arangrhie/merfin: merfin v1.0 (Zenodo, 2021). 10.5281/zenodo.5527270. [DOI] [Google Scholar]
Associated Data
This section collects any data citations, data availability statements, or supplementary materials included in this article.
Supplementary Materials
Data Availability Statement
HG002 variant call data was downloaded from https://data.nist.gov/od/id/mds2-2336 (SEX9X, NFT0L, 23O09, and QUE7Q). Sequencing data and assemblies for CHM13, HG002, and VGP genomes are available at https://github.com/marbl/CHM13, https://github.com/human-pangenomics/HG002_Data_Freeze_v1.0 and https://vgp.github.io/.
Source data used for generating all figures in this manuscript are available at https://github.com/gf777/misc/tree/master/merfin/paper/figures.
The K* tracks for HiFi and Illumina of the CHM13 are browsable in the associated UCSC browser (http://genome.ucsc.edu/cgi-bin/hgTracks?db=hub_2395475_t2t-chm13-v1.1). All variant calls used in the genotyping benchmarks, k-mer databases, fitted histogram tables and K* tracks are available to download at https://s3-us-west-2.amazonaws.com/human-pangenomics/index.html?prefix=publications/MERFIN_2021/ with a step-by-step guideline available at https://github.com/arangrhie/merfin/wiki/Best-practices-for-Merfin. All data are publicly open for download with no restrictions.


