Abstract
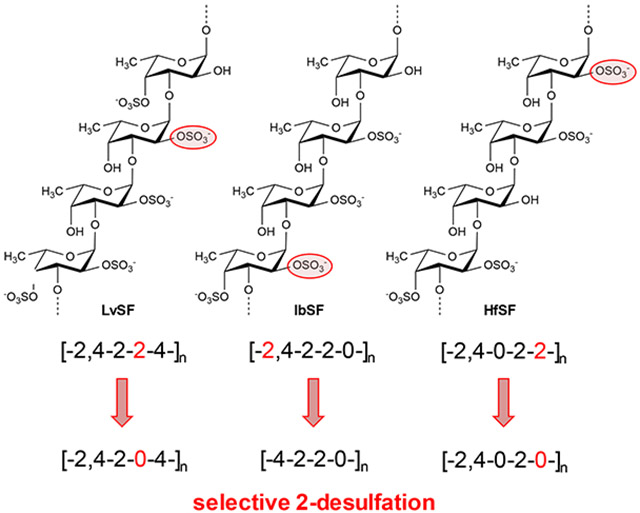
Sulfated fucans (SFs) from echinoderms, such as sea cucumbers and sea urchins, present linear and regular sulfation patterns within defined oligosaccharide building blocks. The high molecular weights of these polymers pose a problem in advanced structure-activity relationship studies for which derived oligosaccharides are more appropriate tools for investigation. However, enzymes capable of specifically depolymerizing SFs, fucanases, are not very common. Scarce abundance and unknown catalytic activities are additional barriers to exploiting fucanases. Oligosaccharide production by controlled chemical reactions such as mild acid hydrolysis then becomes a convenient strategy. As a consequence, physicochemical studies are necessary to understand the structural modifications caused on SFs by this chemical hydrolysis. Hence, in this work, we subjected three tetrasaccharide-repeating SFs from sea cucumbers, Isostichopus badionotus (IbSF), Holothuria floridana (HfSF), and Lytechinus variegatus (LvSF) to mild acid hydrolysis for oligosaccharide production. Interestingly, selective 2-desulfation reaction was observed in all three SFs. Through our study, we indicate that selective 2-desulfation is a common and expected phenomenon in oligosaccharide production by mild acid hydrolysis of SFs, including those composed of tetrasaccharide-repeating units.
Keywords: Mass spectrometry, mild acid hydrolysis, molecular dynamics, nuclear magnetic resonance, stereospecific desulfation, sulfated fucans
Graphical Abstract
1. Introduction
Fucose (Fuc)-rich sulfated polysaccharides can be divided into two main groups depending on the complexity of their structures. These groups are namely fucoidans, commonly found in brown algae, and sulfated fucans (SFs), more commonly found in marine invertebrate animals (Pomin & Mourão, 2008). As opposed to structurally complex brown algal fucoidans (Li et al., 2008; Luthuli et al., 2019; Pereira et al., 1999; Pomin & Mourão, 2008), sulfated fucans (SFs) found in echinoderms such as sea cucumbers and sea urchins present regular structures composed of defined repeating oligosaccharide building blocks (Berteau & Mulloy, 2003; Pereira et al., 1999; Pomin & Mourão, 2008). These building blocks present the following structural features: (i) glycosidic linkage at positions C3 or C4, (ii) α anomeric configuration in the composing Fuc units, (iii) oligomeric length varying from mono to tetrasaccharide Fuc units, (iv) sulfation patterns occurring at Fuc ring positions C2 and/or C4, and (v) structural occurrence in a species-specific manner (Pomin & Mourão, 2008).
Marine invertebrate SFs exert various biological activities including anticoagulation (Pereira et al., 2002; Pereira et al., 1999), antivirus (Dwivedi et al., 2021), and anticancer (Teixeira et al., 2018), besides being structural and functional components in the holothurian body cell walls (Panagos et al., 2014) and egg jelly coat of female gametes in sea urchins (Vilela-Silva et al., 2002). In this latter case, the sea urchin SFs participate in species-specific regulation of the acrosome reaction during the fertilization process (Biermann et al., 2004). Although these glycans enable advanced structure-activity relationship studies due to their regular sulfation patterns and repetitive oligosaccharide units (Pereira et al., 2002; Pereira et al., 1999; Pomin & Mourão, 2008), their high molecular weights (MW), usually above 100 kDa, pose an issue in biophysical investigations where medium-size oligosaccharides seem more appropriate (Bezerra et al., 2020; Queiroz et al., 2014). Depolymerization of SFs is then necessary to achieve oligosaccharide production. Currently, two major ways exist to accomplish this goal, degradation by enzymes, called fucanases, and chemical hydrolysis. Although descriptions of specific fucanases capable of cleaving SFs exist in the literature (Chen et al., 2021; Colin et al., 2006; Shen et al., 2020), their exploitation is difficult due to multiple factors, including limited availability and unknown biochemical and catalytic properties. Hence, the method of chemical hydrolysis is by far the most common and preferable way (Bezerra et al., 2020; Li et al., 2022; Ning et al., 2022; Pomin et al., 2004; Pomin et al., 2005; Queiroz et al., 2014).
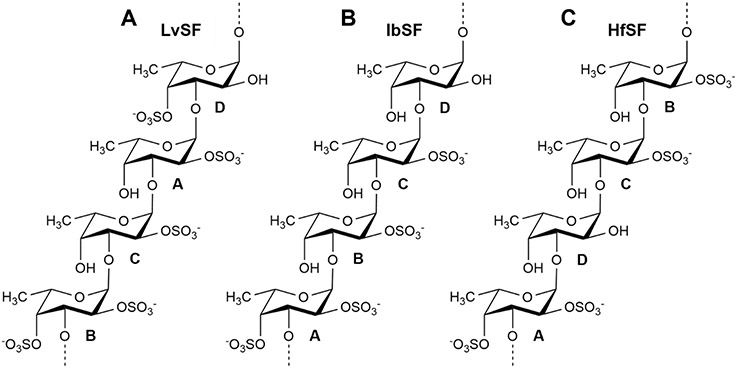
In our previous work of oligosaccharide preparation by mild acid hydrolysis of the 3-linked tetrasaccharide-repeating SF from the sea urchin Lytechinus variegatus (LvSF), we were able to identify a selective 2-desulfation during the reaction (Pomin et al., 2004; Pomin et al., 2005). The LvSF structure is depicted in Figure 1A. Its sulfation code can be written as [2,4-2-2-4]n. In this work, using multiple analytical techniques, we produced and characterized oligosaccharides from two other tetrasaccharide-repeating SFs from the sea cucumbers Isostichopus badionotus (IbSF) and Holothuria floridana (HfSF), also by mild acid hydrolysis. The structures of IbSF and HfSF are depicted in Figures 1B and 1C, respectively. The sulfation code of these two molecules are respectively [2,4-2-2-0]n and [2,4-0-2-2]n. Interestingly, selective 2-desulfation was noted again on both IbSF and HfSF. We hypothesize that selective 2-desulfation is a common and expected phenomenon in oligosaccharide production of regular SFs by mild acid hydrolysis of SFs, including those composed of tetrasaccharide-repeating units.
Fig. 1.
Structure of sulfated α-L-fucans (SFs) from (A) the sea urchin Lytechinus variegatus (LvSF), and sea cucumbers (B) Isostichopus badionotus (IbSF) and (C) Holothuria floridana (HfSF). They are composed of 3-linked α-L-fucose units with 2- and/or 4- sulfation substitutions within repeating tetrasaccharide building blocks. The four types of fucose units are indicated by the letters A-D in each structure. The sulfation patterns of these SFs are (A) [2,4-2-2-4]n, (B) [2,4-2-2-0]n, and (C) [2,4-0-2-2]n.
2. Materials and methods
2.1. Materials
Hydrochloric acid (# 320331, Sigma-Aldrich, St. Louis, MO, USA) and sulfuric acid (# 258105, Sigma-Aldrich, St. Louis, MO, USA) were used for mild acid hydrolysis. Dialysis (# 9201735, Spectra Por, Waltham, MA, USA) was used for de-salting after isolation of sulfated fucans through anion-exchange chromatography. Bio-Gel P-10 resin (# 150-4144, Bio-Rad Laboratories, Hercules, CA, USA) and chromatography column (1.5 x 170 cm, # 7371598, Bio-Rad Laboratories) were employed for size-exclusion chromatography of hydrolyzed sulfated fucan fragments. Sephadex G-15 resin (# G15120-10G, Sigma-Aldrich) and chromatography column (1.5 x 50 cm, # 7376607, Bio-Rad Laboratories) were used for de-salting of sulfated fucans fragments. Chromatographic columns were connected to a peristaltic pump (# P-1, Pharmacia Fine Chemicals, Piscataway, NJ, USA) to control the flow rate. Fractions from anion-exchange chromatography and SEC were collected using a fraction collector (# 2110, Bio-Rad Laboratories). After each chromatography, samples were dried by lyophilization (# 7522900, Labconco, Kansas, MO, USA). 1,9-dimethylmethylene blue (DMB) was used for the metachromatic assay. The power supply (# E0304, Edison, NJ, USA) and electrophoresis kit (# 1658001, Bio-Rad Laboratories) were employed in polyacrylamide gel electrophoresis (PAGE). An ELISA reader (# SpectraMax ABS, San Jose, CA, USA) was used to measure the absorbance (525 nm) in the DMB assay. LCMS grade acetonitrile and water were purchased from Fisher Scientific (Fair Lawn, NJ, USA). Ammonium acetate was purchased from Fisher Scientific (Fair Lawn, NJ, USA).
2.2. Extraction of holothurian SFs
The sea cucumbers I. badionotus and H. floridana were purchased from the Gulf Specimen Lab (Gulf of Mexico, Florida Keys). The sulfated fucans of IbSF and HfSF were isolated from the body wall of the sea cucumbers following a modified protocol to that reported (Chen et al., 2012; Chen et al., 2011; Shi et al., 2019). The dried (lyophilized) holothurian body walls were individually suspended in 0.1 mol/dm3 sodium acetate (# S22040, RPI, Mt. Prospect, IL, USA) buffer (pH 6.0) with papain from papaya latex (1.0 mg papain/g tissue) (# P4762, Sigma-Aldrich), 5 mM EDTA (# 03609, Sigma-Aldrich), and 5 mol/cm3 cysteine (# C7352, Sigma-Aldrich), and incubated at 60 °C for 24 h. The digested mixture was centrifuged (4000 rpm for 30 min), and the supernatant was precipitated using two volumes of 95% ethanol at 20 °C. After 24 h, a precipitate was obtained by centrifugation at 4000 rpm for 30 min. The precipitate was dissolved in water and dialyzed three times against distilled water prior to lyophilization to obtain the dry extract.
2.3. Isolation and purification of SFs
The purification was performed using the method previously reported (Dwivedi et al., 2021). The crude polysaccharides of I. badionotus and H. floridana were subjected to anion-exchange chromatography using a DEAE Sephacel (# 17-0500-01, Cytiva, Marlborough, MA, USA) column (2.5 x 20 cm, # Bio-Rad Laboratories) equilibrated with 0.1 mol/dm3 sodium acetate buffer (pH 6.0) with 3 mol/dm3 NaCl as the second mobile phase to generate a salt gradient. The gradient produced by a gradient mixer (# GM-1, Pharmacia Fine Chemicals, Uppsala, Sweden) was applied over 24 h and ranged from 0 to 3 mol/dm3 NaCl in 0.1 mol/dm3 sodium acetate. The flow rate was set to 18 cm3/10 min/fraction for IbSF and 9 cm3/10 min/fraction for HfSF and the fractions were collected in a fraction collector (# 2110, Bio-Rad Laboratories). Fractions of different anionic content were monitored by DMB (Farndale et al., 1982). The IbSF and HfSF fractions were also monitored for the presence of hexoses using phenol-H2SO4 reactions (DuBois et al., 1956), uronic acids using the Carbazole reaction (Cesaretti et al., 2003) and sialic acids using the Ehrlich assay (Warren, 1959) (data not shown).
2.4. Depolymerization of IbSF
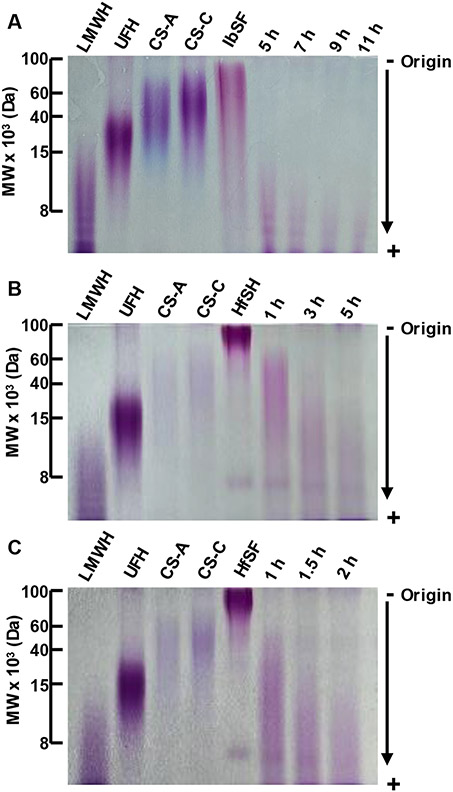
Mild acid hydrolysis conditions were optimized by incubating a 1.0 mg/cm3 IbSF solution in 0.05 mol/dm3 H2SO4 at 60 °C for 5, 7, 9 and 11 h (Chen et al., 2012). After hydrolysis, samples were neutralized by adding 1.0 cm3 of ice-cold 0.05 mol/dm3 NaOH. Depolymerized IbSF were analyzed by PAGE (22%) to determine the MW distributions of each time course (Fig. 2). From the results, the 9 h hydrolysis time was selected as showing suitable molecular distribution by PAGE. This unfractionated hydrolyzed IbSF sample was named hIbSF. The process was scaled up for the preparation of 30.0 mg of hIbSF dissolved in 6.0 cm3 of 0.1 mol/dm3 H2SO4 for 9 h. The pH was adjusted to 7.0 by the addition of 6.0 cm3 of 0.1 mol/dm3 NaOH.
Fig. 2.
Mild acid hydrolysis of (A) I. badionotus and (B and C) H. floridana sulfated fucans (IbSF and HfSF) analyzed by 22% polyacrylamide gel. Hydrolysis conditions were (A) 0.05 mol/dm3 H2SO4 at 60 °C for 5, 7, 9, and 11 h to IbSF, (B) 0.01 mol/dm3 HCl at 60 °C for 1, 3 and 5 h to HfSF, and (C) 0.05 mol/dm3 H2SO4 at 60 °C for 1, 1.5 and 2 h. Samples (10 μg each) were stained with toluidine blue after adequate electrophoretic migration. Molecular weight (MW) markers include low molecular weight heparin (LMWH) (MW ~ 8 kDa), unfractionated heparin (UFH) (MW ~ 15 kDa), chondroitin sulfate-A (CS-A) (MW~ 40 kDa), and chondroitin sulfate-C (CS-C) (MW ~ 60 kDa).
2.5. Depolymerization of HfSF
Mild acid hydrolysis for partial depolymerization of HfSF was carried out at 60 °C with 0.05 mol/dm3 H2SO4 for 1, 1.5 and 2 h and 0.01 mol/dm3 HCl for 1, 3 and 5 h. The sample/solvent ratio was designed with 5.0 mg/cm3 then neutralized by adding 0.05 mol/dm3 and 0.01 M NaOH, respectively. The depolymerized HfSF products were analyzed by PAGE (22%). From the results, the 5 h hydrolysis time with 0.01 mol/dm3 HCl was selected as showing suitable MW distribution by PAGE. This unfractionated hydrolyzed HfSF sample was named hHfSF. The process was scaled up for the preparation of 27.3 mg hHfSF dissolved in 5.5 cm3 of 0.01 mol/dm3 HCl for 5 h. The pH was adjusted to 7.0 by the addition of 5.5 cm3 of 0.01 mol/dm3 NaOH.
2.6. PAGE
The MW distribution of all sulfated polysaccharides and oligosaccharides were applied to a 22% polyacrylamide gel slab in 250 mM Tris and 1.92 M glycine running buffer (pH 8.3) and run for 15 min at 60 V followed by 110 min at 100 V. After electrophoretic migration, 0.1% toluidine blue in 1% acetic acid was used to stain the sulfated polysaccharides and oligosaccharides, which were then destained for 8 h using 1% acetic acid. The MW distribution has been compared with various standard compounds of known MWs, low molecular weight of heparin (LMWH, ~7.5 kDa), unfractionated heparin (UFH, ~15 kDa), chondroitin sulfate A (CS A, ~40 kDa), and chondroitin sulfate C (CS C, ~60 kDa).
2.7. SEC
The selected hydrolyzed IbSF and HfSF materials were fractionated by SEC on a Bio-Gel P-10 column (1.0 cm3/15 min/fraction) with 10% ethanol containing 1.0 M NaCl following the protocol of previous work (Bezerra et al., 2020; Pomin et al., 2004; Pomin et al., 2005; Queiroz et al., 2014). The collected fractions were measured for metachromatic assay using DMB (Farndale et al., 1982). The major fractions of hIbSF and hHfSF were desalted using a Sephadex G-15 column (1.0 x 30 cm) eluted with distilled H2O. Derived fractions were analyzed by 1D and 2D NMR.
2.8. HILIC-MS
The fractions (IbSF and HfSF Fr 5) were dissolved in 90% acetonitrile and injected into an Acquity UPLC BEH amide HILIC column (130 Å, 1.7 μm, 1.0 mm X 50 mm) at 80 mm3/min. The fractions were separated using solvent A (water with 10 mM ammonium acetate) and solvent B (acetonitrile with 2% of solvent A). The gradient consisted of starting with 90% solvent B to 30% B in 15 min, hold at 30% B for 8 min and returned to 85% B in 2 min and equilibrate the column at 85% B for 10 min. The fractions eluting from the column were analyzed by Orbitrap Exploris 240 system coupled to Dionex Ultimate 3000 (Thermo Fisher, San Jose, CA). The source voltage was set at 3300 V and the data was collected in negative ion mode. The ion transfer tube temp was 200 °C and the vaporization temp was set to 100 °C. MS1 data was collected at Orbitrap resolution of 60000 in the profile mode. MS/MS was performed for the top ten parent ions with HCD fragmentation energy set to 30%. The MS/MS data was collected in profile mode in Orbitrap resolution of 30000. The MS experiments were first optimized by running a highly sulfated standard (Arixtra) to confirm that the sulfation compositions of the oligosaccharides remained intact during ionization and that sulfate loss was a result of the mild acid hydrolysis and did not happen during ionization for ESI MS. This was further confirmed by having the LC peaks eluting at different retention times.
2.9. NMR
1D (1H NMR) and 2D (1H-13C HSQC) spectra were recorded using a Bruker Avance III HD 500 MHz with 5 mm prodigy H/F-BBO cryoprobe. Native and depolymerized sulfated fucan were dissolved in 150-200 mm3 of 99.9% D2O (CIL, Tewksbury, MA, USA). Samples were prepared in 3 mm and 5 mm NMR tubes for the data acquisition. Spectra were acquired at 25 and 50 °C by the BCU-I temperature control unit using a 90° experiment with a receiver gain from 69 to 99 for 1H spectra and to 189 for the 1H-13C HSQC. The total number of scans used was 256 for 1H and 128 for 1H-13C HSQC for the complete acquisition. The post-acquisition data processing was performed using zero-filling of the 64K free induction decay data points for 1H spectra, 1024 × 128 (F2/F1) for 1H-13C HSQC spectra, a Lorentzian-Gaussian window function (exponential factor 0.3 Hz, Gaussian factor 1.0 Hz in GF mode), and used multiple point baseline correction. 1H-13C HSQC acquisition was performed via double insensitive nuclei enhancement by polarization transfer (INEPT), including phase sensitivity using Echo/Antiecho-TPPI gradient selection with decoupling during acquisition and using trim pulses in INEPT transfer with multiplicity editing during the selection step. The acquired spectra were processed using the Mnova NMR software package (v14.2.0, MestreLab Research SL, A Coruna, Spain).
2.10. Computational modeling
Structures of all possible combinations of the 2- and 4-sulfated Fucα(1-3)Fucα disaccharides and sulfated octasaccharide units of IbSF and HfSF were generated using Glycam_web. (Woods et al., 2022) The lowest potential energy conformer was selected as the starting structure for MD simulations for the cases where more than one conformer was generated by Glycam_web. MD input files of all the sulfated di- and octasaccharide structures were prepared using tleap. Each structure was first solvated in an octahedral TIP3P water box extending 15 Å from its surface. Sodium ions (Na+) were added to neutralize the overall charge of the system to zero. The SFs were treated using the Glycam06 forcefield (Kirschner et al., 2008).
The systems were subjected to molecular dynamics simulations using cuda version pmemd in Amber20 (Case et. al. 2021, p. 20). A three-step equilibration protocol was used for the solvated system in which the system was energy-minimized for 25,000 steps with the conjugate gradient method, followed by heating the system to 300 K using the Berendsen temperature control (ntt=1), with final density-equilibration for 500 ps at 300 K. The coordinates of the equilibrated structure were used for a production run 1 microsecond (μs) MD simulation at NPT using the MD settings: temperature 300 K, temperature scaling by Berendsen temperature control, 2 ps temperature coupling (tautp=2), pressure relaxation every 1.2 ps, SHAKE constraints, nonbonded interaction cutoff of 8 Å, and 2 fs integration time step. MD trajectories were analyzed using the cpptraj package of AmberTools (Roe & Cheatham, 2013).
We used glycosidic dihedral angles defined as φ= H1-C1-O3-C3 and Ψ = C1-O3-C3-H3 for each Fucα(1-3)Fucα glycosidic linkage. The φ and Ψ dihedral angles from the MD trajectories were calculated using cpptraj. A 2D histogram of the φ and Ψ dihedral angle distribution in bins of 6° ranging from −180° to 180° was calculated. The probability (P) of conformations being found in each bin was calculated by the number of conformations present in each bin divided by the total number of conformations in all of the bins. The 2D conformation free energy landscape was then obtained from the probabilities using the equation: ΔG = –RT ln(P) with ΔG the free energy, R the gas constant (8.314 J·K−1·mol−1) and T the temperature of the MD simulation (300 K). A free-energy profile was plotted using the program R (R Core Team 2021).
3. Results and discussion
3.1. Purification of holothurian SFs
The crude polysaccharide extracts from the two sea cucumbers, I. badionotus and H. floridana, were obtained from enzymatic digestions of their respective body walls as described previously (Dwivedi et al., 2021), and subjected to anion-exchange chromatography using a DEAE Sephacel column. The resultant fractions were monitored by 1,9-dimethylmethylene blue (DMB) assay. Each chromatogram displayed two peaks, the first one related to the fucosylated chondroitin sulfate (FucCS) and the second one related to the SF (Figure S1). The FucCS and SF from I. badionotus, IbFucCS and IbSF, eluted from the DEAE column at NaCl concentrations of 1.4 and 2.0 mol/dm3, respectively (Figure S1A). The FucCS and SF from H. floridana, HfFucCS and HfSF, eluted from the DEAE column at NaCl concentrations of 1.2 and 1.7 mol/dm3, respectively (Figure S1B).
3.2. Production and preliminary analysis of IbSF and HfSF oligosaccharides
Partial depolymerization of IbSF and HfSF to produce medium-sized oligosaccharides was performed by mild acid hydrolysis using 0.05 mol/dm3 H2SO4 at 60 °C for IbSF and 0.01 mol/dm3 HCl at 60 °C and 0.05 mol/dm3 H2SO4 at 60 °C for HfSF, within different time courses. The H2SO4 was chosen for IbSF hydrolysis as described previously (Chen et al., 2012). For HfSF, both H2SO4 and HCl were chosen as these acids were never investigated for this SF but were used in previous hydrolysis of IbSF (Chen et al., 2012) and LvSF (Bezerra et al., 2020; Pomin et al., 2004; Vitor H. Pomin et al., 2005; Queiroz et al., 2014). Results shown by PAGE (Figure 2) indicate a controlled chemical reduction in the MW of both SFs as a function of hydrolysis time. The lack of narrow bands in PAGE of hydrolyzed IbSF and HfSF, as opposed to previous analysis of LvSF, indicates a more heterogenous oligosaccharide preparation for the current SFs.
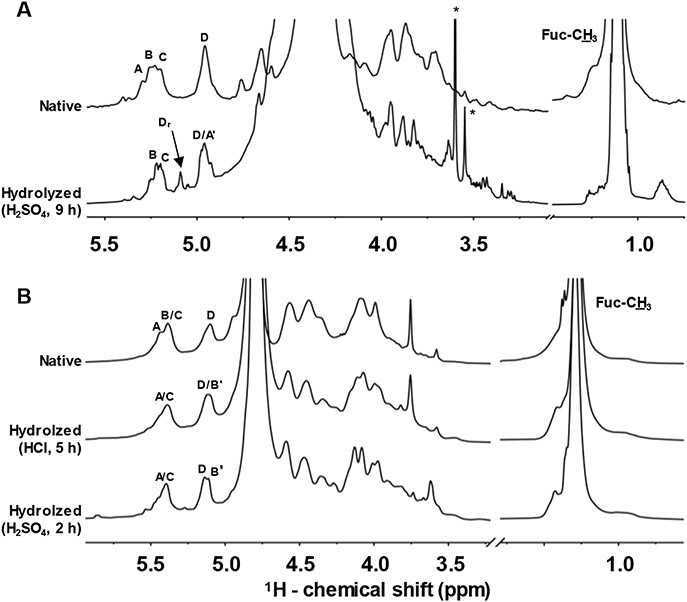
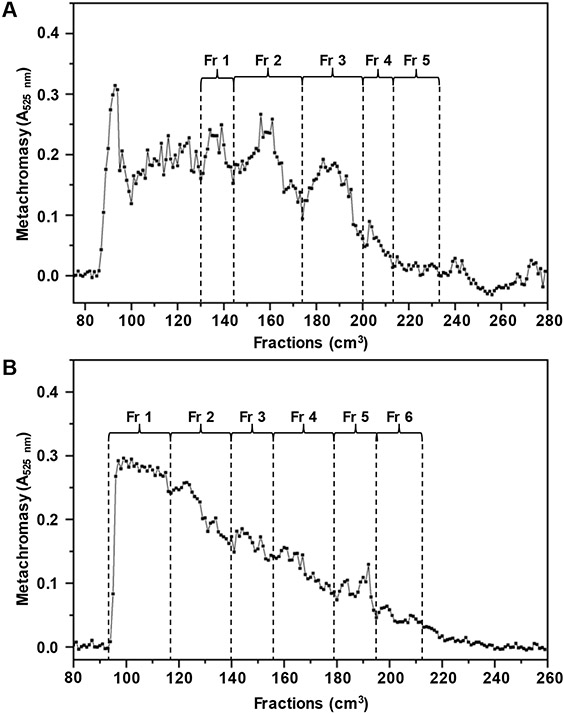
Selected hydrolysis times were chosen for further scaled-up production of oligosaccharides with similar MW distribution of the low MW heparin (LMWH) since this standard is well-known to fractionate well in size-exclusion chromatography (SEC) using a Bio-Gel P-10 column (Oliveira et al., 2015). These times were 9 h for 0.05 mol/dm3 H2SO4 of IbSF, 5 h for 0.01 mol/dm3 HCl of HfSF and 2 h for 0.05 mol/dm3 H2SO4 of HfSF. Figure 3 shows the assigned 1D 1H NMR spectra of both native and hydrolysates from IbSF and HfSF obtained within these selected hydrolysis times. As indicated with the upfield 1H resonance shifts of residue A in IbSF (2,4-di-sulfated unit in Figure 1B), and residue B in HfSF (2-sulfated unit in Figure 1C), chemical modifications, likely desulfations, were observed at these residues now labeled as A' (Figure 3A) and B' (Figure 3B). The presence of the four 1D α-anomeric 1H signals (δH range from 5.4 to 4.9 ppm, Table 1) in both hydrolyzed SFs, A'/B/C/D in IbSF and A/B'/C/D in HfSF, confirm the tetrasaccharide-repeating building blocks in the SF hydrolysates (four Fuc units), although one of the units in each SF (A' in IbSF and B' in HfSF) showed different chemical shifts than the native counterparts indicating chemical modification. The same 1D 1H NMR spectral profile was observed in the hydrolysis of HfSF with the two acids (5 h for 0.01 mol/dm3 HCl, top spectrum, and 2 h for 0.05 mol/dm3 H2SO4 of HfSF, bottom spectrum, Figure 3), indicating the same chemical modification in HfSF regardless of the acid employed. Since both acids showed the same 1D 1H NMR profile, we randomly opted to use HCl as acid for scaled-up production of HfSF oligosaccharides for SEC fractionation. Figure 4 shows the chromatograms obtained for IbSF (panel A) and HfSF (panel B).
Fig. 3.
1D 1H NMR spectra of (A) native (top) and hydrolyzed IbSF (0.05 mol/dm3 H2SO4 at 60 °C for 9 h) (bottom), and (B) native (top), and hydrolyzed HfSF (0.01 mol/dm3 HCl at 60 °C for 5 h) (middle), and (0.05 mol/dm3 H2SO4 at 60 °C for 2 h) (bottom) recorded in 99% D2O at 50 °C on an AVANCE III 500 MHz Bruker NMR spectrometer equipped with a prodigy probe. 1H chemical shifts are referenced to trimethylsilylpropionic acid to 0 ppm. The 1H resonances marked as A-D in the native sulfated fucans are related to the fucose (Fuc) units labeled in Fig. 1. The 1H resonances assigned as A' and B' in the oligosaccharides are from desulfated Fuc units. The signal assigned as Dr is from the reducing-end 4-sulfated Fuc unit (D) in IbSF. Sharp signals marked with asterisks are from residual solvent during oligosaccharide production.
Table 1.
1H and 13C chemical shifts (δ, ppm) of IbSF and HfSH polysaccharides and oligosaccharides.
| Glycans | Structure (sulfation pattern and letter notation) |
1H and 13C chemical shift (δ, ppm)a | |||||||
|---|---|---|---|---|---|---|---|---|---|
| Residue | H1/C1 | H2/C2 | H3/C3 | H4/C4 | H5/C5 | H6/C6 | Work | ||
| IbSF tetrasaccharide | 2,4S-2S-2S-0S A-B-C-D |
A (2,4S) | 5.22/95.6 | 4.30/75.9 | 4.06/75.5 | 4.56/81.8 | 4.43/67.5 | 1.15/16.3 | (Chen et al., 2012) |
| B (2S) | 5.20/96.5 | 4.40/73.8 | 3.99/75.1 | 3.91/69.7 | 4.30/67.5 | 1.12/16.3 | |||
| C (2S) | 5.26/95.3 | 4.43/73.8 | 4.00/74.6 | 3.98/70.3 | 4.19/67.5 | 1.16/16.3 | |||
| D (0S) α | 5.09/93.1 | 3.78/68.3 | 3.91/69.3 | 3.95/69.1 | 3.78/66.8 | 1.08/16.3 | |||
| D (0S) β | 4.43/97.1 | 3.46/70.8 | 3.55/79.7 | 3.85/68.7 | 3.64/71.5 | 1.13/16.3 | |||
| IbSF octasaccharides | 2,4S-2S-2S-0S-4S-2S-2S-0S A-B-C-D-A'-B-C-D |
A (2,4S) | 5.26/95.6 | 4.42/73.8 | 4.11/75.2 | 4.69/80.8 | 4.18/67.5 | 1.10/16.3 | Current |
| A' (4S) | 4.94/96.3 | 3.78/67.3 | 3.70/68.0 | 4.63/80.5 | 4.18/67.5 | 1.10/16.3 | |||
| B (2S) | 5.22/94.9 | 4.42/73.8 | 3.99/74.8 | 3.99/74.8 | 4.05/67.3 | 1.09/16.3 | |||
| C (2S) | 5.21/95.7 | 4.31/75.9 | 3.99/74.8 | 3.95/70.1 | 4.41/75.9 | 1.13/16.3 | |||
| D (0S) | 4.97/99.8 | 3.72/68.0 | 3.86/76.6 | 3.95/70.1 | 3.78/67.2 | 1.14/16.3 | |||
| [4S-2S-2S-0S]2 [A'-B-C-D]2 |
A' (4S) | 4.94/96.3 | 3.78/67.3 | 3.70/68.0 | 4.63/80.5 | 4.18/67.5 | 1.10/16.3 | ||
| B' (2S) | 5.22/94.9 | 4.42/73.8 | 3.99/74.8 | 3.99/74.8 | 4.05/67.3 | 1.12/16.3 | |||
| C' (2S) | 5.21/95.7 | 4.31/75.9 | 3.99/74.8 | 3.95/70.1 | 4.41/75.9 | 1.13/16.3 | |||
| D' (0S) α | 5.09/93.1 | 3.72/68.0 | 3.90/69.2 | 3.95/70.1 | 3.78/67.2 | 1.14/16.3 | |||
| D" (0S) β | 4.46/96.8 | 3.44/70.8 | 3.53/79.6 | 3.83/68.7 | 3.65/71.7 | 1.10/16.3 | |||
| Native HfSF | [2,4S-0S-2S-2S]n [A-D-C-B]n |
A (2,4S) | 5.43/96.6 | 4.59/77.3 | 4.39/76.8 | 4.94/83.3 | 4.43/69.6 | 1.30/18.5 | (An et al., 2022) |
| D (0S) | 5.09/99.2 | 3.98/78.4 | 4.09/71.6 | 4.16/69.6 | 4.39/69.5 | 1.27/18.2 | |||
| C (2S) | 5.36/97.8 | 4.55/75.5 | 4.15/76.3 | 3.98/69.1 | 4.56/69.4 | 1.29/18.4 | |||
| B (2S) | 5.39/101.0 | 4.57/76.1 | 4.34/75.4 | 4.08/71.6 | 4.32/70.1 | 1.26/18.0 | |||
| Native HfSF | [2,4S-0S-2S-2S]n [A-D-C-B]n |
A (2,4S) | 5.42/97.1 | 4.57/77.8 | 4.38/77.8 | 4.94/83.7 | 4.43/69.8 | 1.27-1.36/18.5-22.9 | Current |
| D (0S) | 5.09/99.2 | 3.98/78.7 | 4.07/71.8 | 4.20/71.0 | 4.43/69.8 | 1.27-1.36/18.5-22.9 | |||
| C (2S) | 5.37/97.1 | 4.56/76.2 | 4.15/76.4 | 3.98/69.6 | 4.43/69.8 | 1.27-1.36/18.5-22.9 | |||
| B (2S) | 5.38/101.5 | 4.56/76.2 | 4.35/76.1 | 4.07/71.8 | 4.43/69.8 | 1.27-1.36/18.5-22.9 | |||
| Hydrolyzed HfSF | [2,4S-0S-2S-0S]n [A-D-C-B']n |
A (2,4S) | 5.42/97.1 | 4.53/77.6 | 4.44/78.2 | 4.81/83.0 | 4.42/69.7 | 1.27-1.31/18.5-22.9 | Current |
| D (0S) | 5.05/99.3 | 3.97/78.3 | 4.03/71.5 | 4.21/69.3 | 4.31/69.5 | 1.27-1.31/18.5-22.9 | |||
| C (2S) | 5.37/96.6 | 4.53/76.0 | 4.11/76.6 | 3.91/69.4 | 4.52/69.5 | 1.27-1.31/18.5-22.9 | |||
| B' (0S) | 5.09/102.7 | 3.97/78.3 | 4.07/72.1 | 4.03/71.5 | 4.31/69.5 | 1.27-1.31/18.5-22.9 | |||
Chemical shifts were obtained from spectra recorded in 99% D2O at 25 °C on an AVANCE III 500 MHz Bruker NMR spectrometer. Chemical shifts are relative to external trimethylsilylpropionic acid at 0 ppm for 1H and methanol for 13C. Values in boldface indicate sites of sulfation, while values in italic are from glycosidic linkages.
Fig. 4.
Oligosaccharide fractionation of (A) hydrolyzed IbSF (0.05 mol/dm3 H2SO4 at 60 °C for 9 h), and (B) hydrolyzed HfSF (0.01 mol/dm3 HCl at 60 °C for 5 h) in a Bio-Gel P-10 column. Fractions (1 cm3 each) were eluted by aqueous 10% ethanol solution containing 1.0 mol/dm3 NaCl and detected by metachromasy using 1,9-dimethylmethylene blue with absorbance at 525 nm. Fractions (Fr 1- Fr 5 for IbSF, and Fr 1-Fr 6 for HfSF) were pooled as indicated in the panels.
The lack of defined SEC peaks of IbSF and HfSF, as opposed to previously defined peaks in Bio-Gel P-10 chromatograms of LvSF (Bezerra et al., 2020; Pomin et al., 2004; Queiroz et al., 2014), corroborates the interpretation of a more heterogeneous oligosaccharide production in IbSF and HfSF, as previously noticed by the lack of narrow bands in the PAGE analysis (Figure 2). Hence, the decision on fractions to be pooled in the SEC chromatograms of IbSF (Fr 1-5, Figure 4A) and HfSF (Fr 1-6, Figure 4B) was random. As detailed below, analysis through a series of 2D NMR spectra and mass spectrometry (MS) of the IbSF and HfSF oligosaccharides, and a LvSF octasaccharide from previous work (Bezerra et al., 2020), was conducted.
3.3. Selective 2-desulfation of IbSF and HfSF during mild acid hydrolysis
The 1H-13C heteronuclear single quantum coherence (HSQC) spectrum of Fr 5 from the Bio-Gel P-10 column of IbSF (Figure S2) showed two sets of tetrasaccharide-based building blocks. One had 1H and 13C chemical shifts like the fully sulfated tetrasaccharide assigned as A/B/C/D. Another one was from a tetrasaccharide with a 2-desulfated A (2,4-di-sulfated) unit now labeled as A' (4-sulfated). The upfield resonance shifts of 1H1 and 1H2 from the native A unit with δ, respectively, at 5.26 and 4.42 ppm compared to 4.94 and 3.78 ppm in the octasaccharide (respectively, ~0.3 and −0.6 ppm differences) (Table 1) is typical of 2-desulfation as reported before (Pomin et al., 2004; Pomin et al., 2005; Queiroz et al., 2014).
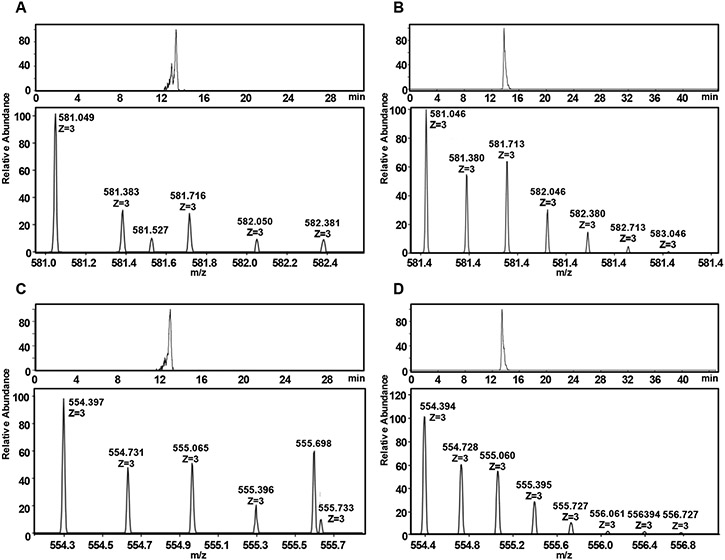
Results from LC-MS analysis on Fr 5 of IbSF (Figure 5A and 5C, Table 2) have indicated two main octasaccharides with different sulfation contents: Fuc8S7 (triply charged deprotonated ion peak of 581.05 m/z) with MW of 1746 Da and Fuc8S6 (triply charged deprotonated ion peak of 554.40 m/z) with MW of 1666 Da, among all observed octasaccharides (Figure S3A). This indicates mono and di-desulfation in the most abundant components. Combining this MS-based result with full 1H and 13C chemical shift assignments in the HSQC spectrum, we were able to conclude that Fr 5 of IbSF is composed of two main octasaccharides with the following structures [2.4-2-2-0-4-2-2-0] and [4-2-2-0]2 in a 4:6 ratio. The cross-peaks of these two structures are respectively assigned in the NMR spectra as A-B-C-D-A'-B-C-Dr'(α)/Dr'(β) and A'-B-C-D-A'-B-C-Dr'(α)/Dr"(β). This data indicates that selective 2-desulfation can occur at different extents during mild acid hydrolysis of IbSF but selectively at the 2,4-di-sulfated unit labeled as A.
Fig. 5.
Extracted ion-chromatogram (top) and negative ion mode spectra (bottom) from HILIC electron spray ionization-mass spectrometry (HILIC-ESI-MS) of (A and C) hIbSF and (B and D) hHfSF. The deprotonated ions observed as [M-3H]3− peaks are from (A and B) heptasulfated octa-fucose fragments (Fuc8S7), and (C and D) hexasulfated octa-fucose (Fuc8S6) fragments.
Table 2.
Negative-ion ESI-MS of octasaccharides obtained from IbSF and HfSF Fr 5.
| Fractions | Observed ion (m/z) |
Time (min) |
Assignments | |
|---|---|---|---|---|
| [M-3H−3 | Exact Mass | Compositiona | ||
| IbSF Fr 5 | 554.397 | 13.03 | 1666.216 | Fuc8S6 |
| 581.049 | 13.34 | 1746.173 | Fuc8S7 | |
| HfSF Fr 5b | 554.394 | 13.44 | 1666.216 | Fuc8S6 |
| 581.046 | 13.81 | 1746.173 | Fuc8S7 | |
Fuc, fucose; and S, sulfate ester (SO3−).
Other components are shown in Figure S4.
It is curious to see that the extracted ion chromatograms of IbSF (top panels of Figure 5A and C) show multiple minor peaks with earlier retention time than the most abundant isomers [2.4-2-2-0-4-2-2-0] and [4-2-2-0]2. This suggests the existence of other heptasulfated and hexasulfated octasaccharide isomers for IbSF. These less abundant isomers were undeteced in the 1H-13C HSQC spectrum (Figure S2) since this analytical technique is much less sensitive than MS.
Comparative 1H-13C HSQC spectral analyses of the native HfSF (Figure S4A) with the unfractionated hydrolyzed HfSF materials, exposed for 5 h to 0.01 mol/dm3 HCl (top spectrum in Figure S4B) or for 2 h to 0.05 mol/dm3 H2SO4 (bottom spectrum in Figure S4B) shows a clear upfield shift only for unit B (Table 1). The upfield resonance shifts of 1H1 and 1H2 from the native B unit with δ, respectively, at 5.39 and 4.57 ppm compared to 5.09 and 3.97 ppm in the oligosaccharides (respectively, ~0.3 and ~0.6 ppm differences) (Table 1) is typical of 2-desulfation, as discussed above.
Like the presence of multiple IbSF octamers with different sulfation levels, results from LC-MS analysis on Fr 5 of the Bio-Gel P-10 column of HfSF indicate different sulfation contents also in its octasaccharide-rich fraction (from disulfation, Fuc8S2, to octasulfation, Fuc8S8) (Figure S3B). The di-desulfated octasaccharide (Fuc8S6) of the triply charged deprotonated ion peak of 554.40 m/z (Figure 5D, Table 2) has the structure [2,4-0-2-0]2 based on the HSQC analysis (assigned as [A-D-C-B']2) and is the most abundant component in the mixture, as seen by the MS profile. The second most abundant octasaccharide is the mono-desulfated (Fuc8S7) of the triply charged deprotonated ion peak of 581.04 m/z (Figure 5B). Its structure [2,4-0-2-2-2,4-0-2-0] can be inferred from the HSQC spectrum of HfSF Fr 5 (Figure S4B) together with the fact that desulfated units become liable for protonation and subsequent cleavage during mild acid hydrolysis (Pomin et al., 2004; Pomin et al., 2005; Queiroz et al., 2014). For the case of HfSF, this Fuc unit is the one labeled as B.
3.4. Selective 2-desulfation of LvSF during mild acid hydrolysis
Although we have already observed selective 2-desulfation in LvSF (2-sulfated unit labeled as A in Figure 1A) (Pomin et al., 2004; Pomin et al., 2005), non-desulfated LvSF oligosaccharides can also occur in LvSF when subjected to mild acid hydrolysis (Bezerra et al., 2020). This intriguing fact, together with the occurrence of oligosaccharides with different sulfation contents in IbSF and HfSF, including non-desulfated oligosaccharides, as discussed above, through the NMR and MS analyses, led us to reinvestigate LvSF, particularly its octasaccharide-rich fraction also obtained from a Bio-Gel P-10 column from previous work (Bezerra et al., 2020). Results from the 1D 1H (Figure S5A), 2D 1H-13C HSQC (Figure S5B), 1H-1H correlated spectroscopy (COSY) (Figure S6), 1H-1H total correlation spectroscopy (TOCSY) (Figure S7) and MS (Figure S8) on this LvSF octasaccharide preparation indicate that two components can exist: a fully sulfated one (Fuc8S10) identified by the triply-charged deprotonated ion peak of 661.0 m/z (MW of 1986 Da) whose sulfation pattern is [4-2,4-2-2]2 and a selectively 2-desulfated one (Fuc8S9) identified by the triply-charged deprotonated ion peak of 634.35 m/z (MW of 1906 Da) whose structure is [4-2,4-2-2-4-2,4-2-0], in a ratio of 9.0:1.0. The conformation and dynamics of the selectively 2-desulfated LvSF octasaccharide was previously studied (Queiroz et al., 2014). Desulfation and cleavage of LvSF oligosaccharides occur at the reducing end A residue as mechanistically explained in previous work (Pomin et al., 2004).
3.5. Conformation of composing difucose units
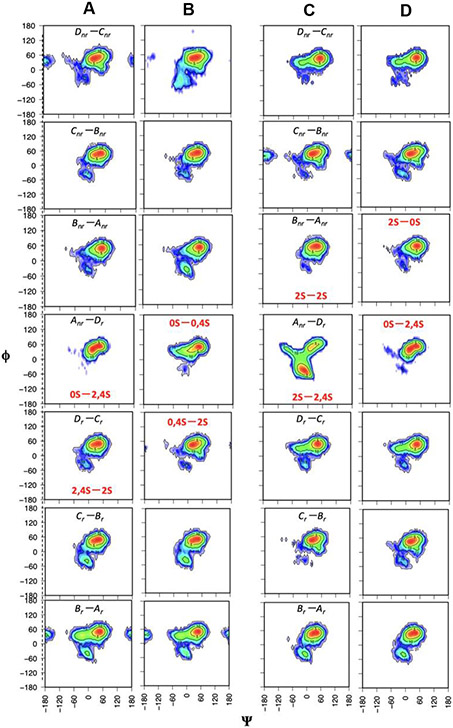
Conformations of various SF-derived disaccharides (Table S1) were analyzed in terms of dihedral angles around the α1-3 linkages (Fig. S9) to understand the molecular basis behind desulfation and cleavage of IbSF and HfSF during mild acid hydrolysis, as previously performed for LvSF (Queiroz et al., 2014). Differently sulfated difucoses show three main conformational states in the free-energy (φ/ψ angle) maps. A fully non-sulfated Fuc(α1-3)Fuc shows the conformational state A (φ=55°, ψ=50°) as the global minimum but another minor minimum state B (φ=50°, ψ=−30°) can also be noted (Figure S9A). This minor minimum state B is also observed in all the difucoses when the reducing end is not sulfated but the non-reducing end Fuc is sulfated (Figure S9, A-D). However, if the non-reducing end is 2-sulfated (whether it is 2- or 2,4-sulfated) and the reducing end is 4-sulfated, the global minimum is shifted to state B, and a third minimum energy conformation C (φ=0°, ψ=−50°) appears (Figures S9J, S9L and S10). Shifting of the conformation from state A to B is due to the steric hindrance that occurs between equatorial 2- and axial 4-sulfate groups of the adjacent residues, forcing the glycosidic linkage to adopt the B conformation. Similar behavior of 2- and 4-sulfated glycans has been reported earlier in investigations of chondroitin sulfate and related disaccharides (Zsiška & Meyer, 1993) and LvSF (Queiroz et al., 2014). The major conformation of the difucoses shifts from state B to state C when their reducing end has additional 4-sulfation (Figures S9N, S9P and S11).
Overall, three major conformations are possible and the presence of equatorial 2- and axial 4-sulfate groups of the adjacent residues influences major conformational changes. The difucose unit maintains an inter-residue hydrogen bond between hydroxyl and sulfate groups of the adjacent fucose residues unless the 2- and 4-positions of the adjacent residues are occupied by either both hydroxyls or both sulfates groups. State A is highly populated in Fuc(α1-3)Fuc2,4S (Figure S12) in cases in which the non-reducing end is fully desulfated and the reducing end has both 2- and 4-sulfate groups. The structures commonly deviate from conformation A when sulfate groups are present in the non-reducing end and can repel each other, for example in Fuc2S(α1-3)Fuc4S and Fuc2,4S(α1-3)Fuc4S. In this case, the most common conformation shifts to states B and C, for example in Fuc2S(α1-3)Fuc2,4S and Fuc2,4S(α1-3)Fuc2,4S (Figure S11). Since different major conformations are seen in the Fuc(α1-3)Fuc2,4S and Fuc2S/2,4S(α1-3)Fuc4S/2,4S difucose blocks, it seems clear that the sulfation pattern of the non-reducing end Fuc causes structural changes that ultimately help selective 2-desulfation and further linkage cleavage during oligosaccharide formation by mild acid hydrolysis.
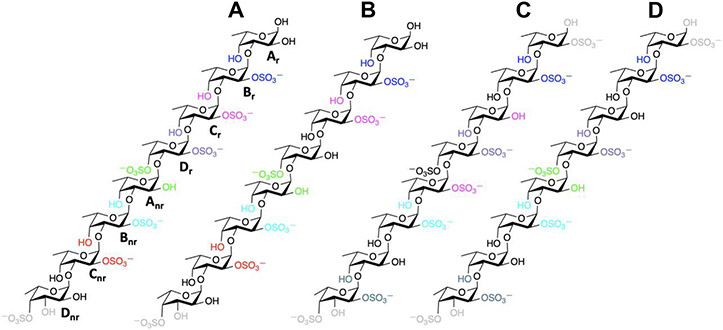
3.6. Oligosaccharide conformation
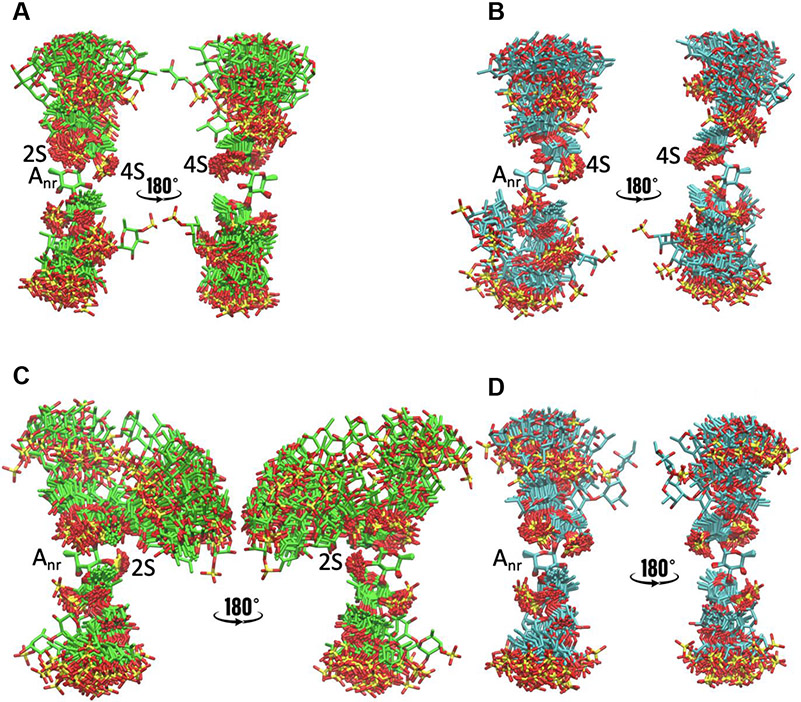
We further performed 1 μs molecular dynamics (MD) simulations of hypothetical IbSF and HfSF octasaccharides (Figures 6 and 7), which also showed very similar influences of the sulfate groups on the φ/ψ angle distributions between their composing Fuc units. The Fuc units were labeled as Dnr-Cnr-Bnr-Anr-Dr-Cr-Br-Ar as previously labeled (Queiroz et al., 2014), for comparison (Figure 8). The HfSF I octasaccharide mainly shows state A for all the glycosidic linkages other than for that of Fuc2Sα(1-3)Fuc2,4S between Anr-Dr, which is highly flexible and shows all three conformations, A, B, and C. Due to the high population of conformation C, in which the 2-sulfates are ~6 Å apart from each other and the 2-sulfate of residue Anr forms a hydrogen bond with the 2-hydroxyl of residue Br (with 37% occupancy), the octasaccharide bends a lot at this position compared to the other glycosidic linkages (Figure S12C). This bending of the octasaccharide along this glycosidic linkage likely allows acid to interact with the 2-sulfate of Anr and this favors desulfation at this specific position.
Fig. 6.
Dihedral angle (φ/ψ) distributions of the seven glycosidic linkages of the octasaccharides (A) IbSF I, (B) IbSF II, (C) HfSF I, and (D) HfSF II observed in the MD simulations. The red labels indicate the different sulfation patterns.
Fig. 7.
Overlay of conformations from snapshots taken every 20 ns from the MD simulations, aligned based on the Anr fucose residue: (A) IbSF I, (B) IbSF II, (C) HfSF I and (D) HfSF II. For each case, two views are presented, with one rotated 180° relative to the other.
Fig. 8.
Chemical representations of the model sulfated fucan-derived octasaccharides from (A and B) IbSF, and (C and D) HfSF. (B) Octasaccharide IbSF II has 2-desulfation at Dr relative to (A) IbSF I. Similarly, (D) HfSF II is 2-desulfated at Anr compared to (C) HfSF I. Pairs of sulfate groups (SO3−) and hydroxyl (OH) groups involved in hydrogen bonds are shown with the same colors. Those not forming any hydrogen bond are colored in black. Intra-residue hydrogen bonds between sulfate (SO3−) and hydroxyl (OH) groups in the terminal residues (Dnr or Ar) are shown in gray.
Upon 2-desulfation of Anr, the An-Dr glycosidic linkage changes the resulting sulfation pattern to Fucα(1–3)Fuc2,4S, therefore giving a highly rigid conformation A (Figures 7 and S11). Fucα(1–3)Fuc2,4S is the most rigid conformation seen among all the sulfation patterns of the difucoses we studied. And for it there is the least flanking of functional groups (either sulfates or hydroxyls) along its Anr-Dr glycosidic linkage. This most likely allows protonation during mild acid incubation to access the oxygen of the glycosidic linkage and hence cleave this glycosidic bond during hydrolysis. This hypothesis also matches very well with the desulfation and cleavage of LvSF previously studied, for which desulfation of Anr and cleavage of the Anr-Dr glycosidic linkage resulted in very similar conformational changes (Queiroz et al., 2014).
However, in the case of IbSF, IbSF I octasaccharide did not show any significant bending as it has the Fucα(1–3)Fuc2,4S sulfation pattern along its Anr-Dr glycosidic linkage. Since this sulfation pattern has been found to show a highly populated conformation A in all cases (whether for difucoses or HfSF), the Anr-Dr glycosidic linkage in the IbSF I structure should be able to undergo mild acid cleavage without any need of 2-desulfation of Dr. However, desulfation of 2-sulfate in Dr was observed in the NMR results, and this could not be explained based on the conformation and dynamics of the IbSF octasaccharide. There are very consistent inter-residue hydrogen bonds between the sulfate and hydroxyl groups of the adjacent residues in IbSF (Table 3), so it is possible that the cleavage of the Anr-Dr glycosidic linkage occurs without the 2-desulfation of Dr and that the 2-desulfation could be occurring subsequently.
Table 3.
Average hydrogen bond distances (Å) between hydroxyl and sulfate groups and their occupancy in IbSF and HfSF.a
| Sulfate Group | Hydrogen Bond (I) | Hydrogen Bond (II) | Color | |||||
|---|---|---|---|---|---|---|---|---|
| Residue | Atom | Atoms | Distance | Occupancy | Distance | Occupancy | ||
| IbSF | Dnr–4SO3− | O | Dnr(O3) | 2.85 | 99 | 2.87 | 60 | Purple |
| Cnr–2SO3− | O | Bnr(O4) | 2.80 | 52 | 2.80 | 54 | Red | |
| Bnr–2SO3− | O | Anr(O4) | 2.79 | 70 | 2.78 | 72 | Cyan | |
| Dr–4SO3− | O | Anr(O2) | 2.76 | 100 | 2.75 | 100 | Green | |
| Dr–2SO3− | O | Cr(O4) | 2.80 | 52 | DSb | DSb | Gray | |
| Cr–2SO3− | O | Br(O4) | 2.80 | 51 | 2.80 | 48 | Magenta | |
| Br–2SO3− | O | Ar(O4) | 2.79 | 59 | 2.79 | 59 | Blue | |
| HfSF | Dnr–2SO3− | O | Dnr(O3) | 2.86 | 100 | 2.87 | 99 | Gray |
| Dnr–2SO3− | O | Cnr(O4) | 2.77 | 73 | 2.78 | 73 | Teal | |
| Bnr–2SO3− | O | Anr(O4) | 2.80 | 53 | 2.79 | 71 | Cyan | |
| Anr–2SO3− | O | Br(O2) | 2.86 | 37 | DSb | DSb | Green | |
| Dr–2SO3− | O | Cr(O4) | 2.78 | 70 | 2.79 | 62 | Violet | |
| Br–2SO3− | O | Ar(O4) | 2.80 | 48 | 2.80 | 47 | Blue | |
| Ar–2SO3− | O | Ar(O1) | 3.32 | 13 | 3.32 | 13 | Gray | |
Mean of the hydrogen bond distances between the hydroxyl oxygen and the closest oxygen in the sulfate group. The color column shows the color of each hydrogen bonded pair in Fig. 6.
DS means the octasaccharides are 2-desulfated and that particular sulfate group is absent in the structure.
4. Conclusions
From previous works, selective 2-desulfation was observed to occur in mild acid hydrolysis of LvSF. In another report, an intact (non-desulfated) LvSF oligosaccharide was conversely observed. In this current work, we expanded our analysis of mild acid hydrolysis by reinvestigating LvSF octasaccharides and the oligosaccharides of IbSF and HfSF submitted to the same depolymerization strategy, mild acid hydrolysis. Selective 2-desulfation reaction was observed again on LvSF as well as IbSF and HfSF. From our current findings, we conclude that 2-desulfation is a common and expected phenomenon in oligosaccharide production by mild acid hydrolysis of SFs, including those composed of tetrasaccharide-repeating units such as LvSF, IbSF and HfSF. An independent study recently reported the partial 2-desulfation during hydrolysis of the fully 2-sulfated 3-linked SF from sea cucumber Stichopus hermanni (Li et al., 2022) and this supports our observations and conclusions.
Supplementary Material
Funding
This work was supported by funds from the National Institutes of Health [1P20GM130460-01A1 (J.S.S., R.J.D. and V.H.P) subproject 7936 (V.H.P.) and 1R03NS110996-01A1 (J.S.S. and V.H.P.)], and the University of Mississippi (V.H.P.). The content of the information does not necessarily reflect the position, or the policy of the sponsors and no official endorsement should be inferred. The content is solely the responsibility of the authors and does not necessarily represent the official views of the National Institutes of Health. The graduate student in Pomin’s laboratory Marwa Farrag is funded by a full scholarship (GM 1110) from the Ministry of Higher Education of the Arab Republic of Egypt.
Footnotes
Publisher's Disclaimer: This is a PDF file of an unedited manuscript that has been accepted for publication. As a service to our customers we are providing this early version of the manuscript. The manuscript will undergo copyediting, typesetting, and review of the resulting proof before it is published in its final form. Please note that during the production process errors may be discovered which could affect the content, and all legal disclaimers that apply to the journal pertain.
Conflict of interest statement
The authors declare that they have no conflicts of interest with the contents of this article. The funders had no role in the design, writing, or decision of this publication.
Declaration of interests
The authors declare that they have no known competing financial interests or personal relationships that could have appeared to influence the work reported in this paper.
Supplementary information
This article contains supplementary information.
References
- An Z, Zhang Z, Zhang X, Yang H, Lu H, Liu M, … Zhang H. (2022). Oligosaccharide mapping analysis by HILIC-ESI-HCD-MS/MS for structural elucidation of fucoidan from sea cucumber Holothuria floridana. Carbohydrate Polymers, 275, 118694. [DOI] [PubMed] [Google Scholar]
- Berteau O, & Mulloy B (2003). Sulfated fucans, fresh perspectives: structures, functions, and biological properties of sulfated fucans and an overview of enzymes active toward this class of polysaccharide. Glycobiology, 13(6), 29R–40R. [DOI] [PubMed] [Google Scholar]
- Bezerra FF, Vignovich WP, Aderibigbe AO, Liu H, Sharp JS, Doerksen RJ, & Pomin VH (2020). Conformational properties of l-fucose and the tetrasaccharide building block of the sulfated l-fucan from Lytechinus variegatus. Journal of Structural Biology, 209(1), 107407. [DOI] [PMC free article] [PubMed] [Google Scholar]
- Biermann C, H., Marks JA, Vilela-Silva A-CES, Castro MO, & Mourão PAS (2004). Carbohydrate-based species recognition in sea urchin fertilization: another avenue for speciation? Evolution & Development, 6(5), 353–361. [DOI] [PubMed] [Google Scholar]
- Cesaretti M, Luppi E, Maccari F, & Volpi N (2003). A 96-well assay for uronic acid carbazole reaction. Carbohydrate Polymers, 54(1), 59–61. [Google Scholar]
- Chen G, Yu L, Zhang Y, Chang Y, Liu Y, Shen J, & Xue C (2021). Utilizing heterologously overexpressed endo-1,3-fucanase to investigate the structure of sulfated fucan from sea cucumber (Holothuria hilla). Carbohydrate Polymers, 272, 118480. [DOI] [PubMed] [Google Scholar]
- Chen S, Hu Y, Ye X, Li G, Yu G, Xue C, & Chai W (2012). Sequence determination and anticoagulant and antithrombotic activities of a novel sulfated fucan isolated from the sea cucumber Isostichopus badionotus. Biochimica et Biophysica Acta (BBA) - General Subjects, 1820(7), 989–1000. [DOI] [PubMed] [Google Scholar]
- Chen S, Xue C, Yin L. a., Tang Q, Yu G, & Chai W (2011). Comparison of structures and anticoagulant activities of fucosylated chondroitin sulfates from different sea cucumbers. Carbohydrate Polymers, 83(2), 688–696. [Google Scholar]
- Colin S, Deniaud E, Jam M, Descamps V, Chevolot Y, Kervarec N, … Kloareg B (2006). Cloning and biochemical characterization of the fucanase FcnA: definition of a novel glycoside hydrolase family specific for sulfated fucans. Glycobiology, 16(11), 1021–1032. [DOI] [PubMed] [Google Scholar]
- DuBois M, Gilles KA, Hamilton JK, Rebers PA, & Smith F (1956). Colorimetric Method for Determination of Sugars and Related Substances. Analytical Chemistry, 28(3), 350–356. [Google Scholar]
- Dwivedi R, Samanta P, Sharma P, Zhang F, Mishra SK, Kucheryavy P, … Pomin VH (2021). Structural and kinetic analyses of holothurian sulfated glycans suggest potential treatment for SARS-CoV-2 infection. Journal of Biological Chemistry, 297(4), 101207. [DOI] [PMC free article] [PubMed] [Google Scholar]
- Farndale RW, Sayers CA, & Barrett AJ (1982). A Direct Spectrophotometric Microassay for Sulfated Glycosaminoglycans in Cartilage Cultures. Connective Tissue Research, 9(4), 247–248. [DOI] [PubMed] [Google Scholar]
- Kirschner KN, Yongye AB, Tschampel SM, González-Outeiriño J, Daniels CR, Foley BL, & Woods RJ (2008). GLYCAM06: a generalizable biomolecular force field. Carbohydrates. J Comput Chem, 29(4), 622–655. [DOI] [PMC free article] [PubMed] [Google Scholar]
- Li B, Lu F, Wei X, & Zhao R (2008). Fucoidan: Structure and Bioactivity. Molecules, 13(8), 1671–1695. [DOI] [PMC free article] [PubMed] [Google Scholar]
- Li X, Sun H, Ning Z, Yang W, Cai Y, Yin R, & Zhao J (2022). Mild acid hydrolysis on Fucan sulfate from Stichopus herrmanni: Structures, depolymerization mechanism and anticoagulant activity. Food Chemistry, 395, 133559. [DOI] [PubMed] [Google Scholar]
- Luthuli S, Wu S, Cheng Y, Zheng X, Wu M, & Tong H (2019). Therapeutic Effects of Fucoidan: A Review on Recent Studies. Marine Drugs, 17(9), 487. [DOI] [PMC free article] [PubMed] [Google Scholar]
- Ning Z, Wang P, Zuo Z, Tao X, Gao L, Xu C, … Zhao J (2022). A Fucan Sulfate with Pentasaccharide Repeating Units from the Sea Cucumber Holothuriafloridana and Its Anticoagulant Activity. Mar Drugs, 20(6). [DOI] [PMC free article] [PubMed] [Google Scholar]
- Oliveira S-NMCG, Santos GRC, Glauser BF, Capillé NVM, Queiroz INL, Pereira MS, … Mourão PAS (2015). Structural and functional analyses of biosimilar enoxaparins available in Brazil. Thromb Haemost, 113(01), 53–65. [DOI] [PubMed] [Google Scholar]
- Panagos CG, Thomson DS, Moss C, Hughes AD, Kelly MS, Liu Y, … Uhrín D (2014). Fucosylated chondroitin sulfates from the body wall of the sea cucumber Holothuria forskali: conformation, selectin binding, and biological activity. J Biol Chem, 289(41), 28284–28298. [DOI] [PMC free article] [PubMed] [Google Scholar]
- Pereira MS, Melo FR, & Mourão PAS (2002). Is there a correlation between structure and anticoagulant action of sulfated galactans and sulfated fucans? Glycobiology, 12(10), 573–580. [DOI] [PubMed] [Google Scholar]
- Pereira MS, Mulloy B, & Mourão PAS (1999). Structure and Anticoagulant Activity of Sulfated Fucans: COMPARISON BETWEEN THE REGULAR, REPETITIVE, AND LINEAR FUCANS FROM ECHINODERMS WITH THE MORE HETEROGENEOUS AND BRANCHED POLYMERS FROM BROWN ALGAE*. Journal of Biological Chemistry, 274(12), 7656–7667. [DOI] [PubMed] [Google Scholar]
- Pomin VH, & Mourão PAS (2008). Structure, biology, evolution, and medical importance of sulfated fucans and galactans. Glycobiology, 18(12), 1016–1027. [DOI] [PubMed] [Google Scholar]
- Pomin VH, Park Y, Huang R, Heiss C, Sharp JS, Azadi P, & Prestegard JH (2012). Exploiting enzyme specificities in digestions of chondroitin sulfates A and C: production of well-defined hexasaccharides. Glycobiology, 22(6), 826–838. [DOI] [PMC free article] [PubMed] [Google Scholar]
- Pomin VH, Pereira MS, Valente A-P, Tollefsen DM, Pavão MSG, & Mourão PAS (2004). Selective cleavage and anticoagulant activity of a sulfated fucan: stereospecific removal of a 2-sulfate ester from the polysaccharide by mild acid hydrolysis, preparation of oligosaccharides, and heparin cofactor II-dependent anticoagulant activity. Glycobiology, 15(4), 369–381. [DOI] [PubMed] [Google Scholar]
- Pomin VH, Valente AP, Pereira MS, & Mourão PAS (2005). Mild acid hydrolysis of sulfated fucans: a selective 2-desulfation reaction and an alternative approach for preparing tailored sulfated oligosaccharides. Glycobiology, 15(12), 1376–1385. [DOI] [PubMed] [Google Scholar]
- Queiroz IN, Wang X, Glushka JN, Santos GR, Valente AP, Prestegard JH, … Pomin VH (2014). Impact of sulfation pattern on the conformation and dynamics of sulfated fucan oligosaccharides as revealed by NMR and MD. Glycobiology, 25(5), 535–547. [DOI] [PMC free article] [PubMed] [Google Scholar]
- Roe DR, & Cheatham TE 3rd. (2013). PTRAJ and CPPTRAJ: Software for Processing and Analysis of Molecular Dynamics Trajectory Data. J Chem Theory Comput, 9(7), 3084–3095. [DOI] [PubMed] [Google Scholar]
- Shen J, Chang Y, Zhang Y, Mei X, & Xue C (2020). Discovery and Characterization of an Endo-1,3-Fucanase From Marine Bacterium Wenyingzhuangia fucanilytica: A Novel Glycoside Hydrolase Family. Frontiers in Microbiology, 11. [DOI] [PMC free article] [PubMed] [Google Scholar]
- Shi D, Qi J, Zhang H, Yang H, Yang Y, & Zhao X (2019). Comparison of hydrothermal depolymerization and oligosaccharide profile of fucoidan and fucosylated chondroitin sulfate from Holothuria floridana. International Journal of Biological Macromolecules, 132, 738–747. [DOI] [PubMed] [Google Scholar]
- Teixeira FCOB, Kozlowski EO, Micheli K. V. d. A., Vilela-Silva ACES, Borsig L, & Pavão MSG (2018). Sulfated fucans and a sulfated galactan from sea urchins as potent inhibitors of selectin-dependent hematogenous metastasis. Glycobiology, 28(6), 427–434. [DOI] [PubMed] [Google Scholar]
- Vilela-Silva A-CES, Castro MO, Valente A-P, Biermann CH, & Mourão PAS (2002). Sulfated Fucans from the Egg Jellies of the Closely Related Sea Urchins Strongylocentrotus droebachiensis and Strongylocentrotus pallidus Ensure Species-specific Fertilization*. Journal of Biological Chemistry, 277(1), 379–387. [DOI] [PubMed] [Google Scholar]
- Warren L (1959). The Thiobarbituric Acid Assay of Sialic Acids. Journal of Biological Chemistry, 234(8), 1971–1975. [PubMed] [Google Scholar]
- Zsiška M, & Meyer B (1993). Influence of sulfate and carboxylate groups on the conformation of chondroitin sulfate related disaccharides. Carbohydrate Research, 243(2), 225–258. [DOI] [PubMed] [Google Scholar]
Associated Data
This section collects any data citations, data availability statements, or supplementary materials included in this article.


