Abstract
Osteosarcoma is the most prevalent form of primary bone malignancy affecting adolescents. Secretion‐associated Ras‐related GTPase 1A (SAR1A) is a key regulator of endoplasmic reticulum (ER) homeostasis, but its role as a regulator of osteosarcoma metastasis has yet to be clarified. Bioinformatics analyses revealed SAR1A and RHOA to be upregulated in osteosarcoma patients, with the upregulation of these genes being associated with poor 5‐year metastasis‐free survival rates. In addition, the upregulation of SAR1A and RHOA in osteosarcoma was highly positively correlated. Immunohistochemical analyses additionally revealed that SAR1A levels were increased in osteosarcoma pulmonary metastases. In vitro wound healing and Transwell assays indicated that knocking down SAR1A or RHOA impaired the invasive and migratory activity of osteosarcoma cells, whereas RHOA overexpression had the opposite effect. Western blotting and immunofluorescent staining revealed the inhibition of osteosarcoma cell epithelial–mesenchymal transition following SAR1A or RHOA knockdown; RHOA overexpression had the opposite effect. Following SAR1A knockdown, phalloidin staining indicated that osteosarcoma cells showed reduced lamellipodia formation. Endoplasmic reticulum stress levels and reactive oxygen species production were enhanced following the knockdown of SAR1A, as was autophagic activity, with lung metastases being reduced in vivo after such knockdown. Knocking down SAR1A suppresses osteosarcoma cell metastasis through the RhoA/YAP, ER stress, and autophagic pathways, offering new insights into the regulation of autophagic activity in the context of osteosarcoma cell metastasis and suggesting that these pathways could be amenable to therapeutic intervention.
Keywords: autophagy, ER stress, metastasis, RhoA/YAP, SAR1A
These results offer novel evidence that SAR1A can function in manner to promote metastasis and to regulate autophagic activity. Knocking down SAR1A can prevent metastasis by modulating the RhoA/YAP, ER stress, and autophagic activities, offering new insight into the mechanisms whereby intratumoral autophagy is regulated and highlighting these pathways as promising targets for therapeutic intervention in osteosarcoma.
1. INTRODUCTION
Osteosarcoma is the most prevalent form of bone malignancy in humans, 1 , 2 with peak incidence occurring in adolescents undergoing rapid growth and the majority of cases developing in individuals between the ages of 10 and 30. 2 Over the past three decades, there have been relatively few improvements in osteosarcoma patient clinical outcomes. 3 Five‐year survival rates for individuals with localized osteosarcoma are upwards of 60%, but are only 20% for individuals with recurrent or metastatic disease. 2 Genetic changes are known to profoundly impact cancer treatment outcomes. 2 There is thus an urgent need to clarify the mechanistic basis for osteosarcoma onset and progression in order to guide the more effective treatment of affected patients.
Secretion‐associated Ras‐related GTPase 1 (SAR1) is a GTPase that is highly conserved and plays a key role in regulating the trafficking of proteins from the endoplasmic reticulum (ER) to the Golgi apparatus. 4 , 5 , 6 Endoplasmic reticulum protein export is necessary for maintaining ER integrity and is regulated through the formation of COPII‐coated vesicles composed of the SEC13, SEC31, SEC23, SEC24, and SAR1 proteins. 4 The knockdown of SAR1 can result in unfolded protein accumulation and associated ER stress. 7 , 8 Two SAR1 paralogs with distinct roles have been identified to date, including SAR1A and SAR1B. 5 Lin et al. 9 found that ER stress was reduced by SAR1A/B upregulation, thus contributing to the enhanced survival of glioblastoma cells. SAR1B deletion is commonly observed in lung adenocarcinoma and squamous cell carcinoma cases among humans, 10 with the loss of SAR1A/B in mice enhancing lung tumor growth. 10 The specific biological functionality of SAR1A within tumors thus remains to be fully clarified.
RhoA is a small GTPase involved in regulating cellular migration and the dynamics of the actin cytoskeleton. 11 In gastric cancer, RHOA gain‐of‐function mutations have been linked to increases in the activation of focal adhesion kinase and associated dependency 12 ; in the context of intestinal stem cell maintenance, RhoA regulates EREG signaling. 13 Our prior work further suggests that RhoA can influence the resistance of osteosarcoma to pyropheophorbide‐α methyl ester‐mediated photodynamic therapy through the activation of Yes‐associated protein‐1 (YAP). 14 The association between SAR1A, RHOA, and YAP in the context of tumor invasivity and migratory activity has yet to be clarified.
The accumulation of large quantities of misfolded or unfolded proteins within the ER can contribute to stress that is associated with cancer and other disease states. 15 Inappropriate ER stress sensor activation and associated downstream signaling activity can thus contribute to oncogenesis and metastatic progression. 16 SAR1A is one of five core COPII coat proteins, 6 and the loss of SAR1A can induce unfolded protein accumulation and consequent ER stress. 7 , 8 The alleviation of such stress relies upon the induction of the unfolded protein response, which simultaneously decreases secretory protein loads, improves protein folding capacity within the ER, and enhances the clearance of unfolded proteins through the ER‐associated degradation mechanism and autophagy. 17 , 18 While autophagy can promote Snail degradation and influence epithelial–mesenchymal transition (EMT) induction in a p62/Sequestosome‐1‐dependent fashion, 19 how SAR1A deficiencies contribute to osteosarcoma cell invasivity, metastasis, and EMT induction remain poorly defined. The role of SAR1A deficiency to induce autophagy on EMT, invasion, and metastasis of osteosarcoma has not been reported.
Herein, we undertook a series of in vitro analyses that revealed SAR1A to be upregulated in osteosarcoma patient metastatic tissues and correlated with poor prognostic outcomes. Knocking down SAR1A inhibited osteosarcoma cell migratory and invasive activity through the inhibition of RhoA/YAP signaling activity. We further determined that such SAR1A knockdown induced ER stress and reactive oxygen species (ROS) production, ultimately leading to autophagic activity and the reduced migratory and invasive activity of osteosarcoma cells.
2. MATERIALS AND METHODS
2.1. Osteosarcoma patient sample analyses
Samples of pulmonary metastases from five patients that had been formalin‐fixed and paraffin‐embedded from the Chongqing University Three Gorges Hospital. All patients provided informed consent. The Chongqing University Three Gorges Hospital ethics committee approved this study, which conforms to the provisions of the Declaration of Helsinki. The osteosarcoma dataset (Mesenchymal) ‐ Kuijjer ‐ 127 ‐ vst ‐ ilmnhwg6v2) consisting of 127 osteosarcoma samples in R2: Genomics Analysis and Visualization Platform (https://r2.amc.nl) was used for result validation.
2.2. Cell culture and treatment
MG63, U2OS, HOS, SAOS2, and 143B human osteosarcoma cells were obtained from the Chinese Academy of Sciences Cell Bank and grown in DMEM supplemented with 10% FBS and penicillin/streptomycin in a 37°C humidified 5% CO2 incubator. Cells were treated using the ROS scavenger N‐acetylcysteine (NAC) (Cat.HY‐B0215; MedChemExpress), the YAP inhibitor verteporfin (Cat.S1786; Selleck), and the autophagy inhibitor 3‐methyladenine (3‐MA) (Cat.HY‐19312; MedChemExpress) for appropriate time periods, as detailed in the figure legends.
2.3. Lentiviral transduction
SAR1A or RHOA‐specific shRNA sequences (shSAR1A or shRHOA) were purchased from Hanbio Biotechnology as shown in Table S1. Lentiviral vectors were prepared as per provided directions and used to infect MG63 and 143B cells. RHOA overexpression vectors (OE‐RHOA) were purchased from Hanbio Biotechnology. Amplification primers are listed in Table S2, and western blotting was utilized to gauge target gene expression changes.
2.4. Western blotting and RhoA GTPase assays
We used RIPA lysis buffer (Beyotime) to extract protein from cells and samples, and a BCA kit (Beyotime) was used to measure protein concentrations. Samples were next boiled, and equal protein amounts (30 μg) were separated by SDS‐PAGE (EpiZyme) before being transferred to PVDF membranes (Millipore). Blots were then blocked for 2 h using 5% BSA or 5% nonfat milk at room temperature, followed by an overnight incubation with primary Abs (Table S3) at 4°C. Following 1 h of incubation with secondary Abs, proteins were detected with the use of a high sensitivity electrochemiluminescence detection kit and a chemiluminescence imaging system (Bio‐Rad). ImageJ was then used for densitometric analyses.
A Rho Activation Assay Biochem Kit (Cat. #BK036; Cytoskeleton, Inc.) was utilized based on provided directions to quantify GTPase activity levels.
2.5. Wound healing assay
Osteosarcoma cells were plated in six‐well plates (4 × 10⁵/well) and grown to confluence, at which time a scratch wound was generated in the monolayer surface using a 200 μl sterile pipette tip. Wounds were imaged at 0 and 24 h, and ImageJ was used to analyze rates of cell migration.
2.6. Transwell assay
Osteosarcoma cells were added to the upper chamber of a Transwell plate (8 μm pore size; Corning) (6 × 10⁴ cells/well), with wells being uncoated for migration assays and coated using Matrigel for an invasion assay. Following culture for 24 h, 4% paraformaldehyde was used to fix cells followed by their staining using 0.1% crystal violet. Migratory cells in five fields of view were then counted by microscopy (Olympus).
2.7. Reactive oxygen species analyses
A Reactive Oxygen Species Assay Kit (Cat. S0033S; Beyotime) was used based on provided directions to assess ROS levels in prepared cells.
2.8. Transmission electron microscopy
Cells were harvested using 0.25% trypsin and resuspended at 1.0 × 10⁶ cells/ml, fixed overnight using 2.5% glutaraldehyde and 1% osmic acid at 4°C, cut into ultrathin sections, stained using uranyl acetate and lead citrate, and assessed by transmission electron microscope (TEM) (JEM‐1400 Plus; JEOL).
2.9. Immunohistochemical staining
SAR1A immunohistochemical staining was carried out by fixing cells using 4% paraformaldehyde, embedding them in paraffin, and cutting them with a microtome into 4‐μm sections. Sections were subsequently blocked, stained with primary Abs (1:200) (Table S3), and imaged with a microscope. Tissue staining was independently undertaken by two experienced pathologists, with both the percentage positive staining area (0, negative; 1, ≤10%; 2, 10%–50%; and 3, ≥50%) and staining intensity (0, no; 1, weak; 2, moderate and 3, strong) being scored for each sample. These two scores were then multiplied together to yield an immunoreactivity score (IRS) (0–9). The median IRS value was used to define the threshold between low and high levels of SAR1A expression.
2.10. Immunofluorescent staining and lamellipodia analyses
Cells were fixed for 20 min using 4% formaldehyde (methanol‐free), followed by permeabilization for 20 min using 0.5% Triton X‐100 at 4°C. Cells were then rinsed three times with PBS and blocked for 1 h using 5% BSA at room temperature, followed by overnight incubation at 4°C using primary Abs (Table S3). Three additional 10‐min washes were carried out using 0.5% PBST. Samples were then probed at room temperature for 1 h with secondary AF488‐conjugated Abs (1:1000) (Cat. A32731; Invitrogen) in the dark. Cells were then evaluated by fluorescence microscopy. Lamellipodia formation was evaluated by fixing cells and staining them in the dark for 1 h with Actin Tracker Green–phalloidin (Cat. C2201S; Beyotime) to detect F‐actin at room temperature, followed by laser scanning confocal microscopy (600×; Nikon). Lamellipodia were then evaluated using ImageJ.
2.11. Tumor xenograft model development
The impact of knocking down SAR1A on spontaneous tumor metastasis was assessed using BALB/c nude mice (5 weeks old; Laike Jingda Experimental Animal Co. Ltd) into which 143B‐shSAR1A‐2 or 143B‐shNC cells (5 × 10⁶) were orthotopically injected in the para‐osseous proximal tibia. Body weight values were then measured every third day for 30 days, after which mice were killed. Tumors were then harvested for western blotting, while lungs were subjected to routine H&E staining and the number of metastatic nodules therein was counted.
2.12. Statistical analysis
Data are representative of three or more independent experiments and compared by Student's t‐test and one‐way ANOVAs, with p < 0.05 as the threshold of significance unless otherwise indicated.
3. RESULTS
3.1. SAR1A overexpressed in metastatic osteosarcoma and associated with decreased osteosarcoma patient metastasis‐free survival
To begin assessing the expression of SAR1A in osteosarcoma, we began by assessing microarray gene expression data pertaining to osteosarcoma patients from the GEO database (GSE42352). These analyses indicated that 49 patients with lower levels of SAR1A expression survived for significantly longer than the 39 patients with higher SAR1A expression levels (Figure 1A). SAR1A expression was increased in samples of osteosarcoma patient tumor biopsy tissues relative to the levels in normal bone tissue (Figure 1B). Sequencing data analyses revealed significant increases in SAR1A expression levels in metastatic osteosarcoma samples relative to nonmetastatic samples (Figure 1C,D). Immunohistochemical staining similarly confirmed that SAR1A expression was significantly increased in metastatic lung tissues from osteosarcoma patients relative to the levels in primary tumor tissues (Figure 1E,F). We then evaluated SAR1A protein levels in different osteosarcoma cell lines (HOS, SAOS2, U2OS, MG63, and 143B) by western blotting, which revealed that 143B and MG63 cells show the highest expression levels (Figure 1G,H). We then generated MG63 and 143B cells in which SAR1A was stably knocked down using lentiviral vectors (Figure 1I,J).
FIGURE 1.
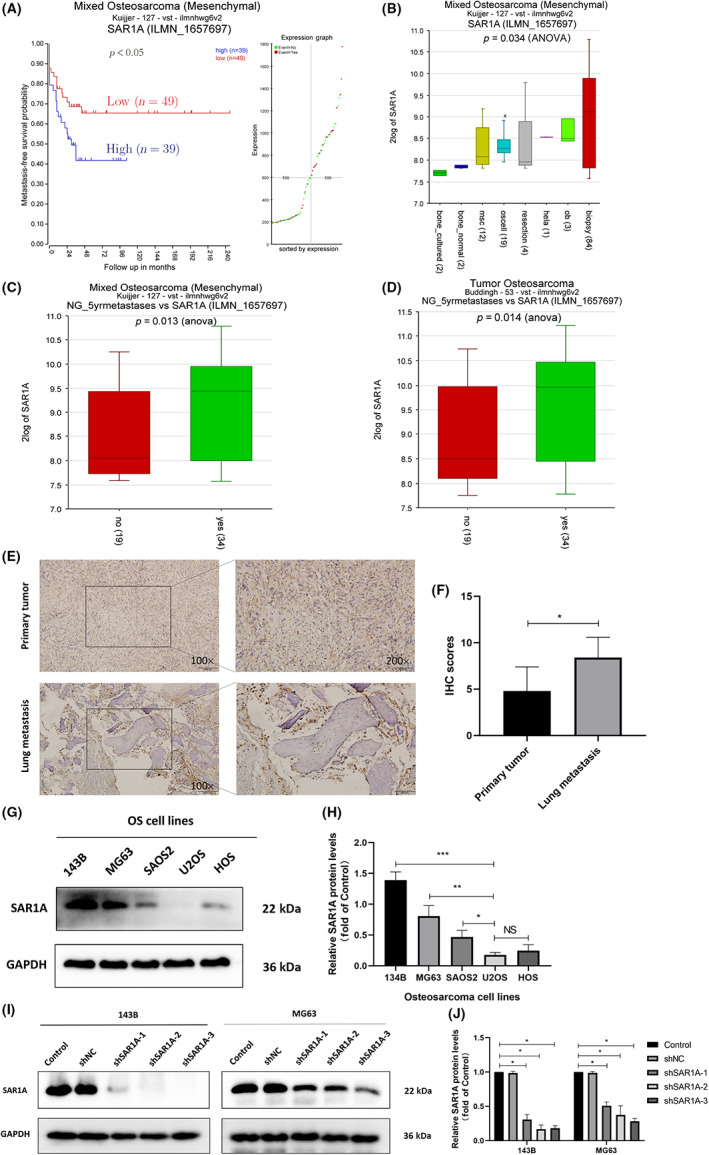
SAR1A upregulation in osteosarcoma is associated with poor patient prognosis. (A) In total, 39 and 49 osteosarcoma patients with high and low levels of SAR1A expression, respectively, experienced metastasis‐free survival. (B) SAR1A expression levels in osteosarcoma biopsy samples, osteoblasts, osteosarcoma cells, mesenchymal cells, and healthy bone tissue. biospsy, 84 biopsy samples of osteosarcoma cases; bone_cultured, cultured bone cells; bone_normal, normal bone tissue; hela, HeLa cells; msc, mesenchymal stem cells; ob, osteoblast; oscell, osteosarcoma cells; resection, osteosarcoma resection samples. (C, D) SAR1A levels in osteosarcoma patients with metastatic and nonmetastatic disease. (E, F) SAR1A levels were measured by immunohistochemical (IHC) staining in primary tumors and lung metastases from five osteosarcoma patients. (G, H) SAR1A levels were measured by western blotting in osteosarcoma cell lines (143B, MG63, SAOS2, U2OS, and HOS). (I, J) Levels of SAR1A in MG63 and 143B cells were assessed by western blotting following lentiviral transfection, with GAPDH serving as a normalization control. Control, wild‐type osteosarcoma cells; shNC, cells transduced with no targeting vector; shSAR1A, SAR1A knockdown cells. All analyses were repeated three times. * p <0.05, ** p <0.01, *** p <0.001 (mean ± SD).
3.2. Knocking down SAR1A suppresses osteosarcoma cell migration, invasion, and EMT induction
To establish the migratory and invasive activity of osteosarcoma cells following the modulation of SAR1A expression, Transwell and wound healing assays were used to evaluate MG63 and 143B cells in which SAR1A was stably knocked down. In both of these cell lines, shSAR1A treatment was associated with impaired invasivity and migration relative to control cells (Figure 2A–H). Epithelial–mesenchymal transition is a process that is integral to tumor cell metastasis. 20 , 21 , 22 Through western blotting, we assessed EMT‐associated marker protein expression in these cell lines and observed increased E‐cadherin levels and reduced Snail, Vimentin, MMP‐9, and N‐cadherin expression in SAR1A‐knockdown cells relative to controls (Figure 2I,J). Consistently, Vimentin expression in 143B and MG63 cells fell following the knockdown of SAR1A, as measured by immunofluorescent staining (Figure 2K,L). These data thus point to the fact that knocking down SAR1A can alter EMT induction, thereby suppressing osteosarcoma cell migration and invasion.
FIGURE 2.
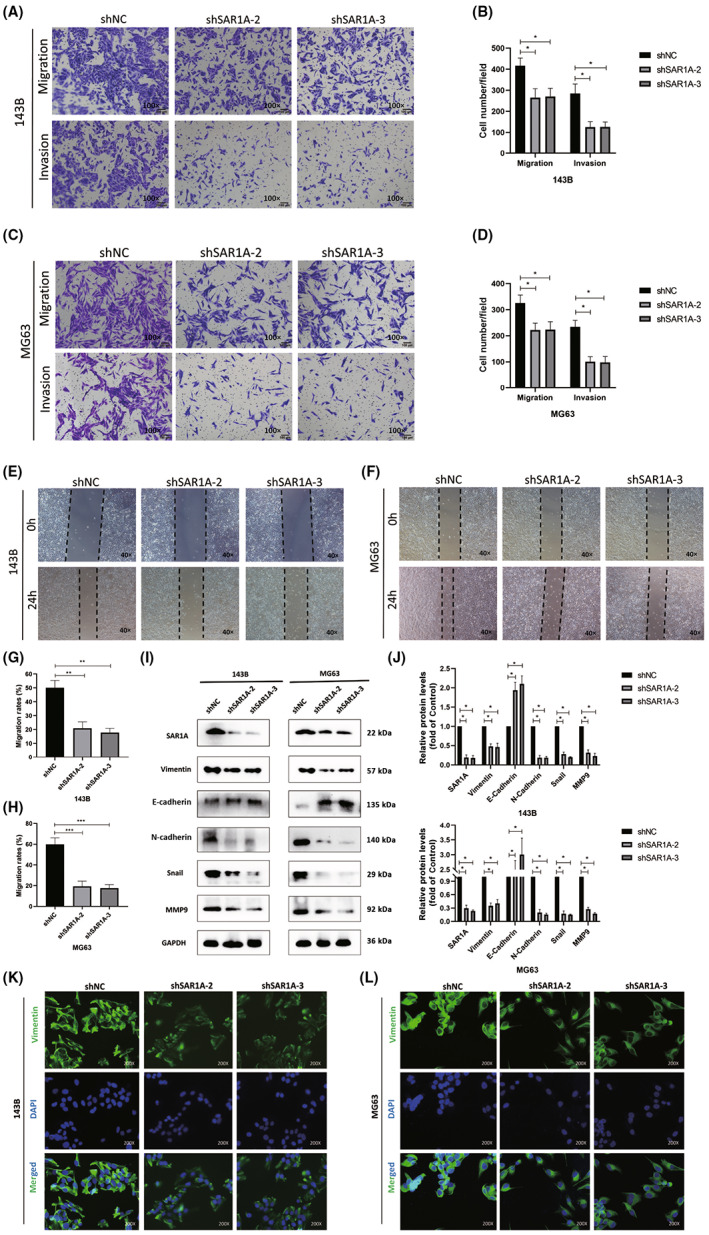
Knocking down SAR1A suppresses osteosarcoma cell migration, invasion, and epithelial–mesenchymal transition (EMT) induction. (A–D) Transwell assays were used to evaluate MG63 and 143B migratory and invasive activity following the knockdown of SAR1A. (E–H) Wound healing assay were used to monitor MG63 and 143B cell migration. (I, J) Western blotting was utilized to analyze EMT marker expression in transfected MG63 and 143B cells, with GAPDH being utilized for normalization purposes. (K, L) Immunofluorescent staining was used to assess vimentin expression in MG63 and 143B cells following transfection. Analyses were repeated three times. shNC, normal control. * p <0.05, ** p <0.01, *** p <0.001 (mean ± SD).
3.3. SAR1A regulates RhoA to control formation of lamellipodia in osteosarcoma cells
The expression of RHOA and SAR1A were found to be strongly positively correlated in a bioinformatics analysis of osteosarcoma patient samples (Figure 3A). Rates of metastasis‐free survival for 88 osteosarcoma patients were significantly lower among individuals showing higher levels of RHOA expression (Figure 3B). Western blotting further revealed reductions in total RhoA and activated RhoA in osteosarcoma cells following the knockdown of SAR1A, with a concomitant drop in F‐actin expression (Figure 3C,D). Lamellipodia are important regulators of the motility of tumor cells and are composed of F‐actin, the degradation of which results in the destruction of these cellular structures. 23 Phalloidin was therefore used to undertake F‐actin staining in these two osteosarcoma cell lines, revealing that SAR1A knockdown led to a significant drop in the number of visible lamellipodia on the surface of these cells, with visible surface smoothing as compared to control cells (Figure 3E–H). These data suggest that SAR1A can promote lamellipodia formation within osteosarcoma cells through the regulation of RhoA, thereby enhancing the migratory and invasive activity of these cells.
FIGURE 3.
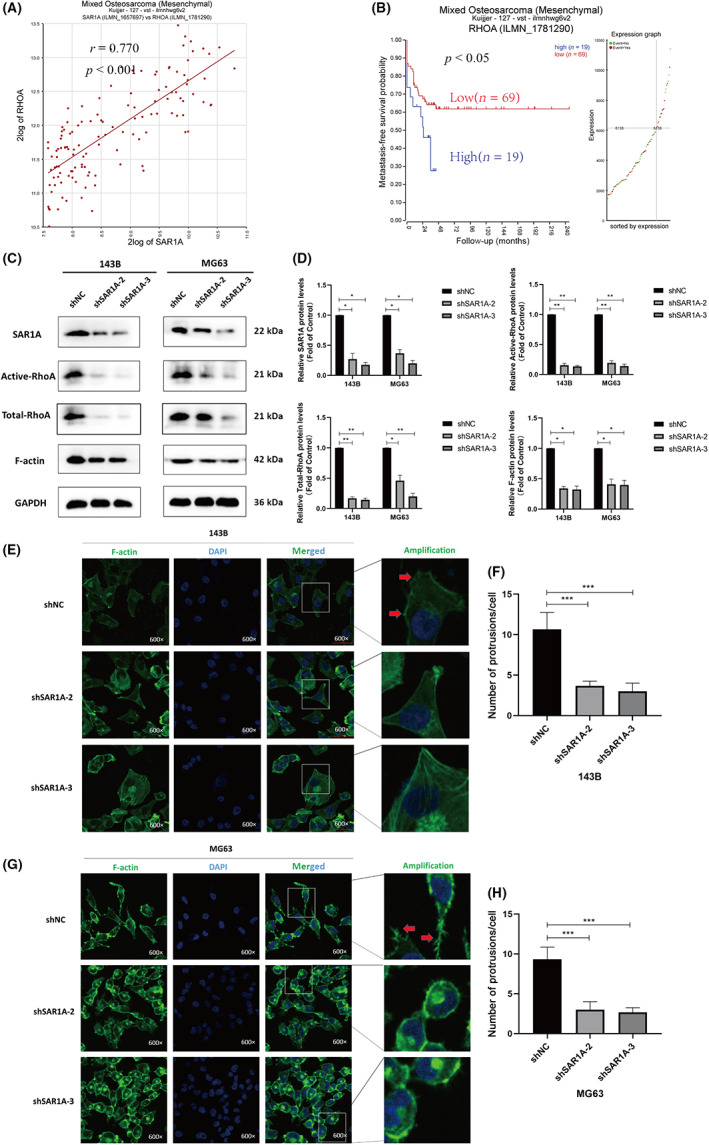
Knocking down SAR1A modulates RhoA activation and thereby inhibits the formation of lamellipodia in osteosarcoma cells. (A) Expression of RHOA and SAR1A was positively correlated within osteosarcoma samples (r = 0.770, p < 0.001). (B) Rates of metastasis‐free survival in osteosarcoma patients with low or high RHOA expression levels were compared. (C, D) GTPase assays and western blotting were utilized to measure total RhoA, active RhoA (RhoA‐GTP), and F‐actin expression in MG63 and 143B cells following transfection, with GAPDH being utilized for normalization. (E–H) Phalloidin and DAPI were used for the staining of F‐actin and nuclei, respectively, followed by laser confocal microscope imaging (600×). Red arrows indicate protrusions. Analyses were repeated three times. shNC, normal control. * p <0.05, ** p <0.01, *** p <0.001 (mean ± SD).
3.4. Overexpression of SAR1A promotes osteosarcoma cell migration and invasion
To further verify the regulatory role of SAR1A in the migration and invasion abilities of osteosarcoma cells, we overexpressed SAR1A in U2OS (Figure S1A,B). Echoing the previous results, western blotting showed that total RhoA was present in SAR1A‐overexpressed U2OS and activated RhoA increased (Figure S1C,D). The migration and invasion abilities of U2OS were also enhanced after SAR1A overexpression (Figure S1E–H).
3.5. RhoA regulates YAP activation to control osteosarcoma cell EMT induction, invasion, and migration
To further validate the functional importance of RhoA as a regulator of migratory and invasive activity in osteosarcoma, we next generated MG63 and 143B cells in which RHOA was either stably knocked down or overexpressed, as verified by western blotting (Figure 4A–D). In subsequent wound healing assays, the migratory activity of 143B and MG63 cells following the knockdown of RHOA was significantly impaired relative to that in control cells (Figure 4E–H), and a consistent drop in the protein level expression of N‐cadherin along with an increase in E‐cadherin expression was observed following RHOA silencing, consistent with impaired EMT induction (Figure 4I–J). When verteporfin was used to inhibit YAP activation as a pretreatment for these osteosarcoma cells, Transwell assays revealed significant impairment of the invasivity and migratory activity of these cells. While RHOA overexpression significantly increased the migration and invasion of these osteosarcoma cell lines, these effects were significantly reduced in the OE‐RHOA + verteporfin group relative to the OE‐RHOA group (Figure 4L,M). Western blotting further revealed that, following verteporfin pretreatment, levels of non‐p‐YAP (activated YAP) and the YAP target gene CTGF were significantly decreased, whereas they were upregulated in the context of RHOA overexpression. Verteporfin was able to partially rescue the effects of RHOA overexpression in this assay context. Verteporfin pretreatment reduced the expression of EMT markers (vimentin, N‐cadherin, Snail, and MMP‐9) in these osteosarcoma cells, whereas RHOA overexpression resulted in their upregulation, and verteporfin was consistently able to partially reverse these RHOA overexpression‐dependent effects (Figure 4N,O). These data thus suggest that RhoA can promote invasivity, migratory activity, and EMT induction in osteosarcoma through the regulation of YAP activation.
FIGURE 4.
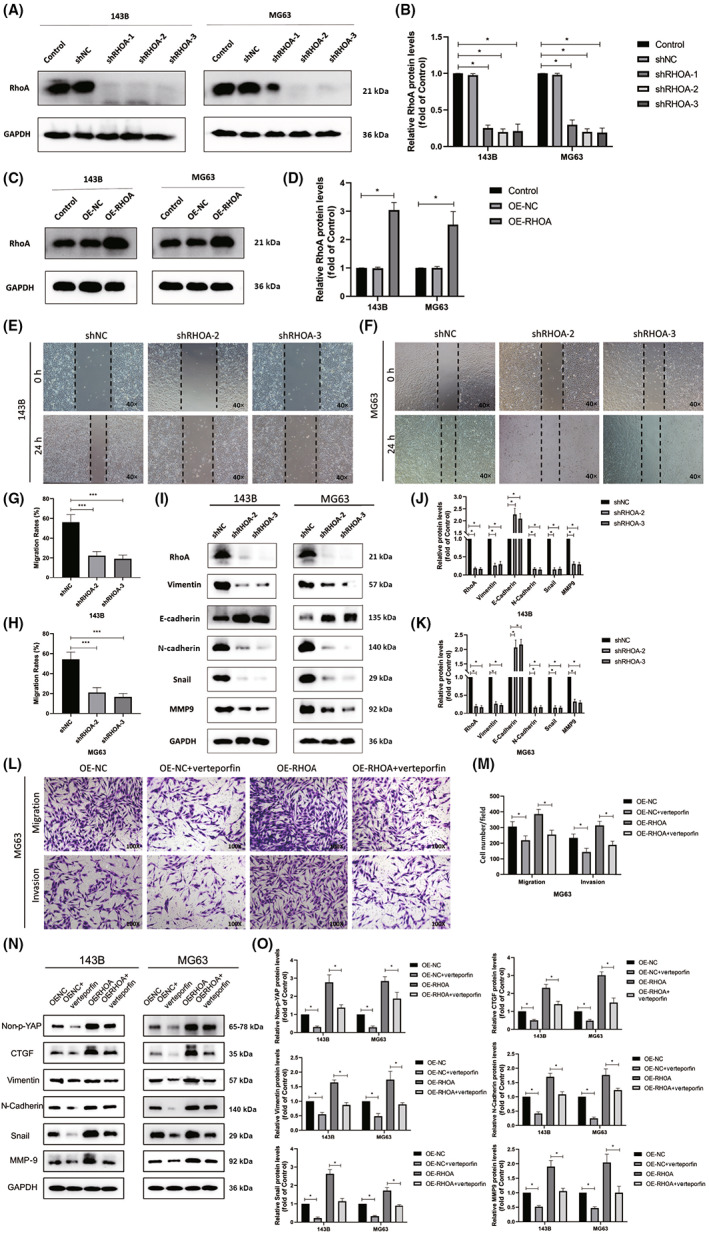
RhoA induces osteosarcoma cell invasion and migration through the induction of YAP activity. (A–D) Western blotting was used to measure the expression of RhoA in MG63 and 143B cells following the knockdown or overexpression (OE) of RhoA, with GAPDH being used for normalization. (E–H) MG63 and 143B cell migration was assessed by wound healing assay following the knockdown of SAR1A. (I–K) Western blotting was used to assess levels of epithelial–mesenchymal transition (EMT) markers within MG63 and 143B cells following transfection, with GAPDH being used for normalization. (L, M) Transwell assays were used to evaluate MG63 cells following the overexpression of SAR1A or pretreatment for 24 h verteporfin (2 μM). (N, O) Expression of active YAP (non‐p‐YAP), EMT markers, and CTGF was assessed by western blotting in MG63 and 143B cells following the overexpression of SAR1A or pretreatment for 24 h verteporfin (2 μM), with GAPDH being utilized for normalization. Analyses were repeated three times. NC, normal control. * p <0.05, *** p <0.001 (mean ± SD).
3.6. Knocking down SAR1A induces ER stress and ROS generation
Prior work suggests that SAR1 expression is critical for the appropriate transport of proteins from the ER to the Golgi apparatus, 4 such that a loss of SAR1 expression results in unfolded protein accumulation and consequent ER stress. 7 , 8 To confirm this model, we assessed ER stress marker expression by western blotting and observed significant increases in p‐eIF2α, ATF4, and CHOP levels following SAR1A knockdown as compared to levels in control cells (Figure 5A,B). Notably, SAR1A knockdown also resulted in reduced GRP78 expression relative to control levels (Figure 5A,B). Many reports have highlighted the potential oncogenic activity of GRP78, 24 , 25 , 26 although additional work will be necessary to explore its mechanistic role in osteosarcoma. We further evaluated the expression of redox‐related antioxidant proteins, revealing both SOD1 and catalase to be downregulated following SAR1A knockdown as compared to control levels (Figure 5A,B). Consistently, a ROS‐specific probe revealed higher ROS levels within osteosarcoma cells following the silencing of SAR1A relative to control treatment, and the ROS scavenger NAC was sufficient to partially rescue the effects of SAR1A knockdown (Figure 5C,D). Reactive oxygen species accumulation can induce ER stress through several different signaling mechanisms. 16 These data indicate that the knockdown of SAR1A can induce ER stress and ROS generation, and thereby compromise osteosarcoma cell invasivity and migration.
FIGURE 5.
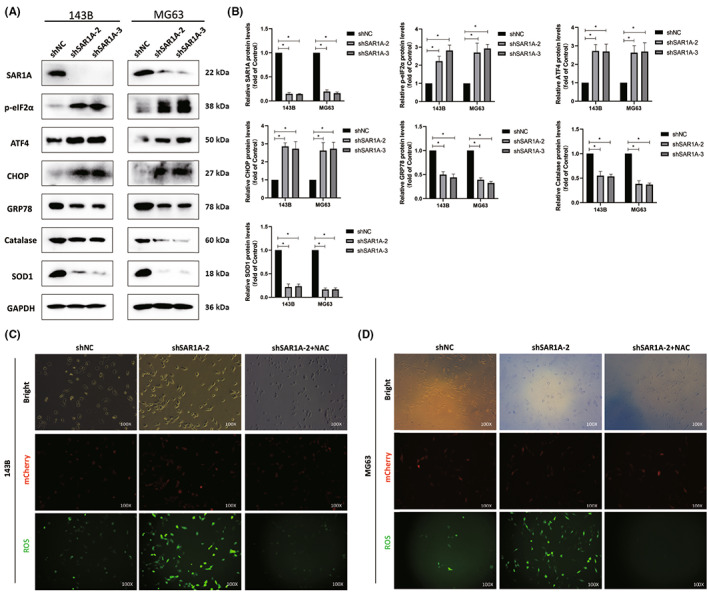
Knocking down SAR1A induces reactive oxygen species (ROS) generation and endoplasmic reticulum (ER) stress. (A, B) SAR1A knockdown resulted in reductions in the expression of GRP78, SOD, and CAT together with increases in the levels of ER stress markers (p‐eIF2α, ATF4, and CHOP). (C, D) ROS fluorescence probe was used to detect ROS content in osteosarcoma cells after SAR1A knockdown or N‐acetylcysteine (NAC) pretreatment (10 mmol/L for 12 h). Analyses were repeated three times. shNC, normal control. * p <0.05 (mean ± SD).
3.7. Knockdown of SAR1A induces autophagic activity and thereby suppresses osteosarcoma cell migratory and invasive activity
Prior work has indicated that ER stress and ROS generation can promote autophagic induction, 27 , 28 , 29 with both ER stress and autophagy further suppressing metastatic progression. 30 , 31 , 32 To evaluate the ability of SAR1A to influence osteosarcoma cell autophagic activity, we next undertook western blotting experiments, which revealed significant increases in LC3I to LC3II conversion and significant reductions in P62 levels following SAR1A knockdown as compared to control cells (Figure 6A,B). Increases in LC3I to LC3II conversion are a hallmark of autophagic activity. We next evaluated ultrastructural changes in 143B cells by TEM, revealing that significantly more autophagosomes were visible following SAR1A knockdown as compared to control cells (Figure 6C). Immunofluorescent staining was further carried out to assess LC3II levels within MG63 and 143B cells, revealing significant increases in the numbers of fluorescent LC3II punctae following SAR1A knockdown relative to control cells, whereas pretreatment with the early autophagy inhibitor 3‐MA significantly reduced this effect (Figure 6D–G). These results strongly suggest that the knockdown of SAR1A can promote autophagic activity within osteosarcoma cells.
FIGURE 6.
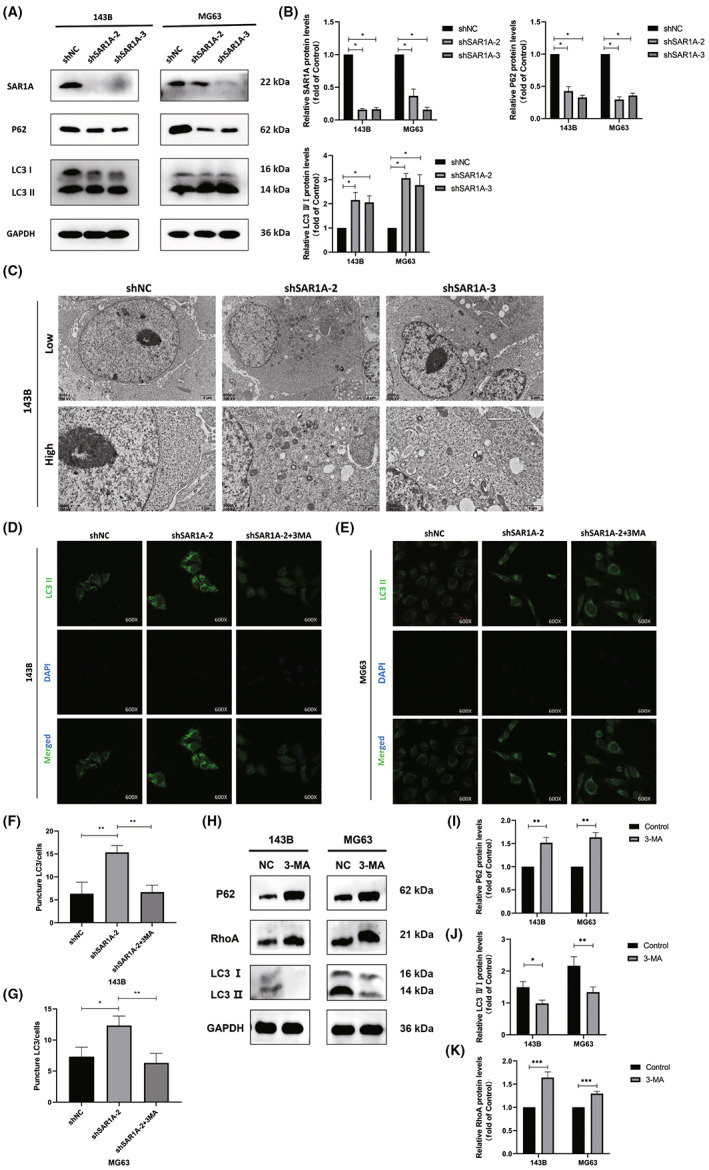
Knocking down SAR1A in osteosarcoma cells induces autophagic activity. (A, B) Autophagy‐associated protein levels in MG63 and 143B cells were assessed by western blotting, with GAPDH being used for normalization. (C) Representative transmission electron microscopy images highlighting ultrastructural changes consistent with the induction of autophagic activity in 143B cells following shSAR1A or normal control (shNC) transfection. (D–G) Punctate LC3II fluorescence was evident in 143B and MG63 cells following SAR1A knockdown in cells that were or were not treated with 3‐methyladenine (3‐MA; 5 mmol/L) for 12 h. (H–K) RhoA expression was decreased in 143B and MG63 cells after 12 h treatment with 3‐MA (5 mmol/L). Analyses were repeated three times. * p <0.05, ** p <0.01, *** p <0.001 (mean ± SD).
Subsequently, we detected the expression of RhoA after the action of 3‐MA, and found that the expression of RhoA decreased after the inhibition of autophagy, suggesting that inhibition of autophagy might downregulate the expression of RhoA (Figure 6H–K).
3.8. Knocking down SAR1A suppresses in vivo osteosarcoma cellular metastasis
To confirm the physiological relevance of our above results, we next examined the ability of SAR1A knockdown to impact spontaneous osteosarcoma cell metastasis in mice. Lung metastases were evident in 80% (4/5) of mice in the shNC group but in just 20% (1/5) of mice in the shSAR1A‐2 group (1/5) (Figure 7A,C,D), and no differences in murine body weight were observed between these groups over the study period (Figure 7B). Primary tumors were then harvested and analyzed by western blotting. In line with the above in vitro evidence, tumors from the shSAR1A‐2 treatment group showed reductions in the expression of active RhoA, non‐p‐YAP, and CTGF as compared to levels in the shNC group (Figure 7E,F). In summary, knocking down SAR1A thus inhibits in vivo osteosarcoma cell metastasis.
FIGURE 7.
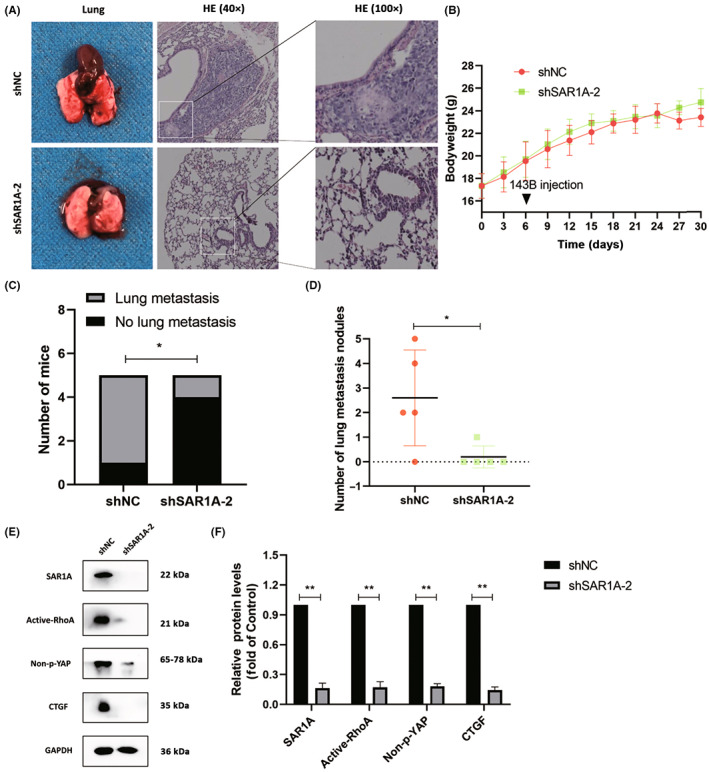
Knocking down SAR1A suppresses the in vivo metastasis of osteosarcoma cells. (A) Gross and H&E‐stained images of metastatic nodules from nude mice in the normal control (shNC) and shSAR1A‐2 groups. (B) Changes in bodyweight following in situ tibial 143B cell injection in mice. (C) Lung metastasis numbers in the shSAR1A‐2 and shNC groups. (D) Metastatic pulmonary nodules in shNC and sh‐SAR1A‐2 group mice. (E, F) Active‐RhoA, Non‐p‐YAP, and CTGF levels in primary tumors were measured by western blotting. Analyses were repeated three times. * p <0.05, ** p <0.01 (mean ± SD).
4. DISCUSSION
Prior work has determined that CYP17A1 can maintain glioblastoma cell survival by controlling the SAR1a/b‐mediated processing of proteins within the ER. 9 The SAR1B GTPase is essential for protecting intestinal cells against inflammation, oxidative stress, and impaired lipid homeostasis, 33 and the knockdown of the paralogous SAR1A and SAR1B in mice can enhance the growth of lung tumors in an mTORC1‐dependent fashion. 10 These data suggest that SAR1A plays a tumor type‐specific role in the context of oncogenic regulation. Through online bioinformatics analyses, we herein found that SAR1A expression in normal lung tissues is increased relative to that in tumor tissues (R2: Two Gene View for NG_tissue with SAR1A (amc.nl), gse19804), with the highest levels of SAR1A expression in normal pulmonary tissue followed by levels in adenocarcinoma tissues, whereas its expression was lowest in squamous cell carcinoma (R2: Two Gene View for NG_histology with SAR1A (amc.nl), gse33532), in line with prior reports. 10 How SAR1A influences osteosarcoma progression, however, has not been previously clarified. Here, we found that osteosarcoma patients with high levels of SAR1A expression showed significantly decreased 5‐year metastasis‐free survival compared to patients expressing lower levels of this gene. Consistently, osteosarcoma patient tumor biopsy samples revealed higher SAR1A expression compared to that in normal bone tissues, and this expression was further elevated in osteosarcoma patients with metastatic disease. Mechanistically, SAR1A was able to drive the migratory, invasive, and EMT activities of osteosarcoma cells, thus suggesting that it might function as a key mediator of osteosarcoma progression.
We have previously shown that RhoA can activate YAP and thereby increase osteosarcoma tumor resistance to photodynamic therapy. 14 Kim et al. posited that p‐Tyr42 RhoA can bind to the promoters of specific genes within the nucleus, thereby controlling their expression and contributing to oncogenic processes. 34 RhoA pathway activation in gastric cancer is conducive to invasivity, metastasis, and EMT induction, 12 , 35 and RhoA also serves as a mediator of tumor chemoresistance. 36 The specific mechanisms whereby SAR1A can control the RhoA/YAP axis to drive the metastatic progression of osteosarcoma, however, have yet to be elucidated. Here, we observed a strong positive correlation between RHOA and SAR1A gene expression in osteosarcoma, and found high levels of RhoA expression to be associated with significant reductions in patient 5‐year metastasis‐free survival rates. Knocking down SAR1A within osteosarcoma cells decreased the protein levels and activity of RhoA together with a drop in cellular motility. RHOA knockdown further decreased the invasive and migratory activity of osteosarcoma cells, while YAP inhibitor treatment was sufficient to partially reverse these RHOA‐OE‐dependent effects in line with prior reports. 12 , 34 , 35 Our data suggest that SAR1A can modulate the RhoA/YAP pathway and thereby regulate invasive and migratory activity.
As one of five proteins that composes the COPII complex, SAR1A plays an integral role in the maintenance of ER integrity. 4 , 6 The loss of SAR1A expression enhances ROS production, unfolded protein accumulation, and ER stress induction. 7 , 8 , 9 Autophagy is a highly conserved cellular process whereby proteins and organelles can be recycled under stress conditions, leading to a concomitant burst of ROS generation. 29 Herein, we found that SAR1A knockdown resulted in enhanced autophagic activity and ROS production within osteosarcoma cells. Under basal conditions, constitutive autophagic activity occurs, but it can be further induced in response to specific physiological conditions including ER stress, reduced energy levels, hormone exposure, hypoxia, or particular pharmacological agents. 37 Prolonged unfolded protein reaction (ER stress) is involved in the induction of chronic myeloid leukemia cell death. 38 Recent research has highlighted the dual roles that autophagy can play in the context of cancer. 37 Zhao et al. 39 determined that in glioma, YAP can promote autophagic activity and tumor progression through a mechanism dependent on HMGB1 upregulation. In contrast, we herein found that SAR1A knockdown resulted in a decrease in YAP activity levels within osteosarcoma cells together with a concomitant rise in ROS production and autophagic activity as well as a drop in migratory and invasive activity. Reactive oxygen species accumulation inhibits YAP activity by phosphorylation of LATS, thus exerting antitumor effects. 40 Recent work indicates that YAP can suppress autophagy and promote colorectal cancer cell migration through Bcl‐2 upregulation. 41 Grassi et al. 19 further found that autophagy can modulate EMT induction in hepatocytes by promoting the degradation of Snail. Moreover, in glioblastoma cells, autophagy can suppress migratory and invasive activity. 42 The oncogenic effects of autophagy are thus highly tumor type‐dependent.
Our results indicate an important role for SAR1A as a regulator of osteosarcoma invasion and metastasis that is linked to osteosarcoma patient prognosis. Knocking down this gene can modulate the RhoA/YAP pathway and thereby suppress the migratory and invasive activity of osteosarcoma cells (Figure 8).
FIGURE 8.
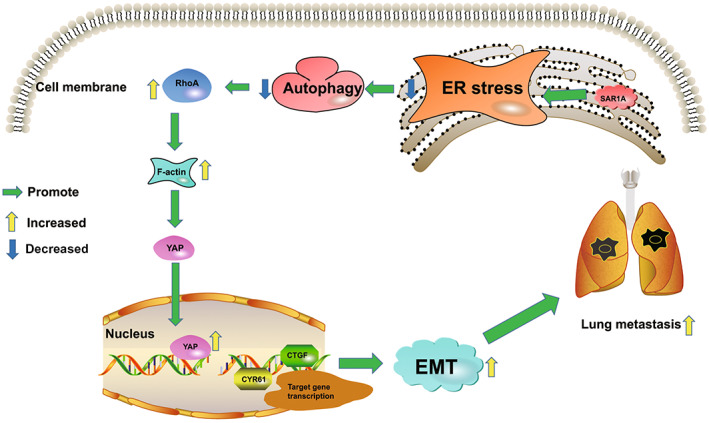
Schematic overview of the potential roles of SAR1A in osteosarcoma metastasis. SAR1A promotes YAP activation through the RhoA/F‐actin pathway and promotes the transcription of downstream target genes to induce osteosarcoma metastasis. EMT, epithelial–mesenchymal transition; ER, endoplasmic reticulum
In conclusion, these results offer novel evidence that SAR1A can function in an oncogenic manner to promote metastasis and to regulate autophagic activity. Knocking down SAR1A can prevent metastasis by modulating the RhoA/YAP pathway, offering new insight into the mechanisms whereby intratumoral autophagy is regulated and highlighting these pathways as promising targets for therapeutic intervention in osteosarcoma.
DISCLOSURE
The authors declare that they have no competing interests.
ETHICS STATEMENT
Approval of the research protocol by an institutional review board: The research protocol was approved by The Ethics Committee of Chongqing University Three Gorges Hospital. Informed consent: All contributors of osteosarcoma samples provided informed consent for the study. Registry and registration no. of the study/trial: 2021 Scientific Research No. (58). Animal studies: Animal experiments were reviewed by The Ethics Committee of Chongqing University Three Gorges Hospital and meet the requirements of animal ethics and welfare.
Supporting information
Table S1
Table S2
Table S3
Figure S1.
ACKNOWLEDGMENTS
This work was supported in part by The National Natural Science Foundation of China grants (81572634, 82172682), the General Project of Chongqing Natural Science Foundation (cstc2019jcyj‐msxmX0358, cstc2020jcyj‐msxmX0951, cstc cstc2021jcyj‐msxmX0909), Chongqing Medical Scientific Research Project (joint project of Chongqing Health Commission and Science and Technology Bureau) (2020FYYX087), and Graduate Education and Teaching Reform Research Project of Chongqing University (cquyjg21305), sponsored by the Foundation of Chongqing University Three Gorges Hospital (2022YJKYXM‐001, 2022YJKYXM‐043).
Zhan F, Deng Q, Chen Z, et al. SAR1A regulates the RhoA/YAP and autophagy signaling pathways to influence osteosarcoma invasion and metastasis. Cancer Sci. 2022;113:4104‐4119. doi: 10.1111/cas.15551
Lixin Xu, Jian Chen, and Yunsheng Ou contributed equally to this work.
Contributor Information
Yunsheng Ou, Email: ouyunsheng2001@163.com.
Jian Chen, Email: 284262176@qq.com.
Lixin Xu, Email: wangjiapothree456@163.com.
REFERENCES
- 1. Gill J, Gorlick R. Advancing therapy for osteosarcoma. Nat Rev Clin Oncol. 2021;18:609‐624. [DOI] [PubMed] [Google Scholar]
- 2. Meltzer PS, Helman LJ. New horizons in the treatment of osteosarcoma. New Engl J Med. 2021;385:2066‐2076. [DOI] [PubMed] [Google Scholar]
- 3. Aran V, Devalle S, Meohas W, et al. Osteosarcoma, chondrosarcoma and Ewing sarcoma: clinical aspects, biomarker discovery and liquid biopsy. Crit Rev Oncol Hematol. 2021;103340:162. [DOI] [PubMed] [Google Scholar]
- 4. Sato K, Nakano A. Mechanisms of COPII vesicle formation and protein sorting. FEBS Lett. 2007;581:2076‐2082. [DOI] [PubMed] [Google Scholar]
- 5. Melville DB, Studer S, Schekman R. Small sequence variations between two mammalian paralogs of the small GTPase SAR1 underlie functional differences in coat protein complex II assembly. J Biol Chem. 2020;295:8401‐8412. [DOI] [PMC free article] [PubMed] [Google Scholar]
- 6. Melville D, Gorur A, Schekman R. Fatty‐acid binding protein 5 modulates the SAR1 GTPase cycle and enhances budding of large COPII cargoes. Mol Biol Cell. 2019;30:387‐399. [DOI] [PMC free article] [PubMed] [Google Scholar]
- 7. Nakagawa H, Hazama K, Ishida K, Komori M, Nishimura K, Matsuo S. Inhibition of PLD1 activity causes ER stress via regulation of COPII vesicle formation. Biochem Biophys Res Commun. 2017;490:895‐900. [DOI] [PubMed] [Google Scholar]
- 8. Fang J, Liu M, Zhang X, et al. COPII‐dependent ER export: a critical component of insulin biogenesis and beta‐cell ER homeostasis. Mol Endocrinol. 2015;29:1156‐1169. [DOI] [PMC free article] [PubMed] [Google Scholar]
- 9. Lin HY, Ko CY, Kao TJ, et al. CYP17A1 maintains the survival of glioblastomas by regulating SAR1‐mediated endoplasmic reticulum health and redox homeostasis. Cancers (Basel). 2019;11:1378. [DOI] [PMC free article] [PubMed] [Google Scholar]
- 10. Chen J, Ou Y, Luo R, et al. SAR1B senses leucine levels to regulate mTORC1 signalling. Nature. 2021. 596:281‐284. [DOI] [PubMed] [Google Scholar]
- 11. Svensmark JH, Brakebusch C. Rho GTPases in cancer: friend or foe? Oncogene. 2019;38:7447‐7456. [DOI] [PubMed] [Google Scholar]
- 12. Zhang H, Schaefer A, Wang Y, et al. Gain‐of‐function RHOA mutations promote focal adhesion kinase activation and dependency in diffuse gastric cancer. Cancer Discov. 2020;10:288‐305. [DOI] [PMC free article] [PubMed] [Google Scholar]
- 13. Liu M, Zhang Z, Sampson L, et al. RHOA GTPase controls YAP‐mediated EREG signaling in small intestinal stem cell maintenance. Stem Cell Reports. 2017;9:1961‐1975. [DOI] [PMC free article] [PubMed] [Google Scholar]
- 14. Zhan F, He T, Chen Z, et al. RhoA enhances osteosarcoma resistance to MPPa‐PDT via the Hippo/YAP signaling pathway. Cell Biosci. 2021;11:179. [DOI] [PMC free article] [PubMed] [Google Scholar]
- 15. Hetz C, Zhang K, Kaufman RJ. Mechanisms, regulation and functions of the unfolded protein response. Nat Rev Mol Cell Biol. 2020;21:421‐438. [DOI] [PMC free article] [PubMed] [Google Scholar]
- 16. Chen X, Cubillos‐Ruiz JR. Endoplasmic reticulum stress signals in the tumour and its microenvironment. Nat Rev Cancer. 2021;21:71‐88. [DOI] [PMC free article] [PubMed] [Google Scholar]
- 17. Wang Y, Wang K, Jin Y, Sheng X. Endoplasmic reticulum proteostasis control and gastric cancer. Cancer Lett. 2019;449:263‐271. [DOI] [PubMed] [Google Scholar]
- 18. Lin Y, Jiang M, Chen W, Zhao T, Wei Y. Cancer and ER stress: mutual crosstalk between autophagy, oxidative stress and inflammatory response. Biomed Pharmacother. 2019;118:109249. [DOI] [PubMed] [Google Scholar]
- 19. Grassi G, Di Caprio G, Santangelo L, et al. Autophagy regulates hepatocyte identity and epithelial‐to‐mesenchymal and mesenchymal‐to‐epithelial transitions promoting snail degradation. Cell Death Dis. 2015; 6: e1880. [DOI] [PMC free article] [PubMed] [Google Scholar]
- 20. Yang J, Antin P, Berx G, et al. Guidelines and definitions for research on epithelial‐mesenchymal transition. Nat Rev Mol Cell Biol. 2020;21:341‐352. [DOI] [PMC free article] [PubMed] [Google Scholar]
- 21. Lu W, Kang Y. Epithelial‐mesenchymal plasticity in cancer progression and metastasis. Dev Cell. 2019;49:361‐374. [DOI] [PMC free article] [PubMed] [Google Scholar]
- 22. Lin YT, Wu KJ. Epigenetic regulation of epithelial‐mesenchymal transition: focusing on hypoxia and TGF‐beta signaling. J Biomed Sci. 2020;27:39. [DOI] [PMC free article] [PubMed] [Google Scholar]
- 23. Shi C, Cai Y, Li Y, et al. Yap promotes hepatocellular carcinoma metastasis and mobilization via governing cofilin/F‐Actin/lamellipodium axis by regulation of JNK/Bnip3/SERCA/CaMKII pathways. Redox Biol. 2018;14:59‐71. [DOI] [PMC free article] [PubMed] [Google Scholar]
- 24. Du T, Li H, Fan Y, et al. The deubiquitylase OTUD3 stabilizes GRP78 and promotes lung tumorigenesis. Nat Commun. 2019;10:2914. [DOI] [PMC free article] [PubMed] [Google Scholar]
- 25. Dadey DYA, Kapoor V, Hoye K, et al. Antibody targeting GRP78 enhances the efficacy of radiation therapy in human glioblastoma and non‐small cell lung cancer cell lines and tumor models. Clin Cancer Res. 2017;23:2556‐2564. [DOI] [PubMed] [Google Scholar]
- 26. Hernandez I, Cohen M. Linking cell‐surface GRP78 to cancer: from basic research to clinical value of GRP78 antibodies. Cancer Lett. 2022;524:1‐14. [DOI] [PubMed] [Google Scholar]
- 27. Li Y, Wang C, Xu T, et al. Discovery of a small molecule inhibitor of cullin neddylation that triggers ER stress to induce autophagy. Acta Pharm Sin B. 2021;11:3567‐3584. [DOI] [PMC free article] [PubMed] [Google Scholar]
- 28. Bhardwaj M, Leli NM, Koumenis C, Amaravadi RK. Regulation of autophagy by canonical and non‐canonical ER stress responses. Semin Cancer Biol. 2020;66:116‐128. [DOI] [PMC free article] [PubMed] [Google Scholar]
- 29. Zhou J, Li XY, Liu YJ, et al. Full‐coverage regulations of autophagy by ROS: from induction to maturation. Autophagy. 2021;18:1240‐1255. [DOI] [PMC free article] [PubMed] [Google Scholar]
- 30. Chiu C‐S, Tsai C‐H, Hsieh M‐S, et al. Exploiting Honokiol‐induced ER stress CHOP activation inhibits the growth and metastasis of melanoma by suppressing the MITF and β‐catenin pathways. Cancer Lett. 2019;442:113‐125. [DOI] [PubMed] [Google Scholar]
- 31. Limia CM, Sauzay C, Urra H, Hetz C, Chevet E, Avril T. Emerging roles of the endoplasmic reticulum associated unfolded protein response in cancer cell migration and invasion. Cancers (Basel). 2019;11:631. [DOI] [PMC free article] [PubMed] [Google Scholar]
- 32. Zada S, Hwang JS, Ahmed M, Lai TH, Pham TM, Kim DR. Control of the epithelial‐to‐mesenchymal transition and cancer metastasis by autophagy‐dependent SNAI1 degradation. Cells. 2019;8:129. [DOI] [PMC free article] [PubMed] [Google Scholar]
- 33. Sane A, Ahmarani L, Delvin E, Auclair N, Spahis S, Levy E. SAR1B GTPase is necessary to protect intestinal cells from disorders of lipid homeostasis, oxidative stress, and inflammation. J Lipid Res. 2019;60:1755‐1764. [DOI] [PMC free article] [PubMed] [Google Scholar]
- 34. Kim JG, Mahmud S, Min JK, et al. RhoA GTPase phosphorylated at tyrosine 42 by src kinase binds to beta‐catenin and contributes transcriptional regulation of vimentin upon Wnt3A. Redox Biol. 2021;40:101842. [DOI] [PMC free article] [PubMed] [Google Scholar]
- 35. Xu Z, Gu C, Yao X, et al. CD73 promotes tumor metastasis by modulating RICS/RhoA signaling and EMT in gastric cancer. Cell Death Dis. 2020;11:202. [DOI] [PMC free article] [PubMed] [Google Scholar]
- 36. Zheng CW, Zeng RJ, Xu LY, Li EM. Rho GTPases: promising candidates for overcoming chemotherapeutic resistance. Cancer Lett. 2020;475:65‐78. [DOI] [PubMed] [Google Scholar]
- 37. Lim SM, Mohamad Hanif EA, Chin SF. Is targeting autophagy mechanism in cancer a good approach? The possible double‐edge sword effect. Cell Biosci. 2021;11:56. [DOI] [PMC free article] [PubMed] [Google Scholar]
- 38. Wang F, Wang X, Li N, et al. Prolonged unfolded protein reaction is involved in the induction of chronic myeloid leukemia cell death upon oprozomib treatment. Cancer Sci. 2021;112:133‐143. [DOI] [PMC free article] [PubMed] [Google Scholar]
- 39. Zhao M, Zhang Y, Jiang Y, et al. YAP promotes autophagy and progression of gliomas via upregulating HMGB1. J Exp Clin Cancer Res. 2021;40:99. [DOI] [PMC free article] [PubMed] [Google Scholar]
- 40. Nakatani K, Maehama T, Nishio M, et al. Alantolactone is a natural product that potently inhibits YAP1/TAZ through promotion of reactive oxygen species accumulation. Cancer Sci. 2021;112:4303‐4316. [DOI] [PMC free article] [PubMed] [Google Scholar]
- 41. Jin L, Chen Y, Cheng D, et al. YAP inhibits autophagy and promotes progression of colorectal cancer via upregulating Bcl‐2 expression. Cell Death Dis. 2021;12:457. [DOI] [PMC free article] [PubMed] [Google Scholar]
- 42. Catalano M, D'Alessandro G, Lepore F, et al. Autophagy induction impairs migration and invasion by reversing EMT in glioblastoma cells. Mol Oncol. 2015;9:1612‐1625. [DOI] [PMC free article] [PubMed] [Google Scholar]
Associated Data
This section collects any data citations, data availability statements, or supplementary materials included in this article.
Supplementary Materials
Table S1
Table S2
Table S3
Figure S1.


