

Abstract
Research on medicinal plants is developing each day due to inborn phytochemicals, which can encourage the progress of novel drugs. Most plant-based phytochemicals have valuable effects on well-being. Among them, beetroot leaves (BL) are known for their therapeutic properties. Here, three solvents, namely, acetonitrile, ethanol, and water, and their combinations were developed for BL extraction and simultaneous assessment of phytochemical compounds and antioxidant and antifoodborne pathogen bacteria activities. By using the augmented simplex-centroid mixture design, 40.40% acetonitrile diluted in water at 38.74% and ethanol at 20.86% favored the recovery of 49.28 mg GAE/mL (total phenolic content (TPC)) and 0.314 mg QE/mL (total flavonoid content (TFC)), respectively. Acetonitrile diluted in water at 50% guarantees the best antioxidant activity, whereas the optimal predicted mixture for the highest antibacterial activity matches 24.58, 50.17, and 25.25% of acetonitrile, ethanol, and water, respectively. These extraction conditions ensured inhibition of Staphylococcus aureus, Salmonella enterica, and Escherichia coli, respectively, at 0.402, 0.497, and 0.207 mg/mL. Under optimized conditions, at three concentrations of BL, minimal inhibitory concentration (MIC), 2 × MIC, and 4 × MIC, a linear model was employed to investigate the inhibition behavior against the three tested bacteria. The early logarithmic growth phase of these bacteria illustrated the bactericidal effect of optimized extracted BL with a logarithmic growth phase inferior to 6 h. Therefore, BL extract at 4 × MIC, which corresponds to 1.608, 1.988, and 0.828 mg/mL, was more efficient against S. aureus, S. enterica, and E. coli.
Keywords: Beetroot leaves, Mixture design, Phytochemical contents, Antioxidant and antibacterial activities, Foodborne bacterial pathogen inactivation, Chemometric approaches
Introduction
The disastrous effects of the COVID-19 pandemic conjointly with additional challenges in health, nutrition, and demography incite researchers and expert practitioners to investigate sustainable and preventive remedies. For instance, medicinal plants and derived products, with eminent bioactive compounds and biological potential [1–3], have been recommended to strengthen the immune system during the COVID-19 pandemic [4, 5].
Among these medicinal plant-derived natural products, beetroot (Beta vulgaris L.) has been announced for numerous bioactivities. For instance, this plant has long been used in traditional medicine to treat a wide variety of diseases [6, 7]. The claimed therapeutic use of beetroot includes antianxiety, anti-inflammatory, antihypertensive, anticancer, antiobesity, neuroprotective, cardioprotective, and antioxidant effects [7–10].
In contrast to the considerable amount of research conducted on beetroot extract and juice, there are comparatively few studies on other beetroot by-products, such as leaves, which are discarded as waste during food processing. Nevertheless, the literature displayed that this unexploited biomass has been reviewed as a good source of bioactive compounds including proteins [11], minerals [12], and multiple phytochemicals [13] with biomedical applications [14–16]. Among beetroot leaf (BL) phytochemicals, the flavonoid glycosides acquired from apigenin, termed vitexin (such as vitexin-2-O-rhamnoside and vitexin-2-O-xyloside), which is analyzed with liquid chromatography-mass spectrometry [17], could be reliable for the inhibition of α-glucosidase activity and therefore arbitrate this hypoglycemic effect [18]. Lorizola et al. [18] confirmed that BL rich in vitexin derivatives can protect the liver from damage induced by a high-fat diet [19]. Likewise, β-aldehydes and phenolic compounds found in beetroot have been connected to enhance low-density lipoprotein (LDL) resistance to oxidation [18]. These compounds present a preventive capacity against cardiovascular diseases by lowering the oxidative effects of free radicals on lipids [10, 20] and decreasing the ratio between LDL cholesterol (LDL-C) and serum cholesterol (TC) levels [20, 21]. There are certain papers on the compositions of BL [18–20], but none of them have revealed the simultaneous exploration of the bioactive compounds of leaves’ phenolic constituents, antioxidants, and biological activities against foodborne bacterial pathogens, such as Staphylococcus aureus, Salmonella enterica, and Escherichia coli. When these pathogens come into contact with food, they cause infections and food poisoning, which is a major public health concern [22–24].
On the other hand, considering the recovery of bioactive compounds’ polarity may notably vary with numerous conditions [25], it is complicated to evolve a perfect method for the extraction of all phenolic compounds, and extraction systems can engender inefficient results. In this way, variables like solvent type, solvent-sample ratio, solvent–solvent ratio, extraction time, temperature, and pH can control the efficiency of extraction of total phenolic compounds and consequently the antioxidant/antimicrobial activities [26, 27]. In this respect, the blend of solvents, which can vary from binary, ternary, and even multicomponent mixtures at different polarities, has been recommended for the effective extraction of phytochemicals [28, 29]. Thereby, a hypothesis is that solvent mixtures produce efficient extraction of phenolic compounds. Statistical methods such as the mixture design have been widely used to investigate the effects of process variables on specific responses in studies in food technology and science [28]. This method can evaluate the interaction effect of multiple factors in different ranges employing a three-dimensional graph. In addition, this approach’s results allow identifying the synergetic effects of mixtures and predicting models that provide answers such as high phenolic recovery with maximal biological activities [29, 30]. The advantage is that multiple parameters can be calculated over the duration with fewer experiments and provide quantitative results [31]. Smaoui et al. [30] used an augmented simplex-centroid mixture design to examine the synergistic effect of solvents (acetone, ethanol, and water) at different polarities on the simultaneous production of phytochemical contents and antibacterial activity of Phoenix dactylifera L. (date) seeds. El Ksibi et al. [29] determined the best mixture of solvents (water, ethanol, and acetone) to optimize the recovery of colored phenolics from red pepper (Capsicum annum L.) by-products as a potential source of natural dye and assessment of its antimicrobial activity. These studies provide a reference for here to choose the mixing design model and predict the proportion of multicomponent mixed solvents.
The present paper aims to identify the most adequate mixture for the extraction of phenolic content from Tunisian BL in such a way as to produce the dry extract with high antioxidant and antibacterial activities. In addition, findings from this study provide an understanding of optimized extract’s efficacy versus common foodborne pathogenic microorganisms: Staphylococcus aureus, Salmonella enterica, and E. coli.
Materials and methods
Beetroot leaf extract preparation
Beetroot leaves (BL) were purchased from a local market based in Sfax, Tunisia. Leaves were washed with distilled water, dried at about 40 °C until it attains constant weight, and ground in a laboratory heavy-duty grinder (IKA, Germany) [32]. Finally, BL were stored at 4 °C in the dark until used for analysis.
By maceration with a constant stirring rate (150 rpm for 2 h), BL extracts were obtained in a proportion sample/solvent of 1/30 at 45 °C. Later, each mixture was centrifuged at 10.000 × g for 10 min [33]. The obtained supernatant was concentrated in a rotary evaporator for further evaluation of phytochemical content and antioxidant and antibacterial activity.
Phytochemical study of BL extracts
Total phenolic content quantification (TPC)
TPC of BL extract was evaluated using the reagent of Folin–Ciocalteu according to the method of López-Froilán et al. [34]. Briefly, 100 μL of the Folin–Ciocalteu (0.2 N) reagent was mixed with 100 μL of BL extract. Subsequently, 400 μL of Na2CO3 (7% (w/v)) and 250 μL of distilled water were added. All the mixtures were preceded to incubation at room temperature for 90 min. Gallic acid (GA) was used as standard (0–200 μg/L), and the absorbance was measured at 750 nm. TPCs were determined in mg GA equivalents/g (mg GAE/g).
Total phenolic content quantification (TFC)
TFC was assessed using the aluminum chloride (AlCl3) colorimetric assay described by Saharan et al. [35]. 500 μL of 2% AlCl3 was added to 500 μL of BL extract and incubated at room temperature for 1 h. Then, the absorbance was read at 420 nm. Quercetin was used as standard (0–50 μg/mL). TFCs were determined in milligrams of quercetin equivalents mg QE/mL.
Antibacterial activity: determination of minimum inhibitory concentration (MIC)
The target bacterial strains including Gram-positive bacteria Staphylococcus aureus ATCC 6538 and two Gram-negative bacteria Salmonella enterica ATCC 14,028 and Escherichia coli ATCC 25,922 were selected for the antibacterial activity assays according to the method proposed by Fourati et al. [36]. MIC values are the lowest concentration of BL, which could be detected when the microorganisms do not manifest any visible growth after incubation. MIC test was performed in sterile 96-well microplates with a final volume of 100 μL per well [37]. The corresponding extract of BL was transferred to each successive well in a view to perform a two-fold serial dilution from the original sample. Then, 10 μL of the cell suspension was added to each test well with a final inoculum concentration of 106 CFU/mL of each bacterium. Plates were incubated at 37 °C for 24 h. Later, 25 μL of MTT (3-(4,5-dimethylthiazol-2-yl)-2,5-diphenyltetrazolium bromide) solution (0.5 mg/mL) was added to the wells as an indicator of microorganism growth and the plate was incubated again at 37 °C for 30 min.
DPPH assay
The DPPH (2-diphenyl-1-picrylhydrazyl) antioxidant activity of the BL extracts was determined according to Xu et al. [27]. Briefly, 1 mL aliquots of each sample were added to 1 mL of DPPH solution. After 30 min in the dark, the absorbance was measured at 517 nm. The concentration that provides 50% of the action of scavenging radicals (IC50), expressed in mg/mL, was determined from the plot of serial dilutions vs. present inhibition.
Mixture design
The simplex-centroid design was performed to obtain the optimum composition between solvents for maximum phytochemical content and antioxidant and antibacterial activities [38]. The factors represent the fraction of each solvent in the mixture, which ranges from 0 to 1. As a result, the experiment’s number for this design was equal to ten with various water, ethanol, and acetonitrile mixtures. The mixture representation is as follows: three pure products corresponding to X1: water, X2: ethanol, X3: acetonitrile, mixtures of two pure solvents (1/2:1/2): corresponding to midpoints (4, 5, 6), central point (1/3:1/3:1/3) (7), and three augmented points (8, 9, 10) ascribed to ternary combinations.
Linear, quadratic, and special cubic regression models were used for variations of all the effects of the interactions between the proportions within the same response. The following equation represents these models:
is the predicted response, while , , and correspond to the regression coefficients for linear, binary, and ternary interaction effect terms, respectively. , , and are the variables and is the random error. Minitab 16 software was employed for experimental design and data analysis.
Mode of action of BL extract
The effect of BL extract on S. aureus, S. enterica, and E. coli inhibition was determined in Luria Broth (LB) medium. The bacteria’s growth initially reached the start of the exponential phase (∼104 CFU/mL). Different concentrations of BL extract, obtained under optimized conditions, at 1 × MIC, 2 × MIC, and 4 × MIC, were added individually on an LB medium with S. aureus (0.402, 0.804, and 1.608 mg/mL), S. enterica (0.497, 0.994, and 1.988 mg/mL), and E. coli (0.207, 0.414, and 0.828 mg/mL), respectively, and incubated for 26 h at 37 °C. The number of CFU/mL was measured by plating the samples on LB medium at various times throughout the incubation duration. Samples were compared with the growth of the control sample (without BL extract), which were made under the same experimental circumstances. The assay was carried out in triplicate, and the means were expressed as log10 CFU/mL.
Statistical analysis
Two chemometric techniques consisting of principal component analysis (PCA) and hierarchical cluster analysis (HCA) were carried out. These techniques were conducted to identify the possible links between phytochemical contents (TPC and TFC) of different extract mixtures and their corresponding biological activities (antioxidant and antibacterial activities). The Ward technique and the squared Euclidean distance matrix were performed to define each cluster, resulting in a dendrogram. These approaches were achieved using XLSTAT software for Windows (v.2014.1.08, Addinsoft, New York, USA). The PCA type was Pearson (), the plot type was correlation biplot, and the coefficient was automatic. HCA methodology was also applied to evaluate the relationships between trials/responses.
On the other hand, all tests were assayed in triplicate and expressed as the mean ± standard deviation of the measurements. The statistical program Statistical Package for the Social Sciences (SPSS) version 21.00 for Windows (SPSS Inc., Chicago, IL, USA) was utilized to analyze data. The variance was analyzed by one-way analysis of variance (ANOVA), and Tukey test was applied to compare each parameter at p < 0.05.
Results and discussion
Measured and predicted responses: TPC, TFC, and MICs of the tested bacteria (S. aureus, S. enterica, and E. coli) and DPPH (IC50) values are shown in Table 1. As a function of solvent characteristics using ANOVA of regression models (Tables 2, 3, and 4), the corresponding responses were traced in Figs. 1, 2, and 3. The resulted contour plots are composed of vertices, which reflect the response value, and the triangle edges represent the concentration, which depicts the individual components in their binary mixing. Gathered data from the trials were utilized to analyze the coefficients using regression analysis. The adequacy and fitness of the models were investigated using ANOVA, and p values were utilized to determine the significance of the coefficients. In addition, the coefficient of determination (R2) was used to assess the efficacy of models in approaching the desired output of each response. In fact, R2 values of 84.17, 70.20, 89.16, 71.11, 79.54, and 74.34% were obtained for TPC, TFC, MIC S. aureus, MIC S. enterica, MIC E. coli, and DPPH respectively, indicating that these fitted models properly present the variability of all the response. Additionally, it enables checking the quality of fit between predicted and experimental findings. It is a typical criterion for evaluating statistical performance [30].
Table 1.
Experimental variables and responses used in the mixture design
| Variables | TPC (mg GAE/mL) | TFC (mg QE/mL) | MIC S. aureus (mg/mL) | MIC S. enterica (mg/mL) | MIC E. coli (mg/mL) | DPPH (IC 50) (mg/mL) | |||||||||
|---|---|---|---|---|---|---|---|---|---|---|---|---|---|---|---|
| Runs | Water X1 |
Ethanol X2 |
Acetonitrile X3 |
Exp | Pred | Exp | Pred | Exp | Pred | Exp | Pred | Exp | Pred | Exp | Pred |
| 1 | 1.000 | 0.000 | 0.000 | 44.915 | b | 0.244 | c | 2.352 | c | 1.150 | c | 0.586 | d | 1.134 | |
| 2 | 0.000 | 1.000 | 0.000 | a | 41.242 | d | 0.275 | a | 0.704 | a | 0.430 | b | 0.303 | b | 0.482 |
| 3 | 0.000 | 0.000 | 1.000 | a | 41.580 | d | 0.287 | a | 0.648 | b | 0.580 | b | 0.317 | e | 1.424 |
| 4 | 0.500 | 0.500 | 0.000 | b | 43.460 | b | 0.290 | a | 0.556 | b | 0.743 | b | 0.266 | bc | 0.601 |
| 5 | 0.500 | 0.000 | 0.500 | c | 50.055 | b | 0.240 | b | 1.125 | c | 1.108 | a | 0.126 | bc | 0.343 |
| 6 | 0.000 | 0.500 | 0.500 | a | 39.500 | c | 0.235 | a | 0.727 | b | 0.798 | a | 0.156 | d | 1.106 |
| 7 | 0.333 | 0.333 | 0.333 | c | 48.012 | b | 0.274 | a | 0.830 | a | 0.533 | b | 0.200 | c | 0.434 |
| 8 | 0.6667 | 0.1667 | 0.1667 | c | 48.197 | e | 0.265 | a | 0.780 | b | 0.747 | a | 0.298 | a | 0.513 |
| 9 | 0.1667 | 0.6667 | 0.1667 | a | 44.265 | a | 0.274 | a | 0.604 | c | 1.037 | a | 0.214 | bc | 0.550 |
| 10 | 0.1667 | 0.1667 | 0.6667 | c | 45.880 | c | 0.261 | a | 0.775 | b | 0.675 | a | 0.172 | b | 0.778 |
For each run, responses with different letters are significantly different (one-way analysis of variance, p < 0.05; Tukey’s test), ± standard deviation (SD) of three measurements
Exp experimental, Pred predicted
Table 2.
ANOVA results of regression models from mixture design for solvent optimization of TPC
| Source | DF | Seq SS | Adj SS | Adj MS | value | value |
|---|---|---|---|---|---|---|
| Regression | 6 | 105.975 | 105.9746 | 17.6624 | 4.66 | 0.031 |
| Linear | 2 | 42.896 | 9.0649 | 4.5325 | 2.68 | 0.042 |
| Quadratic | 3 | 55.646 | 38.2037 | 12.734 | 2.92 | 0.046 |
| X1 × X2 | 1 | 1.458 | 0.0010 | 0.0010 | 2.00 | 0.041 |
| X1 × X3 | 1 | 53.935 | 31.3152 | 31.3152 | 8.71 | 0.048 |
| X2 × X3 | 1 | 0.253 | 2.4616 | 2.4616 | 2.37 | 0.050 |
| Special cubic | 1 | 7.432 | 7.4322 | 7.4322 | 3.12 | 0.074 |
| X1 × X2 × X3 | 1 | 7.432 | 7.4322 | 7.4322 | 3.12 | 0.074 |
| Residual error | 3 | 19.934 | 19.9340 | 6.6447 | ||
| Total | 9 | 125.909 | ||||
Table 3.
ANOVA results of regression models from mixture design for solvent optimization of TFC
| Source | DF | Seq SS | Adj SS | Adj MS | value | value |
|---|---|---|---|---|---|---|
| Regression | 6 | 0.0030 | 0.0030 | 0.0005 | 2.19 | 0.042 |
| Linear | 2 | 0.0009 | 0.0011 | 0.0005 | 2.21 | 0.031 |
| Quadratic | 3 | 0.0016 | 0.0019 | 0.0006 | 2.24 | 0.028 |
| X1 × X2 | 1 | 0.0003 | 0.0006 | 0.0006 | 2.23 | 0.024 |
| X1 × X3 | 1 | 0.0002 | 0.0004 | 0.0004 | 2.17 | 0.042 |
| X2 × X3 | 1 | 0.0011 | 0.0015 | 0.0015 | 2.55 | 0.056 |
| Special cubic | 1 | 0.0004 | 0.0004 | 0.0004 | 2.15 | 0.063 |
| X1 × X2 × X3 | 1 | 0.0004 | 0.0004 | 0.0004 | 2.15 | 0.063 |
| Residual error | 3 | 0.0080 | 0.0080 | 0.0027 | ||
| Total | 9 | 0.0110 | ||||
Table 4.
ANOVA results of regression models from mixture design for solvent optimization of DPPH
| Source | DF | Seq SS | Adj SS | Adj MS | value | value |
|---|---|---|---|---|---|---|
| Regression | 6 | 1.182 | 1.182 | 0.197 | 2.45 | 0.010 |
| Linear | 2 | 0.305 | 0.511 | 0.256 | 2.88 | 0.039 |
| Quadratic | 3 | 0.863 | 0.666 | 0.222 | 3.63 | 0.079 |
| X1 × X2 | 1 | 0.054 | 0.028 | 0.028 | 2.21 | 0.056 |
| X1 × X3 | 1 | 0.801 | 0.592 | 0.592 | 4.35 | 0.068 |
| X2 × X3 | 1 | 0.007 | 0.015 | 0.015 | 1.12 | 0.066 |
| Special cubic | 1 | 0.013 | 0.013 | 0.013 | 2.10 | 0.042 |
| X1 × X2 × X3 | 1 | 0.013 | 0.013 | 0.013 | 2.10 | 0.042 |
| Residual error | 3 | 0.410 | 0.408 | 0.136 | ||
| Total | 9 | 1.590 | ||||
Fig. 1.

2D contour plot for the effect of different mixtures of BL extract on a TPC (mg GAE/mL) and b TFC (mg QE/mL)
Fig. 2.

2D contour plot for the effect of different mixtures of BL extract on DPPH (expressed by IC50 (mg/mL))
Fig. 3.
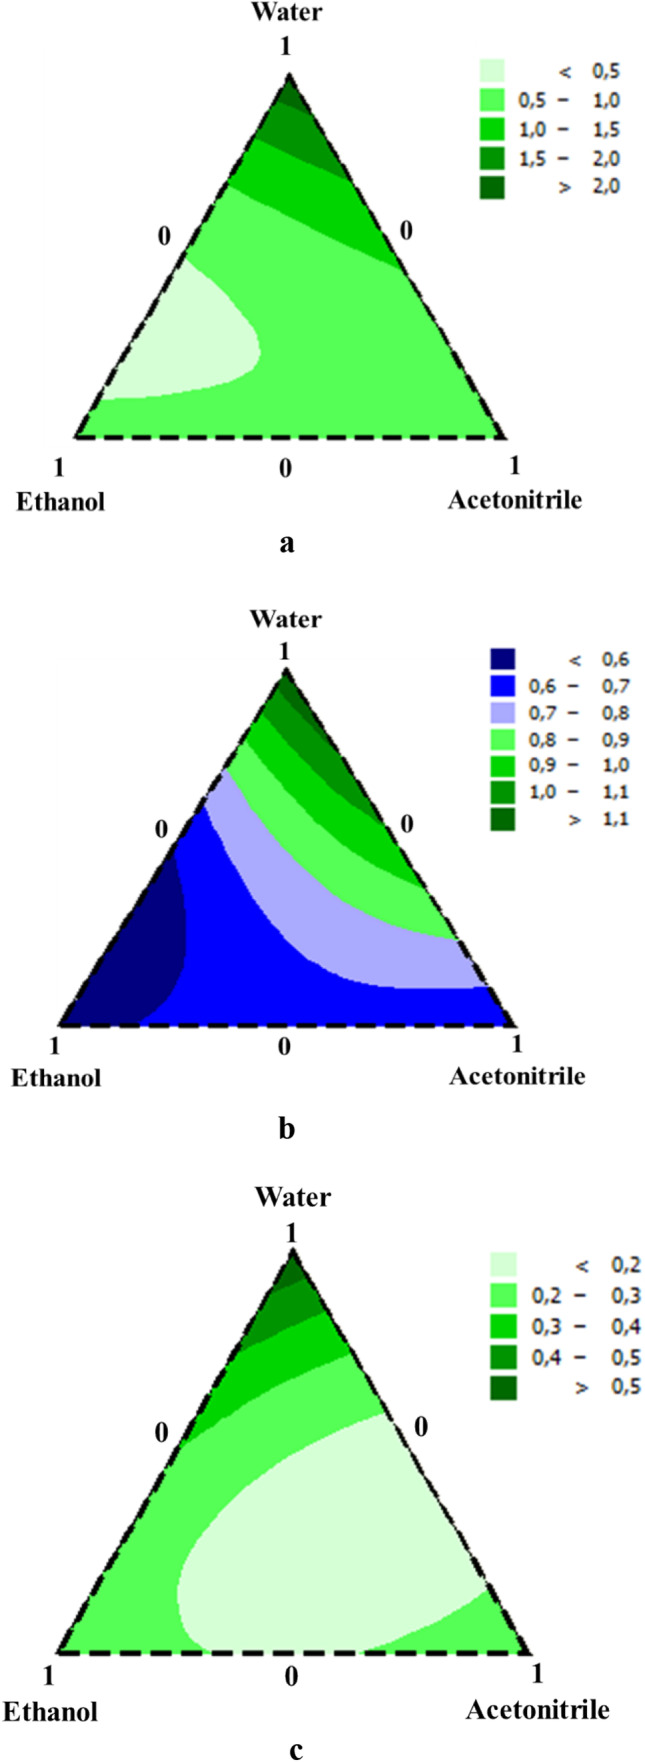
2D contour plot for the effect of different mixtures of BL extract on a S. aureus, b S. enterica, and c E. coli (expressed by MIC (mg/mL))
The effect of the system solvents on TPC
The most efficient mixture for TPC extraction was acetonitrile diluted in water at 50% (49.40 ± 2.47 mg GAE/mL), as mentioned in Table 1. Biondo et al. [19] detected a TPC of 15 mg/mL in BL methanolic extract which is a lower value compared to those found in this study. However, using just water or acetonitrile led to a TPC equal to 44.84 mg GAE/mL and 41.00 mg GAE/mL, respectively. According to [39], the TP content of Beta vulgaris extract using only water was equal to 27.72 mg GAE/mL. In fact, the binary combination exhibits a more effective interaction than when a solvent is separated, indicating that both solvents work in synergy. In this case, the solvent combination may raise polarity and expand plant components by allowing the solvent to easily penetrate the solid matrix [40]. This agrees with the study of Ameer et al.[41], who elucidate that the addition of water to organic solvents increases the solubility of polyphenols by modulating the polarity of the organic solvent and this increase may be due to the weakening of hydrogen bonds in aqueous solutions [30, 41]. It could also be due to the increase of basicity and ionization of polyphenols in these solvents. Additionally, the extractability of bioactive chemicals from plant materials could also be affected by solvent viscosity [42]. For instance, the low solvent viscosity of acetonitrile and water allows better diffusion into the pores of plant matrices and subsequently enhances the extraction of the compounds [43]. As a result, the polarity and viscosity of the solvents utilized influence polyphenol extractability. For TPC, p values of linear (p = 0.042) and quadratic (p = 0.046) were significant (Table 2). The generalized polynomial equation (Eq. 1) considered is as follows:
| 1 |
The contour plots enable us to confirm the interaction influence between the mixtures. The dark green regions in all response surface plots denote the places where the maximum was identified (Fig. 1). Indeed, the binary mixture of water and acetonitrile at 55.56 and 44.44% extracted the highest level of TPC, as depicted in Fig. 1a. This agrees with the study of Alcântara et al. [28] who confirm the necessity of the use of various solvents to optimally extract all the polyphenols from plants. Likewise, the chemical complexity of the investigated plant, as well as the type and the polarity of the solvent utilized for extraction, may have considerable effects on the extraction of the phenolics.
The effect of the system solvents on TFC
The results of the TFC extracted from BL ranged from 0.213 ± 0.011 to 0.310 ± 0.016 mg QE/mL. The highest flavonoid content (0.310 mg QE/mL) was obtained at 66.667, 16.667, and 16.667% of water, ethanol, and acetonitrile, respectively. In fact, flavonoid glycosides are more soluble in water, a solvent proton donor, so they must be used with polar solvents [44]. For TFC, p values of linear and quadratic (X1 × X2 and X1 × X3) were significant (p < 0.05) (Table 3). The mathematical model for representing the response is expressed as follows:
| 2 |
Figure 1b reveals that the ternary mixture (water–ethanol-acetonitrile) allows for high flavonoid extraction. The extraction efficiency of TFC in the extracts decreased as the water content in the ethanol decreased; this was in agreement with Vural et al. [45] study. Hence, the solubility of flavonoids in hydrophilic solvent systems is due to the presence of hydroxyl groups and glycosylic moieties in their molecular structure [46]. Therefore, the polarity of the solvents and the solubility of each chemical in the solvent employed for the extraction procedure might have different effects on flavonoids [47]. As a result, the extraction solvent had a significant impact on the obtained concentration of flavonoids present.
The effect of the system solvents on the antioxidant activity
Oxidative stress has been detected as a principal cause of the development of various diseases [38]. As a result, finding new effective antioxidant agents is critical. In the present investigation, the antioxidant activity of the different mixture BL extracts was determined using the DPPH assay. The BL extract has revealed an antioxidant activity ranging between 1.5 ± 0.075 and 0.135 ± 0.007 mg/mL. High antioxidant activity with an IC50 of 0.135 mg/mL was envisaged by a combination of 16.667, 66.667, and 16.667% of water, ethanol, and acetonitrile, respectively (Table 1). Antioxidant activity was correlated with the presence of bioactive substances. These chemicals, which dissolve differentially due to varying polarity of the employed solvents, might explain the variance in DPPH scavenging activities seen in the BL extract [48]. Among these compounds, the phenolic group is the most abundant and extensively distributed found in plants, and they are extremely powerful antioxidants [43]. Thus, due to its high antioxidant content, Silva et al. [15] highlighted the potential use of BL as a functional food for the adjuvant treatment of dyslipidemias.
The polynomial equation (Eq. 3) executed for the antioxidant activity is as follows with p values of linear and quadratic < 0.05 (Table 4).
| 3 |
As indicated in Fig. 2, a binary mixture of water (53.54%) and acetonitrile (46.46%) contributed to the highest antioxidant activity. These findings corroborate a previous study, which found that acetonitrile and water extracts of Kandelia candel bark provide the highest activity [49]. In fact, antioxidants such as phytochemicals neutralize free oxygen radicals and preserve the genetic material of cells from harm [50]. Consequently, it may effectively treat diseases caused by oxidative stress.
The antioxidant activity of beet extracts has been reported in several studies [51–53]. However, the level of antioxidant activity and polyphenol content fluctuates. The variation in the reported data could be attributed to various variables, including postharvest nutritional quality losses increased by physical damage, longer storage times, high temperatures, and low relative humidity.
The effect of the system solvents on the antibacterial activity
The microdilution method was employed to find the MIC and the lowest concentration of an antibacterial agent required to inhibit a bacterium. The MICs of the chosen bacteria are represented in Table 1. These findings reveal variability in the sensitivity of the bacteria to the different mixtures. Indeed, Gram-negative bacteria, E. coli and S. enterica, have a low MIC of 0.312 ± 0.016 and 0.156 ± 0.008 mg/mL, respectively, with all the binary and the ternary mixtures. Ethanolic beetroot extract exhibits a MIC of E. coli equal to 1.5 mg/mL [54]. On the other hand, the BL extract showed a MIC equal to 0.625 mg/mL against S. aureus. These findings were better than those investigated by Čanadanović-Brunet et al. [54]. These authors used ethanol as an extraction solvent and reported a concentration of 0.750 mg/mL to inhibit S. aureus. For antibacterial activities, p values of linear and cubic were significant (p < 0.05), and the resulting regression models (Table 5) are shown in the following equations:
| 4 |
| 5 |
| 6 |
Table 5.
ANOVA results of regression models from mixture design for solvent optimization of MICs of S. aureus, S. enterica, and E. coli
| Source | DF | Seq SS | Adj SS | Adj MS | value | value |
|---|---|---|---|---|---|---|
| S. aureus | ||||||
| Regression | 6 | 2.925 | 2.9256 | 0.581 | 8.11 | 0.047 |
| Linear | 2 | 1.866 | 2.062 | 1.031 | 16.70 | 0.016 |
| Quadratic | 3 | 1.038 | 0.0712 | 0.346 | 4.00 | 0.071 |
| X1 × X2 | 1 | 0.876 | 0.638 | 0.881 | 10.38 | 0.053 |
| X1 × X3 | 1 | 0.16147 | 0.095 | 0.161 | 2.80 | 0.066 |
| X2 × X3 | 1 | 0.00034 | 0.00176 | 0.00034 | 2.01 | 0.051 |
| Special cubic | 1 | 0.02085 | 0.02085 | 0.02085 | 4.18 | 0.043 |
| X1 × X2 × X3 | 1 | 0.02085 | 0.02085 | 0.02085 | 4.18 | 0.043 |
| Residual error | 3 | 0.35564 | 0.35564 | 0.11855 | ||
| Total | 9 | 3.281 | ||||
| S. enterica | ||||||
| Regression | 6 | 0.479 | 0.479 | 0.08 | 2.33 | 0.042 |
| Linear | 2 | 0.304 | 0.263 | 0.131 | 2.54 | 0.031 |
| Quadratic | 3 | 0.066 | 0.088 | 0.030 | 2.12 | 0.072 |
| X1 × X2 | 1 | 0.056 | 0.006 | 0.006 | 4.03 | 0.058 |
| X1 × X3 | 1 | 0.005 | 0.039 | 0.039 | 4.16 | 0.061 |
| X2 × X3 | 1 | 0.005 | 0.039 | 0.039 | 5.16 | 0.084 |
| Special cubic | 1 | 0.109 | 0.109 | 0.109 | 6.45 | 0.042 |
| X1 × X2 × X3 | 1 | 0.109 | 0.109 | 0.109 | 6.45 | 0.042 |
| Residual error | 3 | 0.732 | 0.732 | 0.244 | ||
| Total | 9 | 1.212 | ||||
| E. coli | ||||||
| Regression | 6 | 0.156 | 0.156 | 0.026 | 2.94 | 0.013 |
| Linear | 2 | 0.057 | 0.057 | 0.028 | 4.13 | 0.045 |
| Quadratic | 3 | 0.093 | 0.087 | 0.029 | 4.16 | 0.079 |
| X1 × X2 | 1 | 0.015 | 0.021 | 0.021 | 3.61 | 0.055 |
| X1 × X3 | 1 | 0.066 | 0.071 | 0.072 | 12.34 | 0.078 |
| X2 × X3 | 1 | 0.011 | 0.016 | 0.016 | 2.20 | 0.094 |
| Special cubic | 1 | 0.006 | 0.006 | 0.006 | 2.44 | 0.035 |
| X1 × X2 × X3 | 1 | 0.006 | 0.006 | 0.006 | 2.44 | 0.035 |
| Residual error | 3 | 0.040 | 0.04 | 0.013 | ||
| Total | 9 | 0.197 | ||||
As mentioned in the contour plot (Fig. 3a, b), the binary combination mixture (water–ethanol) yielded the best results of MIC of S. aureus and S. enterica. Meanwhile, the ternary mixture extracts of BL were more efficient against E. coli than the mono and binary mixture (Fig. 3c). Beta vulgaris extracts were shown to have antiquorum sensing and antibiofilm (E. coli) activities [55]. Therefore, BL extract’s antibacterial action might be attributed to the presence of a high concentration of phytochemical contents, which have been shown in earlier studies to have effective antimicrobial properties. Flavonoids, such as vitexin, were investigated to modulate cell surface hydrophobicity in order to combat S. aureus biofilm [56]. Additionally, polyphenols like galloyl catechins can intercalate in membranes and generate significant biophysical alterations [57]. These alterations can inhibit biofilm formation and limit the dissemination of the biosynthetic machinery of the cell wall, which is linked to beta-lactam antibiotic resistance. Indeed, if natural bioactives can inhibit pathogenic bacteria from communicating and proliferating, they can also inhibit them from being virulent and resistant. As a result, this vegetable is suggested as a bioactive alternative to standard antibacterial and antipathogenic agents.
Mixture optimization
To find the most suitable response, a numerical optimization approach of the different mixtures was used. Optimum levels of solvents were obtained to maximize all the responses. This method looks for a set of factor values that fits the design’s requirements with each response at the same time. The optimal mixture for all the responses is the ternary mixture with different percentages. For TPC and TFC, the % of solvents were 38.74, 20.86, and 40.40% for water, ethanol, and acetonitrile, respectively (Fig. 4a). For the antibacterial activities, the % of solvents were 25.25, 50.17, and 24.58% of water, ethanol, and acetonitrile, respectively, with an overall desirability value of 0.780 (Fig. 4b). For the antioxidant activity, the percentages of solvents were 53.53, 1.02, and 45.45% of water, ethanol, and acetonitrile, respectively, with an overall desirability value of 0.831 (Fig. 4c). Accordingly, the predicted models with optimum values of TPC, TFC, MIC S. aureus, MIC S. enterica, MIC E. coli, and antioxidant (IC50) activities were 49.287 mg GAE/mL, 0.314 mg QE/mL, 0.402 mg/mL, 0.497 mg/mL, 0.207 mg/mL, and 0.337 mg/mL, respectively (Fig. 4a–c).
Fig. 4.
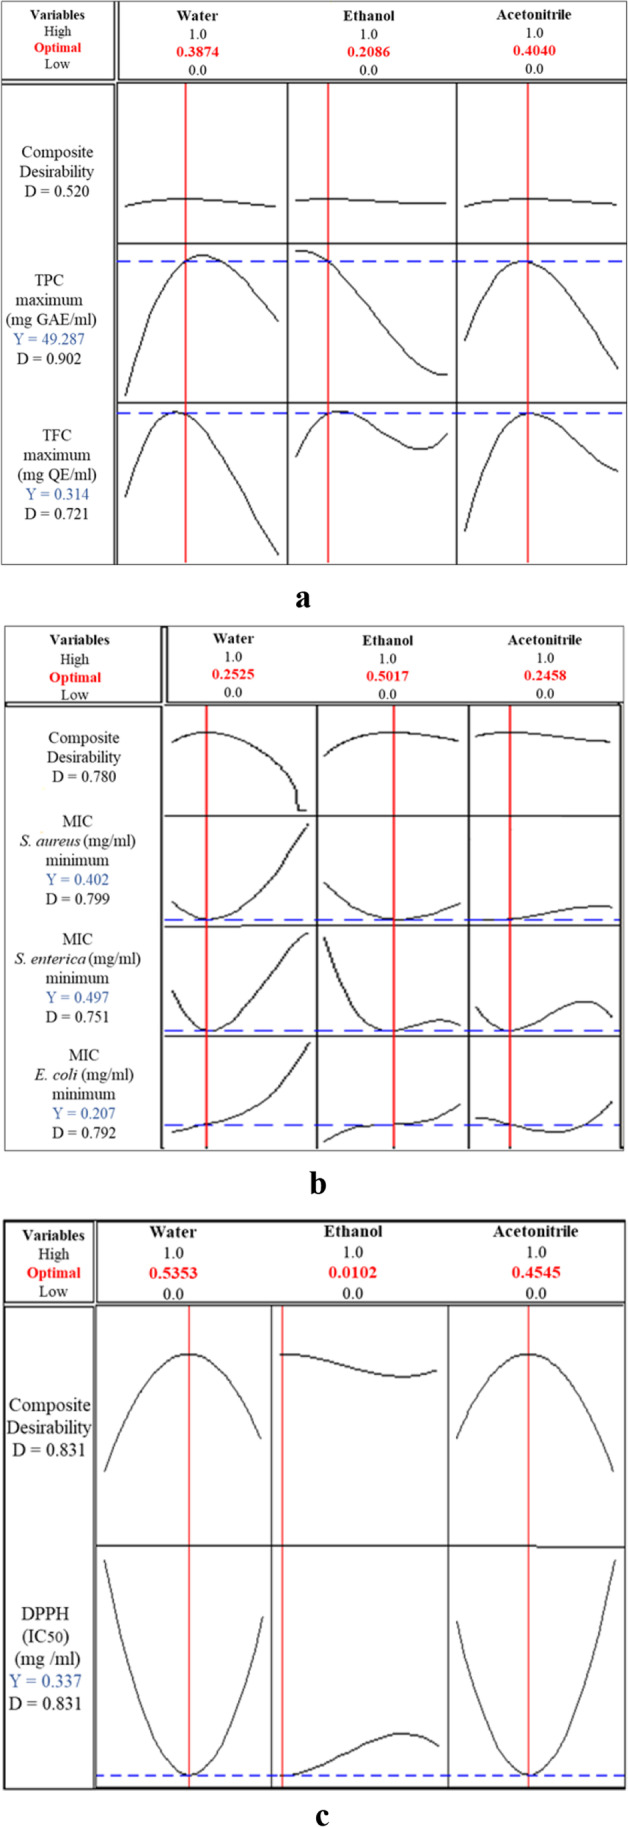
Response optimizer at the optimum conditions for the maximum response of the tested a phytochemical contents, b MICs of S. aureus, S. enterica, and E. coli, and c the antioxidant (DPPH) activity
Chemometric analysis
With the purpose of revealing hidden patterns and similarities between the different samples of BL extract mixtures, phytochemical contents and their bioactivities were investigated. The dataset obtained was studied using chemometric analysis, which included PCA and HCA.
PCA generates score plots of the distribution of the different samples following the major components. In this study, the obtained score plots (Fig. 5a, b) presented the differences between the sample mixtures, phytochemical contents, and their bioactivities. The major principal component is , which contributed to 42.63% of the total variances. In fact, has the maximum eigenvalue of 2.56, while , , , , and have eigenvalues of 1.5, 1.07, 0.52, 0.30, and 0.04, and elucidate 24.88, 17.94, 8.74, 5.10, and 0.71% of the variance in the data, respectively. Consequently and based on the loading plot of PCA, and , which contributed to 67.51% of the total variances, were utilized to supply a relevant visual guide for mentioning data differences (Fig. 5a, b). Indeed, the axis is associated with the majority of variables (TFC, MIC of S. aureus, MIC of S. enterica, and MIC of E. coli) with high values, whereas the axis is linked to TPC and DPPH.
Fig. 5.

Principal component analysis (PCA) plots of a phytochemical contents (TPC and TFC), biological (antioxidant and antibacterial) activities, and b all samples (1–10) extracted with different solvent mixtures
In fact, the score plot depicts a clear difference between the 10 samples (Fig. 5b). Overall, the first sample was associated with MIC of S. aureus, S. enterica, and E. coli, while samples 2 and 8 were correlated with TFC. Additionally, samples 5 and 9 were correlated with the TPC (Fig. 5a, b). In addition, the loading plot showed that the variables, which contributed positively to , are DPPH, MIC of S. aureus, MIC of S. enterica, and MIC E. coli while TPC and TFC contributed negatively to the same axis. On the other hand, was positively correlated with TFC, DPPH, and MIC of E. coli and negatively correlated with MIC of S. aureus, MIC of S. enterica, and TPC. The results revealed that BL extracts with high antioxidant activity could have a better antibacterial activity and the MIC values of the chosen bacteria were related to the aqueous extract of beetroot. According to a previous report, phenolic compounds have been demonstrated to present better antibacterial activity [58].
The result acquired by PCA plots was corroborated by developing a hierarchical cluster analysis (HCA). HCA is a clustering technique that investigates the way of sample organization. Furthermore, by illustrating hierarchy, it enables the identification of similarities and differences within and across groups [59]. This method was exhibited using the matrix of squared Euclidean distances to get further information about a probable classification of the sample mixtures according to their contents and activities. The findings of HCA have usually illustrated in a dendrogram a plot that displays the arrangement of samples and their relationships in a tree shape. Indeed, the generated dendrogram (Fig. 6) indicated the presence of five clusters (1, (5–9), (3–6), (7–4-10), and (2–8)), which agree with PCA. In investigations involving bioactive chemicals and functional characteristics, PCA and HCA are frequently utilized together [60–62]. For instance, Sicak et al. [63] used PCA to determine the connections between the chemical components and the biological activities (antioxidant, antiproliferative, and enzyme inhibition) of pine and thyme honey extracts.
Fig. 6.
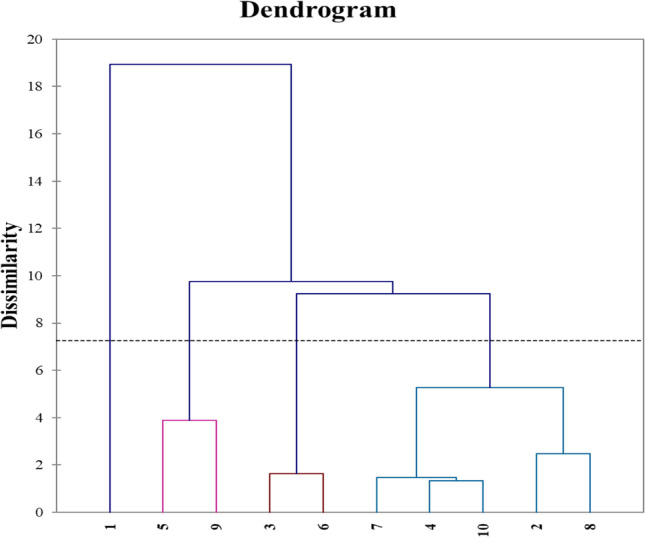
HCA dendrogram showing clustering of BL extracts of all samples (1–10) extracted with three different solvents
Mode of action of BL extract
Using a linear model (ANOVA), the effect of the concentrations of BL extract on the growth of S. aureus (0.402, 0.804, and 1.608 mg/mL), S. enterica (0.497, 0.994, and 1.988 mg/mL), and E. coli (0.207, 0.414, and 0.828 mg/mL) was assessed. To investigate this effect, the bacterial growth was measured for 26 h and compared to the control culture. A notable decrease trend in the viable cells was detected, after 6 h, when the different concentrations of BL extracts (1 × MIC, 2 × MIC, and 4 × MIC) were applied, as depicted in Fig. 7a–c. For 1 × MIC and 2 × MIC, a significant (p < 0.05) decrease in the tested bacteria’s growth appeared after 8 h compared to the control. At the same time, BL extract at 1.608 and 0.828 mg/mL (4 × MIC) showed a significant (p < 0.05) decrease in cell numbers of S. aureus (2.7 log 10 CFU/mL) and E. coli (2.8 log 10 CFU/mL), respectively (Fig. 7a–c). Meanwhile, a highly significant (p < 0.05) inhibition of S. enterica (2.05 log 10 CFU/mL) was displayed by 1.988 mg/mL (4 × MIC) of BL extract after 20 h incubation (Fig. 7b). Thus, BL extract exhibited a remarkable antimicrobial dose-dependent effect against the tested bacteria. Our results were in good agreement with Lee et al. [64], who found that passion fruit peel extract (PPE) could effectively reduce the growth of E. coli and L. monocytogenes within 3 h.
Fig. 7.
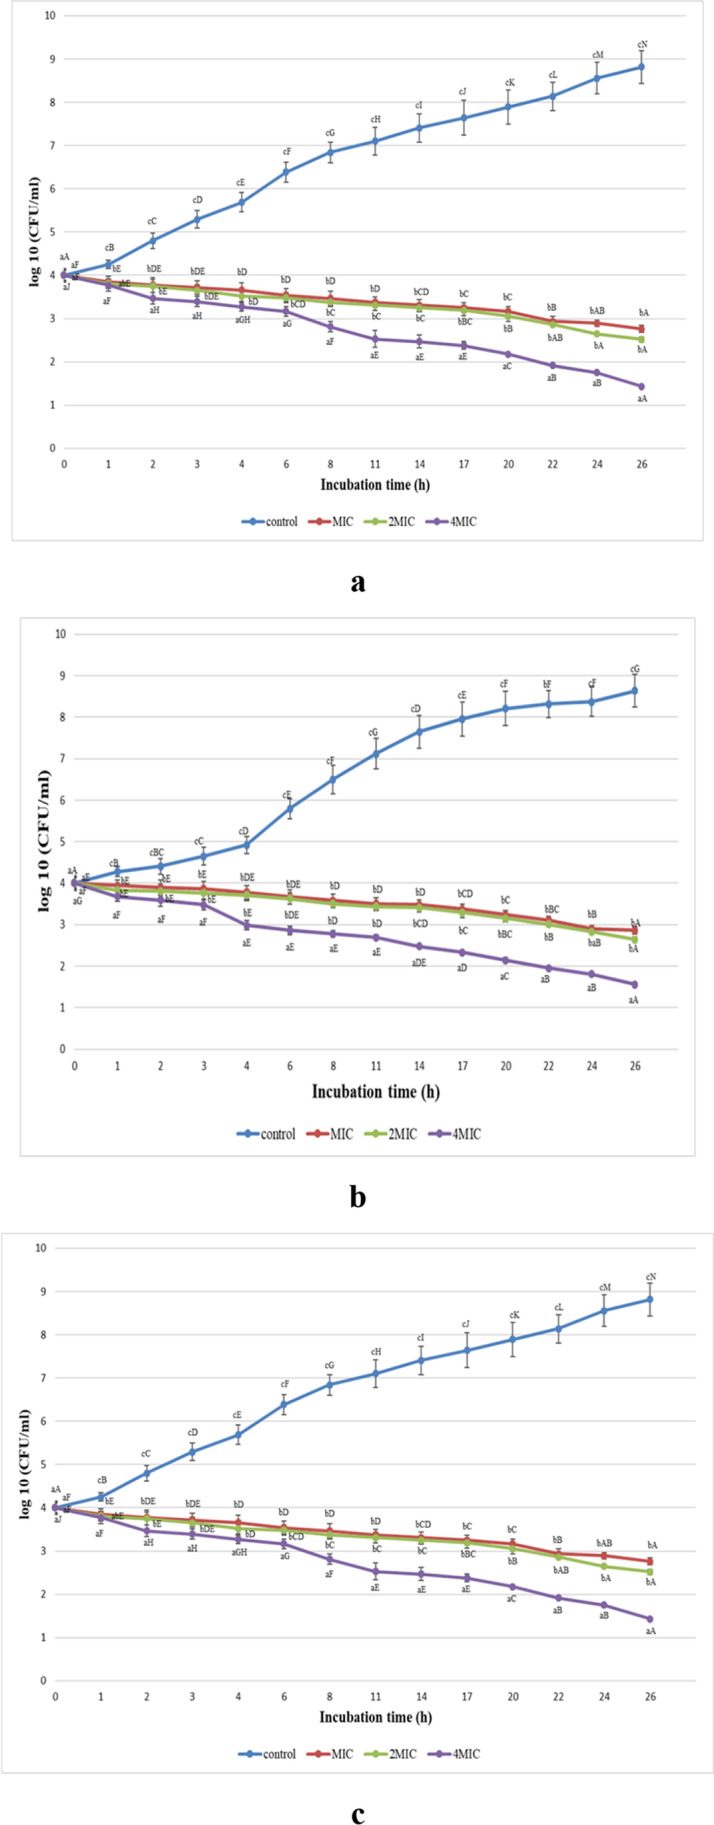
Influence of the dose of BL extract on the growth of a S. aureus, b S. enterica, and c E. coli (log 10 CFU/mL) during 26 h
Therefore, BL extract at 4 × MIC, which corresponds to 1.608, 1.988, and 0.828 mg/mL, was more efficient against S. aureus, S. enterica, and E. coli, respectively. Accordingly, BL extract revealed a bactericidal activity against the tested bacteria, after 26 h. Thereby, the high antibacterial effectiveness of BL extract may be accorded to the plant’s metabolites [65].
Conclusion
The phytochemical contents and biological activities of BL were enhanced by using an augmented simplex-centroid mixture design approach. Three solvents were mixed at different concentrations, and the response optimizer permits to maximize the phytochemical contents and antioxidant and antibacterial activity. Solvent combination leads to better extraction of bioactive compounds and antibacterial activity than using each solvent separately. In addition, BL extract at optimized conditions was effective against the tested foodborne pathogens (S. aureus, S. enterica, and E. coli). The mode of action confirms these results and indicates that BL extract at optimized conditions exerts a dose-dependent bactericidal effect against all tested bacteria. By employing chemometric techniques, PCA and HCA, all the data enable to segregate all of the mixtures and connect phytochemical contents (TPC and TFC) to antioxidant and antibacterial activities using correlation models.
The findings of this study suggested that Beta vulgaris might be an alternative source of biomolecules, which implies its potential commercial usage in nutraceuticals and medications that are helpful to human health.
Author contribution
Moufda Chaari, Khaoula Elhadef, Sarra Akermi, and Lotf Mellouli were involved in methodology, data curation, and writing—original draft preparation; Hajer Ben Hlima and Mariam Fourati contributed to resources and formal analysis; Ahlem Chakchouk-Mtibaa, Tanmay Sarkar, Mohammed Ali Shariati Maksim Rebezov, and Teresa D'Amore were involved in software and validation; and Slim Smaoui was involved in supervision and project administration.
Funding
This research was funded by the Tunisian government PEJC project (2019) no. 19PEJC07-03.
Data and materials availability
The data and materials used and/or analyzed during the present study are available. The authors will provide additional details if required.
Declarations
Ethics approval
All authors were governed by ethics and professionalism.
Conflict of interest
The authors declare no competing interests.
Footnotes
Publisher's note
Springer Nature remains neutral with regard to jurisdictional claims in published maps and institutional affiliations.
References
- 1.Beegum PPS, Pandiselvam R, Ramesh SV, et al (2022) A critical appraisal on the antimicrobial, oral protective, and anti-diabetic functions of coconut and its derivatives. Qual Assur Saf Crops Foods 14:86–100. 10.15586/qas.v14i2.1040
- 2.Wani SA, Naik H, Wagay J, et al (2022) Mentha: A review on its bioactive compounds and potential health benefits. Qual Assur Saf Crops Foods 14:154–168. 10.15586/qas.v14i4.1129
- 3.Xie F, Wang H, Cao Q, et al (2022) The effects of Oldenlandia diffusa water extract on glucose metabolism and inflammation level in rats with streptozotocin-induced gestational diabetes mellitus. Qual Assur Saf Crops Foods 14:24–30. 10.15586/qas.v14i1.970
- 4.Castro-Muñoz R, Díaz-Montes E, Gontarek-Castro E, et al. A comprehensive review on current and emerging technologies toward the valorization of bio-based wastes and by products from foods. Compr Rev Food Sci Food Saf. 2022;21:46–105. doi: 10.1111/1541-4337.12894. [DOI] [PubMed] [Google Scholar]
- 5.Calatayud-Sáez FM (2022) The traditional Mediterranean diet is effective in the prevention and treatment of acute and recurrent inflammatory diseases of childhood. aei 50:93–95. 10.15586/aei.v50i2.565 [DOI] [PubMed]
- 6.Prabhu S, Rajasekar M. Identification of colour pigments in root vegetables - carrot (Daucus carota) and beetroot (Beta vulgaris) by foldscope. Int j sci eng res. 2019;10:4. [Google Scholar]
- 7.Nobari H, Saedmocheshi S, Johnson K, et al. A brief overview of the effects of exercise and red beets on the immune system in patients with prostate cancer. Sustainability. 2022;14:6492. doi: 10.3390/su14116492. [DOI] [Google Scholar]
- 8.Amirpoor A, Zavar R, Amerizadeh A, et al. Effect of beetroot consumption on serum lipid profile: a systematic review and meta-analysis. Curr Probl Cardiol. 2022;47:100887. doi: 10.1016/j.cpcardiol.2021.100887. [DOI] [PubMed] [Google Scholar]
- 9.Nade VS, Kawale LA, Zambre SS, Kapure AB. Neuroprotective potential of Beta vulgaris L. in Parkinson’s disease. Indian J Pharmacol. 2015;47:403–408. doi: 10.4103/0253-7613.161263. [DOI] [PMC free article] [PubMed] [Google Scholar]
- 10.dos S. Baião D, da Silva DVT, Paschoalin VMF, Beetroot, a remarkable vegetable: its nitrate and phytochemical contents can be adjusted in novel formulations to benefit health and support cardiovascular disease therapies. Antioxidants. 2020;9:960. doi: 10.3390/antiox9100960. [DOI] [PMC free article] [PubMed] [Google Scholar]
- 11.Akyüz A, Ersus S (2021) Optimization of enzyme assisted extraction of protein from the sugar beet (Beta vulgaris L.) leaves for alternative plant protein concentrate production. Food Chemistry 335:127673. 10.1016/j.foodchem.2020.127673 [DOI] [PubMed]
- 12.Asadi SZ, Khan MA. The effect of beetroot (Beta vulgaris L.) leaves powder on nutritional, textural, sensorial and antioxidant properties of cookies. J Culin Sci Technol. 2021;19:424–438. doi: 10.1080/15428052.2020.1787285. [DOI] [Google Scholar]
- 13.Goyeneche R, Di Scala K, Ramirez CL, Fanovich MA. Recovery of bioactive compounds from beetroot leaves by supercritical CO2 extraction as a promising bioresource. J Supercrit Fluids. 2020;155:104658. doi: 10.1016/j.supflu.2019.104658. [DOI] [Google Scholar]
- 14.Gawlik-Dziki U, Dziki L, Anisiewicz J, et al. Leaves of white beetroot as a new source of antioxidant and anti-inflammatory compounds. Plants. 2020;9:944. doi: 10.3390/plants9080944. [DOI] [PMC free article] [PubMed] [Google Scholar]
- 15.Silva LGS, Morelli AP, Pavan ICB, et al. Protective effects of beet ( Beta vulgaris ) leaves extract against oxidative stress in endothelial cells in vitro. Phytother Res. 2020;34:1385–1396. doi: 10.1002/ptr.6612. [DOI] [PubMed] [Google Scholar]
- 16.Abd El-Ghffar EA, Hegazi NM, Saad HH, et al. HPLC-ESI- MS/MS analysis of beet (Beta vulgaris) leaves and its beneficial properties in type 1 diabetic rats. Biomed Pharmacother. 2019;120:109541. doi: 10.1016/j.biopha.2019.109541. [DOI] [PubMed] [Google Scholar]
- 17.Gholamalipour Alamdari E, Taleghani A (2022) New bioactive compounds characterized by liquid chromatography–mass spectrometry and gas chromatography–mass spectrometry in hydro-methanol and petroleum ether extracts of Prosopis farcta (Banks & Sol.) J. F. Macbr weed. J Mass Spectrom 57:. 10.1002/jms.4884 [DOI] [PubMed]
- 18.Lorizola IM, Furlan CPB, Portovedo M, et al (2018) Beet stalks and leaves (Beta vulgaris L.) protect against high-fat diet-induced oxidative damage in the liver in mice. Nutrients 10:872. 10.3390/nu10070872 [DOI] [PMC free article] [PubMed]
- 19.Biondo PBF, Boeing JS, Barizão ÉO, et al. Evaluation of beetroot (Beta vulgaris L.) leaves during its developmental stages: a chemical composition study. Food Sci Technol. 2014;34:94–101. doi: 10.1590/S0101-20612014005000007. [DOI] [Google Scholar]
- 20.de Oliveira SPA, do Nascimento HMA, Sampaio KB, de Souza EL, A review on bioactive compounds of beet ( Beta vulgaris L. subsp. vulgaris ) with special emphasis on their beneficial effects on gut microbiota and gastrointestinal health. Crit Rev Food Sci Nutr. 2021;61:2022–2033. doi: 10.1080/10408398.2020.1768510. [DOI] [PubMed] [Google Scholar]
- 21.Hikmawanti NPE, Dwita LP, Wisnunanda DW, Farista F. The effect of different extracts of beetroots as antioxidant and anti-anaemia on phenylhydrazine-induced rats. Eur Pharm J. 2021;68:1–7. doi: 10.2478/afpuc-2020-0014. [DOI] [Google Scholar]
- 22.Grispoldi L, Karama M, Armani A, et al. Staphylococcus aureus enterotoxin in food of animal origin and staphylococcal food poisoning risk assessment from farm to table. Ital J Anim Sci. 2021;20:677–690. doi: 10.1080/1828051X.2020.1871428. [DOI] [Google Scholar]
- 23.Monte DF, Lincopan N, Berman H, et al. Genomic features of high-priority Salmonella enterica serovars circulating in the food production chain, Brazil, 2000–2016. Sci Rep. 2019;9:11058. doi: 10.1038/s41598-019-45838-0. [DOI] [PMC free article] [PubMed] [Google Scholar]
- 24.Punia Bangar S, Sharma N, Bhardwaj A, Phimolsiripol Y (2022) Lactic acid bacteria: a bio-green preservative against mycotoxins for food safety and shelf-life extension. Qual Assur Saf Crops Foods 14:13–31. 10.15586/qas.v14i2.1014
- 25.Adnan Md, Oh KK, Azad MOK, et al (2020) Kenaf (Hibiscus cannabinus L.) leaves and seed as a potential source of the bioactive compounds: effects of various extraction solvents on biological properties. Life 10:223. 10.3390/life10100223 [DOI] [PMC free article] [PubMed]
- 26.Aboulghazi A, Bakour M, Fadil M, Lyoussi B. Simultaneous optimization of extraction yield, phenolic compounds and antioxidant activity of Moroccan propolis extracts: improvement of ultrasound-assisted technique using response surface methodology. Processes. 2022;10:297. doi: 10.3390/pr10020297. [DOI] [Google Scholar]
- 27.Xu H-R, Zhang Y-Q, Wang S, et al (2022) Optimization of functional compounds extraction from Ginkgo biloba seeds using response surface methodology. Qual Assur Saf Crops Foods 14:102–112. 10.15586/qas.v14i1.1033
- 28.Alcântara MA, de Lima Brito Polari I, de Albuquerque Meireles BRL, , et al. Effect of the solvent composition on the profile of phenolic compounds extracted from chia seeds. Food Chem. 2019;275:489–496. doi: 10.1016/j.foodchem.2018.09.133. [DOI] [PubMed] [Google Scholar]
- 29.Ksibi IE, Slama RB, Faidi K, et al. Mixture approach for optimizing the recovery of colored phenolics from red pepper (Capsicum annum L.) by-products as potential source of natural dye and assessment of its antimicrobial activity. Ind Crops Prod. 2015;70:34–40. doi: 10.1016/j.indcrop.2015.03.017. [DOI] [Google Scholar]
- 30.Smaoui S, Ben Hlima H, Fourati M, et al (2020) Multiobjective optimization of Phoenix dactylifera L. seeds extraction: mixture design methodology for phytochemical contents and antibacterial activity. J Food Process Preserv 44:. 10.1111/jfpp.14822
- 31.Gasemloo S, Khosravi M, Sohrabi MR, et al. Response surface methodology (RSM) modeling to improve removal of Cr (VI) ions from tannery wastewater using sulfated carboxymethyl cellulose nanofilter. J Clean Prod. 2019;208:736–742. doi: 10.1016/j.jclepro.2018.10.177. [DOI] [Google Scholar]
- 32.Chaari M, Akermi S, Elhadef K, et al (2022) From modeling and optimizing extraction of peels beetroot (Beta vulgaris L.) betalains to in silico probing of their antibacterial multitarget mechanisms. Biomass Conv Bioref. 10.1007/s13399-022-03140-6
- 33.Lezoul NEH, Belkadi M, Habibi F, Guillén F. Extraction processes with several solvents on total bioactive compounds in different organs of three medicinal plants. Molecules. 2020;25:4672. doi: 10.3390/molecules25204672. [DOI] [PMC free article] [PubMed] [Google Scholar]
- 34.López-Froilán R, Hernández-Ledesma B, Cámara M, Pérez-Rodríguez ML. Evaluation of the antioxidant potential of mixed fruit-based beverages: a new insight on the Folin-Ciocalteu method. Food Anal Methods. 2018;11:2897–2906. doi: 10.1007/s12161-018-1259-1. [DOI] [Google Scholar]
- 35.Saharan P, Sadh PK, Duhan S, Duhan JS. Bio-enrichment of phenolic, flavonoids content and antioxidant activity of commonly used pulses by solid-state fermentation. Food Measure. 2020;14:1497–1510. doi: 10.1007/s11694-020-00399-z. [DOI] [Google Scholar]
- 36.Fourati M, Smaoui S, Ennouri K, et al. Multiresponse optimization of pomegranate peel extraction by statistical versus artificial intelligence: predictive approach for foodborne bacterial pathogen inactivation. Evid Based Complementary Altern Med. 2019;2019:1–18. doi: 10.1155/2019/1542615. [DOI] [PMC free article] [PubMed] [Google Scholar]
- 37.Elhadef K, Akermi S, Ben Hlima H, et al. Tunisian pistachio hull extracts: phytochemical content, antioxidant activity, and foodborne pathogen inhibition. J Food Qual. 2021;2021:1–18. doi: 10.1155/2021/9953545. [DOI] [Google Scholar]
- 38.Zeouk I, Ouedrhiri W, Jiménez IA, et al. Intra-combined antioxidant activity and chemical characterization of three fractions from Rhamnus alaternus extract: mixture design. Ind Crops Prod. 2020;144:112054. doi: 10.1016/j.indcrop.2019.112054. [DOI] [Google Scholar]
- 39.Aykın-Dinçer E, Güngör KK, Çağlar E, Erbaş M. The use of beetroot extract and extract powder in sausages as natural food colorant. Int J Food Eng. 2021;17:75–82. doi: 10.1515/ijfe-2019-0052. [DOI] [Google Scholar]
- 40.Park BI, Kim J, Lee K, et al. Flavonoids in common and tartary buckwheat hull extracts and antioxidant activity of the extracts against lipids in mayonnaise. J Food Sci Technol. 2019;56:2712–2720. doi: 10.1007/s13197-019-03761-2. [DOI] [PMC free article] [PubMed] [Google Scholar]
- 41.Ameer K, Shahbaz HM, Kwon J-H. Green extraction methods for polyphenols from plant matrices and their byproducts: a review: polyphenols extraction by green methods. Compr Rev Food Sci Food Saf. 2017;16:295–315. doi: 10.1111/1541-4337.12253. [DOI] [PubMed] [Google Scholar]
- 42.Ivanović M, Islamčević Razboršek M, Kolar M. Innovative extraction techniques using deep eutectic solvents and analytical methods for the isolation and characterization of natural bioactive compounds from plant material. Plants. 2020;9:1428. doi: 10.3390/plants9111428. [DOI] [PMC free article] [PubMed] [Google Scholar]
- 43.Wijekoon MMJO, Bhat R, Karim AA. Effect of extraction solvents on the phenolic compounds and antioxidant activities of bunga kantan (Etlingera elatior Jack.) inflorescence. J Food Compost Anal. 2011;24:615–619. doi: 10.1016/j.jfca.2010.09.018. [DOI] [Google Scholar]
- 44.Galanakis CM, Goulas V, Tsakona S, et al. A knowledge base for the recovery of natural phenols with different solvents. Int J Food Prop. 2013;16:382–396. doi: 10.1080/10942912.2010.522750. [DOI] [Google Scholar]
- 45.Vural N, Algan Cavuldak Ö, Akay MA, Anlı RE. Determination of the various extraction solvent effects on polyphenolic profile and antioxidant activities of selected tea samples by chemometric approach. Food Measure. 2020;14:1286–1305. doi: 10.1007/s11694-020-00376-6. [DOI] [Google Scholar]
- 46.Handa CL, de Lima FS, Guelfi MFG, et al. Multi-response optimisation of the extraction solvent system for phenolics and antioxidant activities from fermented soy flour using a simplex-centroid design. Food Chem. 2016;197:175–184. doi: 10.1016/j.foodchem.2015.10.124. [DOI] [PubMed] [Google Scholar]
- 47.dos Santos C, Mizobucchi AL, Escaramboni B, et al (2020) Optimization of Eugenia punicifolia (Kunth) D. C. leaf extraction using a simplex centroid design focused on extracting phenolics with antioxidant and antiproliferative activities. BMC Chemistry 14:34. 10.1186/s13065-020-00686-2 [DOI] [PMC free article] [PubMed]
- 48.Ng ZX, Samsuri SN, Yong PH (2020) The antioxidant index and chemometric analysis of tannin, flavonoid, and total phenolic extracted from medicinal plant foods with the solvents of different polarities. J Food Process Preserv 44:.10.1111/jfpp.14680
- 49.Jasna T K, Khaleel K M (2022) Evaluation of antioxidant activities and quantitative estimation of phytochemicals in Kandelia candel (L.) Druce. Int J Res Pharm Sci 13:166–172. 10.26452/ijrps.v13i2.138
- 50.Naseem Z, Hanif MA, Zahid M, et al. Ultrasound-assisted deep eutectic solvent–based extraction of phytochemicals from Mentha arvensis: optimization using Box-Behnken design. Biomass Conv Bioref. 2021 doi: 10.1007/s13399-021-01617-4. [DOI] [Google Scholar]
- 51.Chhikara N, Kushwaha K, Jaglan S, et al. Nutritional, physicochemical, and functional quality of beetroot ( Beta vulgaris L.) incorporated Asian noodles. Cereal Chem. 2019;96:154–161. doi: 10.1002/cche.10126. [DOI] [Google Scholar]
- 52.Edziri H, Jaziri R, Haddad O, et al. Phytochemical analysis, antioxidant, anticoagulant and in vitro toxicity and genotoxicity testing of methanolic and juice extracts of Beta vulgaris L. S Afr J Bot. 2019;126:170–175. doi: 10.1016/j.sajb.2019.01.017. [DOI] [Google Scholar]
- 53.Righi Pessoa da Silva H, da Silva C, Bolanho BC (2018) Ultrasonic-assisted extraction of betalains from red beet ( Beta vulgaris L.). J Food Process Eng 41:e12833. 10.1111/jfpe.12833
- 54.Čanadanović-Brunet JM, Savatović SS, Ćetković GS, et al (2011) Antioxidant and antimicrobial activities of beet root pomace extracts. Czech J Food Sci 29:575–585. 10.17221/210/2010-CJFS
- 55.Pellegrini MC, Ponce AG. Beet (Beta vulgaris) and leek (Allium porrum) leaves as a source of bioactive compounds with anti-quorum sensing and anti-biofilm activity. Waste Biomass Valor. 2020;11:4305–4313. doi: 10.1007/s12649-019-00775-x. [DOI] [Google Scholar]
- 56.Das M, Das A, Samaddar S, et al (2018) Vitexin altersStaphylococcus aureussurface hydrophobicity to interfere with biofilm formatio [DOI] [PubMed]
- 57.Martinez RM, Hohmann MS, Longhi-Balbinot DT, et al. Analgesic activity and mechanism of action of a Beta vulgaris dye enriched in betalains in inflammatory models in mice. Inflammopharmacol. 2020;28:1663–1675. doi: 10.1007/s10787-020-00689-4. [DOI] [PubMed] [Google Scholar]
- 58.Tayebeh B, Soraya K, Khaneghah AM (2021) Antioxidant and antibacterial activity of ethanolic extract of safflower with contrasting seed coat colors. Qual Assur Saf Crops Foods 13:94–100. 10.15586/qas.v13i2.866
- 59.Miladinović DL, Dimitrijević MV, Mihajilov-Krstev TM, et al. The significance of minor components on the antibacterial activity of essential oil via chemometrics. LWT. 2021;136:110305. doi: 10.1016/j.lwt.2020.110305. [DOI] [Google Scholar]
- 60.Ferreira DS, Rocha JCB, Arellano DB, Pallone JAL (2022) Discrimination of South American grains based on fatty acid. Qual Assur Saf Crops Foods 14:30–42. 10.15586/qas.v14i3.1064
- 61.Cerqueira da Silva VH, da Silva S, junior AL, Pinheiro Lôbo I, , et al. Chemometric tools in the optimization of a microwave-assisted digestion procedure for guarana-based drink samples and data analysis from elemental, caffeine, and epicatechin contents. Food Chem. 2021;365:130468. doi: 10.1016/j.foodchem.2021.130468. [DOI] [PubMed] [Google Scholar]
- 62.Tan J, Li M-F (2021) Rapid and nondestructive identification of Belgian and Netherlandish Trappist beers by front-face synchronous fluorescence spectroscopy coupled with multiple statistical analysis. Qual Assur Saf Crops Foods 13:83–92. 10.15586/qas.v13i1.839
- 63.Sıcak Y, Şahin-Yağlıoğlu A, Öztürk M. Bioactivities and phenolic constituents relationship of Muğla thyme and pine honey of Turkey with the chemometric approach. Food Measure. 2021;15:3694–3707. doi: 10.1007/s11694-021-00940-8. [DOI] [Google Scholar]
- 64.Lee C-H, Woo H-J, Kang J-H, Song KB. Electrostatic spraying of passion fruit (Passiflora edulis L.) peel extract for inactivation of Escherichia coli O157:H7 and Listeria monocytogenes on fresh-cut lollo rossa and beetroot leaves. Food Bioprocess Technol. 2021;14:898–908. doi: 10.1007/s11947-021-02608-z. [DOI] [Google Scholar]
- 65.Bouslamti M, El Barnossi A, Kara M, et al (2022) Total polyphenols content, antioxidant and antimicrobial activities of leaves of Solanum elaeagnifolium Cav. from Morocco. Molecules 27:4322. 10.3390/molecules27134322 [DOI] [PMC free article] [PubMed]
Associated Data
This section collects any data citations, data availability statements, or supplementary materials included in this article.
Data Availability Statement
The data and materials used and/or analyzed during the present study are available. The authors will provide additional details if required.