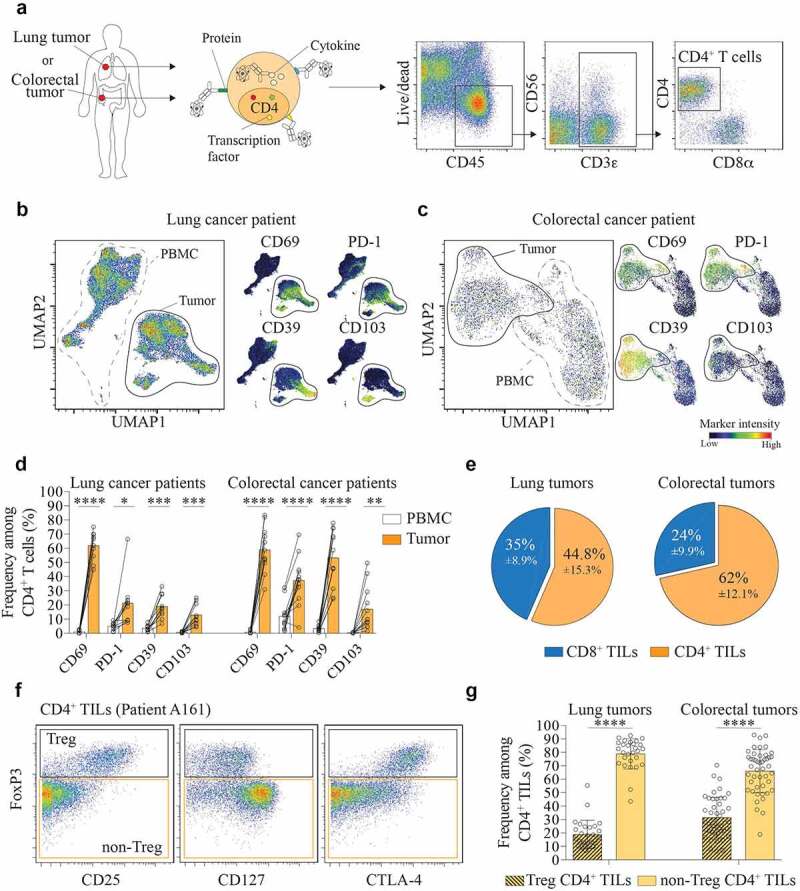
Figure 1.

CD4+ TILs are composed of a majority of non-Treg cells.
(a) Identification of CD4+ T cells by mass-cytometry (Live CD45+CD3+CD4+). Representative dot plot from one colorectal tumor sample. (b) UMAP plot on CD4+ T cells from paired blood and tumor samples of a lung cancer patient (left panel). Normalized expression intensities of CD69, CD103, PD-1, and CD39 were calculated and overlaid on the UMAP plot (right panel). (c) UMAP plot on CD4+ T cells from paired blood and tumor samples of a colorectal cancer patient (left panel). Normalized expression intensities of CD69, CD103, PD-1, and CD39 were calculated and overlaid on the UMAP plot (right panel). (d) Expression of CD69, CD103, PD-1, and CD39 by CD4+ T cells in PBMC (white) and tumor (orange). Data are from paired samples of n = 10 (lung cancer) and n = 12 (colorectal cancer) biologically independent individuals. Means ± SD, Paired t test – two-tailed. *p ≤ 0.05, **p ≤ 0.01, ***p ≤ 0.001, ****p ≤ 0.0001. (e) Frequency of CD4+ and CD8+ TILs among total CD3+ TILs in lung tumors (left) and colorectal tumors (right). Data are from tumor samples of n = 28 (lung tumors) and n = 51 (colorectal tumors) biologically independent individuals. Means ± SD. (f) Gating strategy to distinguish between Treg (Live CD45+CD3+CD4+Foxp3+) and Non-Treg CD4+ TILs (Live CD45+CD3+CD4+FoxP3–). Representative dot plot from one colorectal tumor sample. (g) Frequency of Non-Treg and Treg CD4+ TILs in lung tumors (left) and colorectal tumors (right). Data are from tumor samples of n = 28 (lung tumors) and n = 51 (colorectal tumors) biologically independent individuals. Means ± SD, Paired t test – two-tailed. ****p ≤ 0.0001
