Abstract
Background:
Anorexia nervosa (AN) is a psychological disorder, which is characterized by the misunderstanding of body image, food restriction, and low body weight. An increasing number of studies have reported that the pathophysiological mechanism of AN might be associated with the dysbiosis of gut microbiota. The purpose of our study was to explore the features of gut microbiota in patients with AN, hoping to provide valuable information on its pathogenesis and treatment.
Methods:
In this cross-sectional study, from August 2020 to June 2021, patients with AN who were admitted into Peking University Third Hospital and Peking University Sixth Hospital (n = 30) were recruited as the AN group, and healthy controls (HC) were recruited from a middle school and a university in Beijing (n = 30). Demographic data, Hamilton Depression Scale (HAMD) scores of the two groups, and length of stay of the AN group were recorded. Microbial diversity analysis of gut microbiota in stool samples from the two groups was analyzed by 16S ribosomal RNA (rRNA) gene sequencing.
Results:
The weight (AN vs. HC, [39.31 ± 7.90] kg vs. [56.47 ± 8.88] kg, P < 0.001) and body mass index (BMI, AN vs. HC, [14.92 ± 2.54] kg/m2vs. [20.89 ± 2.14] kg/m2, P < 0.001) of patients with AN were statistically significantly lower than those of HC, and HAMD scores in AN group were statistically significantly higher than those of HC. For alpha diversity, there were no statistically significant differences between the two groups; for beta diversity, the two groups differed obviously regarding community composition. Compared to HC, the proportion of Lachnospiraceae in patients with AN was statistically significantly higher (AN vs. HC, 40.50% vs. 31.21%, Z = −1.981, P = 0.048), while that of Ruminococcaceae was lower (AN vs. HC, 12.17% vs. 19.15%, Z = −2.728, P = 0.007); the proportion of Faecalibacterium (AN vs. HC, 3.97% vs. 9.40%, Z = −3.638, P < 0.001) and Subdoligranulum (AN vs. HC, 4.60% vs. 7.02%, Z = −2.369, P = 0.018) were statistically significantly lower, while that of Eubacterium_hallii_group was significantly higher (AN vs. HC, 7.63% vs. 3.43%, Z = −2.115, P = 0.035). Linear discriminant effect (LEfSe) analysis (LDA score >3.5) showed that o_Lachnospirales, f_Lachnospiraceae, and g_Eubacterium_hallii_group (o, f and g represents order, family and genus respectively) were enriched in patients with AN. Microbial function of nutrient transport and metabolism in AN group were more abundant (P > 0.05). In AN group, weight and BMI were significantly negatively correlated with the abundance of Bacteroidota and Bacteroides, while positively correlated with Subdoligranulum. BMI was significantly positively correlated with Firmicutes; HAMD scores were significantly negatively correlated with Faecalibacterium.
Conclusions:
The composition of gut microbiota in patients with AN was different from that of healthy people. Clinical indicators have correlations with the abundance of gut microbiota in patients with AN.
Keywords: Gut microbiota, Anorexia nervosa, Microbial diversity analysis, Lachnospiraceae, Ruminococcaceae, Faecalibacterium, Eubacterium_hallii_group, Bacteroides
Introduction
Eating disorders are caused by the interaction of biological, psychological, and social factors, mainly including anorexia nervosa (AN) and bulimia nervosa. Among them, AN is characterized by a distorted cognition of body image, an intense fear of gaining weight, and low weight by food restriction and excessive physical activity. Besides, cognitive and emotional alterations can also be observed, which seriously affect the normal life of patients. According to statistics, the age with the highest risk for developing AN in women is between 10 and 24 years old, and the age of onset for AN tends to be younger.[1,2]
At present, there is no agreed conclusion on the pathogenesis of AN. With the development of biological information technology, studies have found that the gut microbiota can be associated with the brain through the enteric nervous system, immune system, endocrine system, metabolic system, etc. to form the microbiota–gut–brain axis and play an important role in AN.[3,4] On the basis of microbiota–gut–brain axis, the gut microbiota is involved in the development of AN, which gives rise to the changes in eating behaviors and emotion of the host. The most studied mechanisms are as follows. One possible mechanism is related to short-chain fatty acids (SCFAs, the metabolite of gut microbiota), which bind to free fat acid receptor 2 (FFAR2) and free fat acid receptor 3 (FFAR3) together with olfactory receptor family 51 subfamily E member 1 (OR51E1, G protein-coupled receptor 164 [GPR164]) to stimulate the secretion of hormones which can promote satiety, such as glucagon-like peptide-1 (GLP-1) and peptide YY (PYY).[5] Another possible mechanism is that α-melanocyte-stimulating hormone (α-MSH), a polypeptide from proopiomelanocortin, plays a part in accelerating the anorexic process and regulating satiety.[6] Casein hydrolytic peptidase B protein homolog (ClpB) encoded by Escherichia coli is considered as the mimic antigen of α-MSH, which can increase the host's satiety and decrease food intake.[7] Besides, the activity of the hypothalamic–pituitary–adrenal (HPA) axis, an important part of the microbiota–gut–brain axis, increases with the rise of cortisol levels in AN, which results in anxiety and anorexic behaviors.[8] In summary, the gut microbiota may be involved in the pathogenesis of AN, encompassing neural, immune, endocrine, and other pathways.
As a potential mechanism, the richness and diversity of gut microbiota in patients with AN alter to varying degrees.[9] One possible hypothesis is that patients with AN deliberately limit their diet because of worries about weight gain or other reasons, which results in the imbalance of some gut microbiota due to inadequate food nutrition sources or being replaced by other microbiota. As a result, abnormal microbiota plays a role in the process of regulating host behavior, physiology, and metabolism. The other hypothesis is that the disorder of gut microbiota may appear before the onset of AN, and its disorder may cause anorexia and other symptoms of the host through microbiota–gut–brain axis.[3,10] At present, there are few studies focused on gut microbiota of patients with AN in China; thus, in this study, we collected stool samples both from patients with AN and healthy controls (HC) through 16S ribosomal RNA (rRNA) gene sequencing to explore the features of microbial diversity and composition. In addition, we also explored the functions of gut microbiota and the correlations between gut microbiota and clinical indicators in patients with AN.
Methods
Ethical approval
This study got approvals both from the Medical Science Research Ethics Committee of Peking University Third Hospital (No. IRB00006761-M2020409) and the Medical Ethics Committee of Peking University Sixth Hospital ([No. 2021] L. S. No. [27]). Informed consents were signed by study participants, or their legal guardians if the participants were adolescents.
Patients and controls
A total of 60 participants took part in this cross-sectional study. From August 2020 to June 2021, 30 patients with AN (26 females and 4 males) admitted into Peking University Third Hospital and Peking University Sixth Hospital were recruited as the AN group, and 30 healthy controls (20 females and 10 males) were recruited from a middle school and a university in Beijing as the HC group. The inclusion and exclusion criteria of each group were as follows.
For the AN group, inclusion criteria were as follows: (1) patients diagnosed with AN according to the Diagnostic and Statistical Manual (DMS-V); (2) those aged 11–35 years; and (3) those who did not accept any intervention treatments before participating in the study, with a natural diet. Exclusion criteria were as follows: (1) subjects with severe psychiatric disorders who could not cooperate; (2) those with diabetes mellitus, thyroid disease, and other physical diseases which may influence weight and eating behaviors; (3) those who had taken antibiotics, anti-obesity drugs, and probiotics within the previous two weeks; and (4) pregnant and lactating women. For the HC group, inclusion criteria included: (1) subjects aged 11–35 years; and (2) those with physical health, normal diet, and body mass index (BMI) within normal range. Subjects with sleep and learning disorders, or other mental illness were excluded and other exclusion criteria were the same as those of AN.
Clinical data collection
For patients with AN, we collected the demographic data including gender, age, height, weight, and BMI while they collected their stool samples, and we also recorded their length of stay. For HC, we also collected the same demographic data. Moreover, all participants were assessed by Hamilton Depression Scale (Hamilton, 1960, HAMD-24 items) by trained physicians for depression and the scores were recorded.
Stool sample collection and storage
For patients with AN, we used sterile tools to fetch 1–3 g stool samples at admission which could not be exposed to the air and ground, then put the sample into the sampling tube and store it in the −80°C liquid nitrogen refrigerator within 2 h. Similarly, participants in HC group collected their samples by the same procedure at home, then they carried or delivered the samples to the hospital, which were also kept in the −80°C liquid nitrogen refrigerator. All of these samples were stored on dry ice and sent to the Majorbio Bio-Pharm Technology Co. (Shanghai, China) for microbial information analysis.
DNA extraction and polymerase chain reaction (PCR) amplification
Total DNA of the microbial community was extracted from 60 stool samples according to the manufacturer's instructions of E.Z.N.A.® soil DNA Kit (Omega Bio-Tek, Norcross, Georgia, USA). The DNA extraction was checked by 1% agarose gel (Biowest, The Kingdom of Spain), and DNA concentration and purity were determined by NanoDrop 2000 ultraviolet–visible spectrophotometer (Thermo Fisher Scientific, Wilmington, Delaware, USA). The V3–V4 variable region of the bacterial 16S rRNA gene was amplified with primers (Sangon Biotech [Shanghai] Co., Ltd., China) 338F (5′-ACTCCTACGGGAGGCAGCAG-3′) and 806R (5′-GGACTACHVGGGTWTCTAAT-3′) by ABI GeneAmp® 9700 PCR thermocycler (ABI, San Diego, California, USA). The specific PCR amplification of 16S rRNA gene process was as follows: initial denaturation at 95°C for 3 min, followed by 27 cycles of denaturing at 95°C for 30 s, annealing at 55°C for 30 s and extension at 72°C for 45 s, and steady extension at 72°C for 10 min, and finally keep them at 4°C. The PCR reaction systems (all from Sangon Biotech [Shanghai] Co., Ltd., China except TransStart FastPfu DNA Polymerase) included 5 × TransStart FastPfu buffer 4 μL, 2.5 mmol/L deoxy-ribonucleoside triphosphates (dNTPs) 2 μL, forward primer (5 μmol/L) 0.8 μL, reverse primer (5 μmol/L) 0.8 μL, TransStart FastPfu DNA Polymerase (TransGen, Beijing, China) 0.4 μL, bovine serum albumin (BSA) 0.2 μL, template DNA 10 ng, and finally double distilled H2O (ddH2O) up to 20 μL. There were three replicates per sample. The PCR product was extracted from 2% agarose gel (Biowest) and purified by using the AxyPrep DNA Gel Extraction Kit (Axygen Biosciences, Union City, California, USA) and quantified by using Quantus™ Fluorometer (Promega, Madison, Wisconsin, USA).
16S rRNA gene sequencing and data processing
Purified amplicons were pooled in equimolar and paired-end sequenced on an Illumina MiSeq PE300 platform (Illumina, San Diego, California, USA) according to the standard protocols of Majorbio Bio-Pharm Technology Co. Ltd. (Shanghai, China).
The raw 16S rRNA gene sequencing reads were quality-filtered by Fastp (Version 0.19.6, https://github.com/OpenGene/fastp) and merged by Fast Length Adjustment Of Short Reads (FLASH, Version1.2.11, https://ccb.jhu.edu/software/FLASH/index.shtml).[11,12] Operational taxonomic units (OTUs) with a 97% similarity cutoff were clustered by using UPARSE (Version7.0.1090, Robert C. Edgar, USA, http://www.drive5.com/uparse/) and chimeric sequences were identified and removed.[13,14] The taxonomy of each OTU representative sequence was compared with the Silva 16S rRNA database (https://www.arb-silva.de/), and the comparison threshold value was set as 70%.
Statistical analysis and visualization
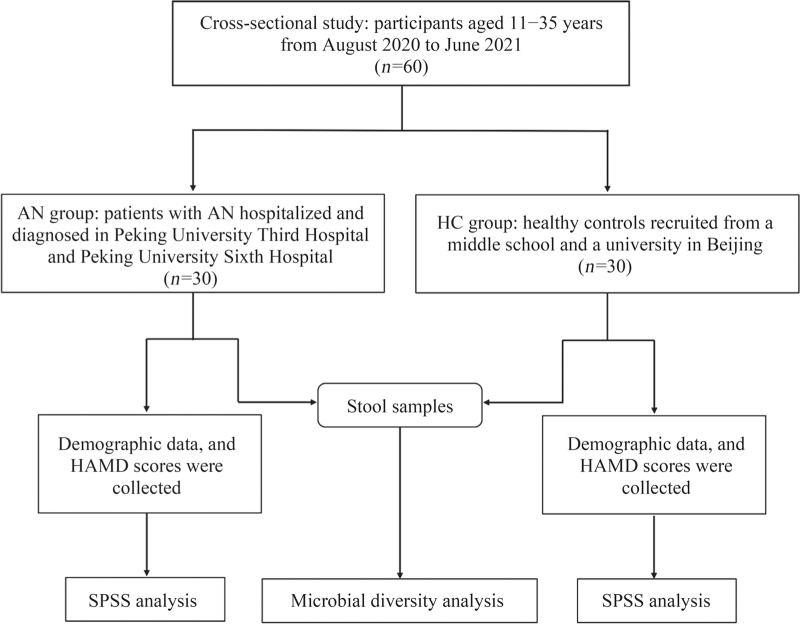
Statistical Program for Social Sciences 23.0 software (SPSS, Inc., Chicago, Illinois, USA) was used for statistical analysis. Data were tested for normality and homogeneity of variance at first. Mean ± standard deviation (SD) was used to represent the measurement variables that conformed to the normal distribution, and the median and interquartile range were used to represent measurement variables of non-normal distribution. We used the independent sample t-test to compare variables with normal distribution between the two groups. Mann–Whitney U test (rank-sum test) was used for comparison of variables with non-normal distribution, and enumeration data were tested by chi-squared test. Microbial diversity analysis was completed through an online bioinformatics analysis platform, Majorbio Cloud (https://cloud.majorbio.com, Shanghai, China). Alpha diversity on OTU level for each group was measured by Sobs, Chao, and Ace indexes (for estimation of abundance), Shannon and Simpson indexes (for estimation of diversity), and the difference in alpha diversity between the two groups was tested by the Mann–Whitney U test. For beta diversity, principal coordinates analysis (PCoA) and partial least squares discrimination analysis (PLS-DA) were used to conduct composition similarity analysis between the grouped samples on OTU level, and Adonis analysis was used to detect the difference. The differences in the mean relative abundance of gut microbiota between the AN and HC groups were compared by the Mann–Whitney U test. Linear discriminant effect (LEfSe) analysis (LDA) was used to identify biomarkers with significant differences from phylum to genus levels between the two groups (LDA score >3.5). Phylogenetic Investigation of Communities by Reconstruction of Unobserved States program (PICRUSt, Version 1.1.0, http://picrust.github.io/picrust/) was used for the functional prediction of microbiota based on the Cluster of Orthologous Groups (COG) database (http://www.ncbi.nlm.nih.gov/COG/), and we tested the differences of functions between the two groups by Mann–Whitney U test. We further analyzed the correlations between clinical indicators and gut microbiota on phylum and genus levels by using Spearman correlation analysis, and the correlation coefficients were visually expressed in different colors by Heatmap. P < 0.05 was considered to be statistically significant. Figure 1 shows the flowchart of the study.
Figure 1.
Flowchart of the study on features of gut microbiota in patients with anorexia nervosa. AN: Anorexia nervosa; HAMD: Hamilton Depression Scale; HC: Healthy controls.
Results
Clinical indicators analysis of the two groups
Table 1 shows the summarized general data, including demographic data and HAMD scores of HC and patients with AN. There were no significant differences in gender, age, and height (P > 0.05). However, the weight and BMI of the two groups were significantly different, while those of AN group were lower (P < 0.001). HAMD scores of patients with AN were significantly higher than those of HC (P = 0.044), but no obvious depression was found in the two groups. Besides, the length of stay of patients was 46 (17, 58) days.
Table 1.
Comparison of general data between HC and AN groups.
| Variables | HC (n = 30) | AN (n = 30) | χ2/Z/t | P-value |
| Gender | ||||
| Male | 10 (33.33) | 4 (13.33) | 3.354∗ | 0.067 |
| Female | 20 (66.67) | 26 (86.67) | ||
| Age (years) | 18 (13, 24) | 16 (13, 22) | −0.455† | 0.649 |
| Height (cm) | 164.07 ± 7.76 | 161.99 ± 5.98 | 1.163‡ | 0.250 |
| Weight (kg) | 56.47 ± 8.88 | 39.31 ± 7.90 | 7.906‡ | <0.001 |
| BMI (kg/m2) | 20.89 ± 2.14 | 14.92 ± 2.54 | 9.838‡ | <0.001 |
| HAMD | 2 (2, 4) | 5 (2, 9) | −2.010† | 0.044 |
Data are expressed as n (%), mean ± standard deviation, or median (QL, QU).
χ2 value.
Z value.
t value. AN: Anorexia nervosa; BMI: Body mass index; HAMD: Hamilton Depression Scale; HC: Healthy controls; QL: Lower quartile; QU: Upper quartile.
Composition of gut microbiota
After quality filtering and removal, a total of 3,288,947 sequences were obtained from the 60 stool samples, with an average of 54,816 sequences per sample. Finally, we obtained 11 phyla, 22 classes, 51 orders, 99 families, 257 genera, 504 species, and 820 OTUs. There were 683 OTUs of HC and 649 OTUs of patients with AN.
Alpha and beta diversity analysis
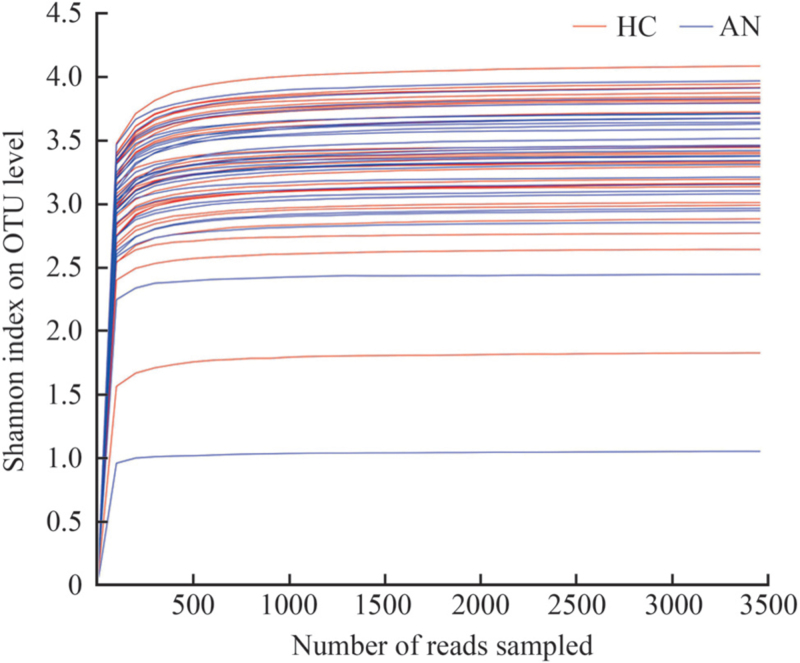
Table 2 shows the differences in alpha diversity between the two groups measured by Sobs, Chao, Ace, Shannon, and Simpson indexes on OTU level. The results showed that compared with HC, Sobs, Chao, Ace, and Shannon indexes decreased in patients with AN; however, there were no significant differences in these indexes (P > 0.05). The rarefaction curves gradually flattened out, which suggested that the sequencing data were sufficient to meet the follow-up analysis, ensuring the reliability of the results [Figure 2].
Table 2.
Alpha diversity analysis on OTU level between HC and AN groups.
| Item | Sobs index | Chao index | Ace index | Shannon index | Simpson index |
| HC | 145.60 ± 37.93 | 198.57 ± 52.69 | 210.27 ± 57.73 | 3.37 ± 0.48 | 0.09 ± 0.07 |
| AN | 138.80 ± 36.85 | 177.64 ± 50.72 | 183.07 ± 53.10 | 3.33 ± 0.55 | 0.09 ± 0.10 |
| Z | −0.495 | −1.331 | −1.789 | −0.251 | −0.163 |
| P-value | 0.626 | 0.186 | 0.075 | 0.807 | 0.877 |
Data are expressed as mean ± standard deviation. AN: Anorexia nervosa; HC: Healthy controls; OTU: Operational taxonomic unit.
Figure 2.
The rarefaction curves of the samples of HC and AN groups based on the Shannon index on OTU level. X-axis represents the extracted sequencing and Y-axis represents the Shannon index. AN: Anorexia nervosa; HC: Healthy controls; OTU: Operational taxonomic unit.
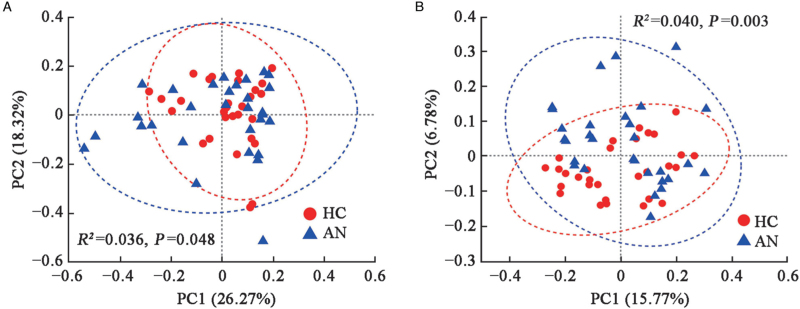
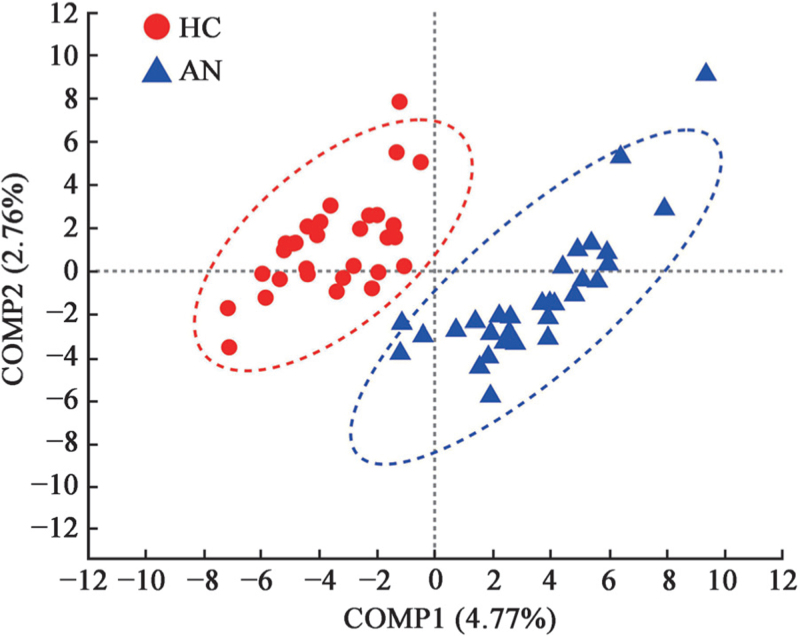
For beta diversity on OTU level, PCoA which was based on the Weighted UniFrac and Unweighted UniFrac distances showed obviously different microbial community composition between the two groups (Weighted UniFrac, Adonis, R2 = 0.036, P = 0.048; Unweighted UniFrac, Adonis, R2 = 0.040, P = 0.003, with small explained variance) [Figure 3]. According to the component 1 (COMP1) and component 2 (COMP2) scores, which accounted for 4.77% and 2.76%, respectively, PLS-DA analysis could discriminate the AN samples from the HC samples, which indicated the composition of gut microbiota in HC and patients with AN could be clustered separately [Figure 4].
Figure 3.
PCoA of HC and AN groups on OTU level. The percentages in the titles of axes represent the interpretation of the data, and the axes have no actual meaning. (A) Weighted UniFrac Distance. (B) Unweighted UniFrac Distance. Different color dots symbolize samples in different groups. X-axis and Y-axis represent PC1 and PC2, respectively. The elliptical region is the 95% confidence region. AN: Anorexia nervosa; HC: Healthy controls; OTU: Operational taxonomic unit; PC1: Principal component 1; PC2: Principal component 2; PCoA: Principal coordinates analysis.
Figure 4.
PLS-DA of HC and AN groups on OTU level. Different color dots symbolize samples in different groups. X-axis and Y-axis respectively represent the possible influencing factor 1 (COMP1) and 2 (COMP2) for the deviation of bacterial composition of the two groups. The percentages in the titles of axes represent the interpretation of the data. The elliptical region is the 95% confidence region. AN: Anorexia nervosa; COMP: Component; HC: Healthy controls; OTU: Operational taxonomic unit; PLS-DA: Partial least squares discrimination analysis.
Community barplot and community difference analysis
We found that the dominant phyla of the two groups were identical, which included Firmicutes, Actinobacteriota, Bacteroidota, and Proteobacteria [Supplementary Figure 1A]. The other phyla encompassed Verrucomicrobiota, Desulfobacteria, Patesciobacteria, Fusobacteriota, Synergistota, Cyanobacteria, and unclassified phyla. Supplementary Figure 1B shows that different from Bacteroidota, the proportions of Firmicutes, Actinobacteriota, and Proteobacteria were lower in patients with AN, but without significant differences compared with HC group (P > 0.05).
On family level, we found that the abundance of Lachnospiraceae, Ruminococcaceae, Bifidobacteriaceae, Enterobacteriaceae, and Bacteroidaceae accounted for a large proportion both in HC and patients with AN. In patients with AN, the proportions of Lachnospiraceae, Bacteroidaceae, Enterobacteriaceae, Streptococcaceae, Coriobacteriaceae, and Rikenellaceae were higher than those of HC group and the proportions of Ruminococcaceae, Bifidobacteriaceae, Peptostreptococcaceae, Oscillospiraceae, and Burkholderiaceae were lower [Supplementary Figure 2A]. Specifically, the proportion of Lachnospiraceae in AN group was significantly higher (AN vs. HC, 40.50% vs. 31.21%, Z = −1.981, P = 0.048), while the proportion of Ruminococcaceae was significantly lower (AN vs. HC, 12.17% vs. 19.15%, Z = −2.728, P = 0.007) [Supplementary Figure 2B and 2C].
On genus level, patients with AN had higher proportions of Blautia, Bacteroides, Eubacterium_hallii_group, Escherichia-Shigella, Collinsella, Streptococcus, Romboutsia, Ruminococcus, and Anaerostipes, while their proportions of Bifidobacterium, Faecalibacterium, Subdoligranulum, Dorea, Agathobacter, and Fusicatenibacter were lower than those of HC [Supplementary Figure 3A]. Among them, the proportions of Faecalibacterium (AN vs. HC, 3.97% vs. 9.40%, Z = −3.638, P < 0.001) and Subdoligranulum (AN vs. HC, 4.60% vs. 7.02%, Z = −2.369, P = 0.018) in AN group were significantly lower, while the proportion of Eubacterium_hallii_group was significantly higher (AN vs. HC, 7.63% vs. 3.43%, Z = −2.115, P = 0.035) [Supplementary Figure 3B].
Taxonomic comparison analysis
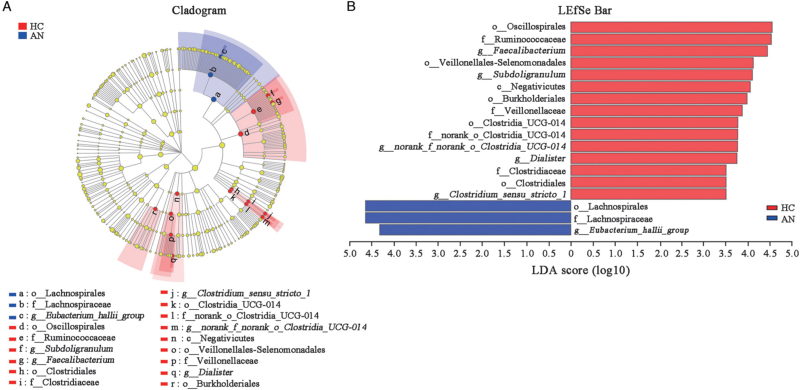
LEfSe analysis (LDA score >3.5) screened out the microbiota with significant differences between the two groups from phylum to genus levels and the number of enriched microbiota in HC was more than that in patients with AN [Figure 5A]. In HC, the main enriched taxa were o_Oscillospirales, f_Ruminococcaceae, g_Faecalibacterium (o, f and g represents order, family and genus, respectively), o_Veillonellales-Selenomonadales, g_Subdoligranulum, c_Negativicutes (c represents class), o_Burkholderiales, f_Veillonellaceae, o_Clostridia_UCG-014, f_norank_o_Clostridia_UCG-014, g_norank_f_norank_o_Clostridia_UCG-014, g_Dialister, f_Clostridiaceae, o_Clostridiales, and g_Clostridium_sensu_stricto_1, while the main enriched taxa were o_Lachnospirales, f_Lachnospiraceae, and g_Eubacterium_hallii_group in patients with AN [Figure 5B].
Figure 5.
LEfSe cladogram and bar of HC and AN groups. (A) LEfSe cladogram from phylum to genus levels of HC and AN groups. Different color nodes represent the microbiota that are significantly enriched in the corresponding group and have a great influence on the differences between the two groups. (B) The microbiota with significant differences between the two groups (LDA score >3.5). AN: Anorexia nervosa; c: Class; f: Family; g: Genus; HC: Healthy controls; LDA: Linear discriminant effect (LEfSe) analysis; LEfSe: Linear discriminant effect; o: Order.
Functional analysis of gut microbiota
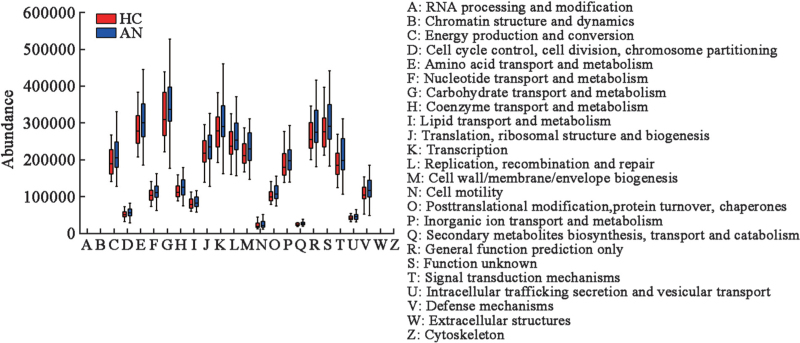
PICRUSt functional analysis is illustrated in Figure 6, and the major functional features of gut microbiota of the two groups include carbohydrate transport and metabolism, amino acid transport and metabolism, transcription and replication, as well as recombination and repair. Besides, we found that these functions in patients with AN were more abundant than those of HC, which indicated that the metabolic functions increased in patients with AN, but without significant differences (P > 0.05).
Figure 6.
The microbial functional analysis of HC and AN groups. The X-axis represents COG secondary function number and the Y-axis represents the abundance of functions. AN: Anorexia nervosa; COG: Cluster of Orthologous Groups; HC: Healthy controls.
Correlations between gut microbiota and clinical indicators
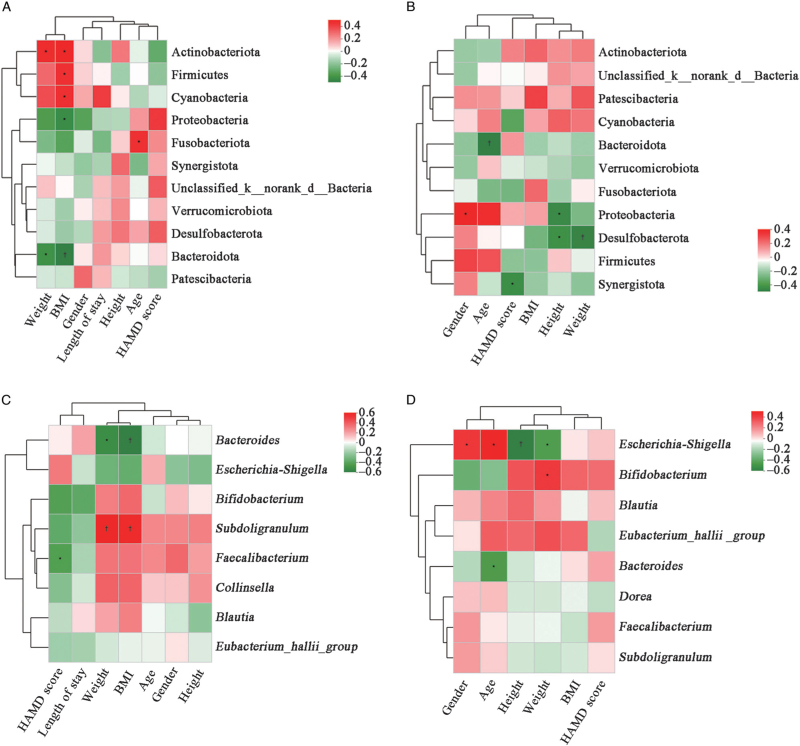
On phylum and genus levels, we found that clinical indicators were correlated with gut microbiota based on the Spearman correlation analysis. Heatmap in patients with AN mainly showed that, on phylum level, weight and BMI were significantly positively correlated with the abundance of Actinobacteriota (r = 0.384, P = 0.036; r = 0.412, P = 0.024, respectively), while significantly negatively correlated with the abundance of Bacteroidota (r = −0.403, P = 0.027; r = −0.469, P = 0.009, respectively). Higher BMI was significantly correlated with a higher abundance of Firmicutes (r = 0.368, P = 0.045) and lower abundance of Proteobacteria (r = −0.422, P = 0.020) [Figure 7A]. On phylum level in HC, we found that Bacteroidota had a slight correlation with body weight (r = −0.202, P > 0.05) and BMI (r = −0.199, P > 0.05); Firmicutes had a slight correlation with body weight (r = −0.085, P > 0.05) and BMI (r = −0.235, P > 0.05). The abundance of Proteobacteria was significantly negatively correlated with height (r = −0.462, P = 0.010), and Synergistota was significantly negatively correlated with HAMD score (r = −0.445, P = 0.014) [Figure 7B].
Figure 7.
Spearman correlation heatmaps were used to analyze the correlations between different gut microbiota and clinical indicators. (A) Correlations between microbiota and clinical data on phylum level in patients with AN. (B) Correlations between microbiota and clinical data on phylum level in HC. (C) Correlations between top eight microbiota and clinical data on genus level in patients with AN. (D) Correlations between top eight microbiota and clinical data on genus level in HC. The color bar represents the correlation coefficient (r). The red color represents positive correlation; the green color represents negative correlation. In addtion, a darker color indicates a stronger correlations. The values represent the magnitude of the correlation coefficient. ∗P < 0.05. †P < 0.01. AN: Anorexia nervosa; BMI: Body mass index; d: Domain; HAMD: Hamilton Depression Scale; HC: Healthy controls; k: Kingdom.
On genus level in patients with AN, weight and BMI were significantly negatively correlated with the abundance of Bacteroides (r = −0.444, P = 0.014; r = −0.503, P = 0.005, respectively), while significantly positively correlated with the abundance of Subdoligranulum (r = 0.510, P = 0.004; r = 0.495, P = 0.005, respectively). The abundance of Faecalibacterium was significantly negatively correlated with HAMD scores (r = −0.367, P = 0.046) [Figure 7C]. In HC, Bacteroides was significantly negatively correlated with age (r = −0.427, P = 0.019). Bifidobacterium was significantly positively correlated with weight (r = 0.383, P = 0.037). Escherichia-Shigella was significantly positively correlated with age (r = 0.462, P = 0.010), while negatively correlated with height and weight (r = −0.547, P = 0.002; r = −0.419, P = 0.021, respectively). However, there were no obvious correlations between HAMD scores and Faecalibacterium in HC [Figure 7D], and from Figure 7 we did not find significant correlations between length of stay and these microbiota.
Discussion
The purpose of this study was to explore the features of gut microbiota in patients with AN by making a comparison with that of healthy controls, so as to examine alpha and beta diversities, community composition, and difference analysis on different taxonomic levels between the two groups. Meanwhile, we also explored the functions of gut microbiota and relationships between microbiota and clinical indicators in the two groups. The main findings of our study are as follows: In our study, patients with AN indeed displayed significant difference in gut microbiota compared to HC on various levels. Patients with AN showed slight richness and diversity decrease in gut microbiota and the two groups differed obviously in community composition. Functions of nutrient transport and metabolism in the AN group were more abundant. Furthermore, positive or negative correlations between gut microbiota and clinical indicators were also observed. In short, the results indicated that the gut microbiota altered in patients with AN compared to HC.
Many studies showed that the diversity and composition of gut microbiota in patients with AN differed from those of healthy people, and the results of different studies were also heterogeneous. Mack et al[15] found that the abundance of Firmicutes and Actinobacteria in patients with AN increased, while the abundance of Bacteroidota reduced compared with those of normal-weight people. Morita et al[16] found that the abundance of Streptococcus, Clostridium, and Bacteroides was at a low level, and the concentration of SCFAs in stool, such as acetic acid and propionic acid, were also lower in patients with AN. An Italian research showed that compared with the results of normal controls, the abundance of Enterobacteriaceae and Methanobrevibacter smithii in patients with AN were significantly increased, while that of Roseburia, Ruminococcus, and Clostridium was on the decrease.[17] In addition, Mörkl et al[18] studied the gut microbiota in people with various BMI, including patients with AN, athletes, normal-weight, overweight, and obese women, and the results turned out that the alpha diversity of gut microbiota in patients with AN and obese women was lower. Similarly, in a study performed by Schulz et al[19], they found that weight recovery was helpful for the restoration of gut microbiota diversity in patients with AN. To sum up, these studies indicated that alterations of gut microbiota did exist in patients with AN, which suggested that the occurrence of AN may be related to the alteration of gut microbiota.
Firmicutes and Bacteroidota, two predominant phyla in the human gut, are considered to be associated with human weight. Our findings showed that compared with HC, the weight and BMI of patients with AN were significantly decreased, and the abundance of Firmicutes decreased and Bacteroidota increased in patients with AN, but without statistical differences. Interestingly, in patients with AN, there was a significantly negative correlation between the abundance of Bacteroidota and weight and BMI, while Firmicutes was positively correlated with BMI. Similar to our results, Armougom et al[20] observed that the anorexic bacterial profile of Firmicutes and Bacteroidota was similar to that of the normal weight group. Borgo et al[17] found that the abundance of Firmicutes was significantly lower in patients with AN; while in another study, the abundance of Firmicutes was significantly higher and that of Bacteroidota was lower in patients with AN compared to normal-weight participants, moreover, Bacteroidota significantly decreased and Firmicutes significantly increased after patients with AN gained weight.[15] Koliada et al[21] also found that the content of Firmicutes gradually increased while Bacteroidota decreased with the increase of BMI and the Firmicutes/Bacteroidota ratio also raised with the increase of BMI. A possible explanation was that Firmicutes was more efficient in energy utilization than Bacteroidota, therefore it can promote more calorie absorption and weight gaining. Therefore, we speculated that increasing the abundance of Firmicutes in the gut of patients with AN may improve their condition to a certain extent. Moreover, a higher abundance of energy and nutrient metabolism function were enriched in AN patients in our study, which implied that they may need more energy-efficient microbiota to maintain basic life. Firmicutes and Bacteroidota have been extensively studied in the obese population, while the inconclusive results in patients with AN need further verification in the future.
Lachnospiraceae, the core family in gut microbiota, belongs to the Firmicutes, and its abundance is influenced by age and dietary composition.[22,23]Blautia, Dorea, Coprococcus, Lachnospira, and Roseburia are the main genera of Lachnospiraceae. These genera are anaerobic and some of them have a strong hydrolysis function. Starch and other sugars are used as hydrolysis substrates by Lachnospiraceae to produce butyric acid and other SCFAs which can provide energy for the colonic mucosa and maintain the integrity of the intestinal barrier to improve intestinal health.[24,25] In our study, the proportion of Lachnospiraceae was significantly higher in patients with AN than that in HC; thus, we speculated that the increase of Lachnospiraceae in patients with AN may help to ameliorate energy utilization, which may be a protective mechanism for patients with AN. Beyond that, SCFAs can improve the host's histone epigenetic states and decrease levels of inflammatory markers.[26] A meta-analysis showed that the pro-inflammatory cytokines like tumor necrosis factor (TNF)-α and interleukin (IL)-6 are elevated in patients with eating disorders,[27] thus the increase of SCFAs in patients with AN may help to decrease the inflammation, but we need more studies to verify this viewpoint. Chávez-Carbajal et al[28] observed an obvious increase in the members of Lachnospiraceae in obesity plus women with metabolic syndrome, indicating that Lachnospiraceae may correlate with metabolic disturbance. As mentioned above, disturbance of gut microbiota in patients with AN is associated with anxiety and depression, and a study showed that different taxa of Lachnospiraceae (such as Blautia, Anaerostipes, and Lachnospiraceae incertae sedis) were observed higher in major depressive disorder (MDD).[29] In our study, the relative abundance of Blautia and Anaerostipes indeed increased in patients with AN but with no significant differences, and the depression was not observed in patients, which may relate to the severity of AN and individual discrepancy to some extent.
The genus Alistipes prevalent in the human gut is associated with anxiety and depression symptoms because of the decrease in serotonin availability.[30] A systematic review found the abundance of Alistipes in patients with AN was higher than that of healthy people, indicating a relationship between Alistipes and depression and anxiety.[10] In our study, the abundance of Alistipes in patients with AN was higher than that in HC (P > 0.05), but depression was not found in patients with AN. The reason why the above results showed no significant differences may be due to the small sample size or individual differences and further studies are required in the future. Faecalibacterium is one of the most common bacteria in the gut microbiota of healthy adults and its abundance is associated with a diet that is rich in plant-based foods and butyrate.[31,32] Schulz et al[19] found that in patients with AN, the abundance of Faecalibacterium at admission was lower than that of healthy people. With the weight gain and improvement of AN, Faecalibacterium increased significantly when patients were discharged.[19] Our data showed that the abundance of Faecalibacterium was significantly lower in patients with AN and was significantly negatively correlated with their HAMD scores. We speculated that the lower the abundance of Faecalibacterium, the more severe inflammation in patients with AN, and these patients are more likely to develop depression. Faecalibacterium was observed lower in MDD[27] and we did not find such a correlation in healthy people, which indicated that Faecalibacterium may be associated with the emotion of patients with AN.
Limitations of this study need to be taken into account when analyzing the results. Firstly, we cannot reach conclusions on a causal link between alterations of gut microbiota and AN because of the cross-sectional study and this problem may be addressed by using mice with AN models. Secondly, admitted patients with AN tend to have severe malnutrition symptoms, while the change of gut microbiota in outpatients with mild symptoms was not involved in this study, thus it is unknown whether the change is the same as that of inpatients. Therefore, in future studies, the scope and sample size should be further expanded. Thirdly, no further metagenomic analysis was performed.
In conclusion, in comparison to healthy controls, the gut microbiota in patients with AN clearly altered in composition, which provides more information for the pathogenesis, diagnosis, and treatment of AN and new orientations for the study of gut microbiota in patients with AN. However, the causality between gut microbiota and AN remains unclear, thus larger-scale studies are needed in the future.
Funding
The study was funded by the Cross Seed Fund of Peking University (No. A74479-01).
Conflicts of interest
None.
Supplementary Material
Footnotes
How to cite this article: Yuan R, Yang L, Yao G, Geng S, Ge Q, Bo S, Li X. Features of gut microbiota in patients with anorexia nervosa. Chin Med J 2022;135:1993–2002. doi: 10.1097/CM9.0000000000002362
Runxue Yuan and Lei Yang contributed equally to this work.
Supplemental digital content is available for this article.
References
- 1.Treasure J, Duarte TA, Schmidt U. Eating disorders. Lancet 2020; 395:899–911. doi: 10.1016/S0140-6736(20)30059-3. [DOI] [PubMed] [Google Scholar]
- 2.Galmiche M, Déchelotte P, Lambert G, Tavolacci MP. Prevalence of eating disorders over the 2000-2018 period: a systematic literature review. Am J Clin Nutr 2019; 109:1402–1413. doi: 10.1093/ajcn/nqy342. [DOI] [PubMed] [Google Scholar]
- 3.Breton J, Déchelotte P, Ribet D. Intestinal microbiota and anorexia nervosa. Clin Nutr Exp 2019; 28:11–21. doi: 10.1016/j.yclnex.2019.05.001. [Google Scholar]
- 4.Roubalová R, Procházková P, Papežová H, Smitka K, Bilej M, Tlaskalová-Hogenová H. Anorexia nervosa: gut microbiota-immune-brain interactions. Clin Nutr 2020; 39:676–684. doi: 10.1016/j.clnu.2019.03.023. [DOI] [PubMed] [Google Scholar]
- 5.Stilling RM, van de Wouw M, Clarke G, Stanton C, Dinan TG, Cryan JF. The neuropharmacology of butyrate: the bread and butter of the microbiota-gut-brain axis? Neurochem Int 2016; 99:110–132. doi: 10.1016/j.neuint.2016.06.011. [DOI] [PubMed] [Google Scholar]
- 6.Kühnen P, Krude H, Biebermann H. Melanocortin-4 receptor signalling: importance for weight regulation and obesity treatment. Trends Mol Med 2019; 25:136–148. doi: 10.1016/j.molmed.2018.12.002. [DOI] [PubMed] [Google Scholar]
- 7.Arnoriaga-Rodríguez M, Mayneris-Perxachs J, Burokas A, Pérez-Brocal V, Moya A, Portero-Otin M, et al. Gut bacterial ClpB-like gene function is associated with decreased body weight and a characteristic microbiota profile. Microbiome 2020; 8:59–68. doi: 10.1186/s40168-020-00837-6. [DOI] [PMC free article] [PubMed] [Google Scholar]
- 8.Bou Khalil R, Souaiby L, Farès N. The importance of the hypothalamo-pituitary-adrenal axis as a therapeutic target in anorexia nervosa. Physiol Behav 2017; 171:13–20. doi: 10.1016/j.physbeh.2016.12.035. [DOI] [PubMed] [Google Scholar]
- 9.Mack I, Penders J, Cook J, Dugmore J, Mazurak N, Enck P. Is the impact of starvation on the gut microbiota specific or unspecific to anorexia nervosa? A narrative review based on a systematic literature search. Curr Neuropharmacol 2018; 16:1131–1149. doi: 10.2174/1570159X16666180118101354. [DOI] [PMC free article] [PubMed] [Google Scholar]
- 10.Di Lodovico L, Mondot S, Doré J, Mack I, Hanachi M, Gorwood P. Anorexia nervosa and gut microbiota: a systematic review and quantitative synthesis of pooled microbiological data. Prog Neuropsychopharmacol Biol Psychiatry 2021; 106:110114.doi: 10.1016/j.pnpbp.2020.110114. [DOI] [PubMed] [Google Scholar]
- 11.Chen SF, Zhou YQ, Chen YR, Gu J. fastp: an ultra-fast all-in-one FASTQ preprocessor. Bioinformatics 2018; 34:i884–i890. doi: 10.1093/bioinformatics/bty560. [DOI] [PMC free article] [PubMed] [Google Scholar]
- 12.Magoč T, Salzberg SL. FLASH: fast length adjustment of short reads to improve genome assemblies. Bioinformatics 2011; 27:2957–2963. doi: 10.1093/bioinformatics/btr507. [DOI] [PMC free article] [PubMed] [Google Scholar]
- 13.Edgar RC. UPARSE: highly accurate OTU sequences from microbial amplicon reads. Nat Methods 2013; 10:996–998. doi: 10.1038/nmeth.2604. [DOI] [PubMed] [Google Scholar]
- 14.Stackebrandt E, Goebel BM. Taxonomic note: a place for DNA-DNA reassociation and 16S rRNA sequence analysis in the present species definition in bacteriology. Int J Syst Bacteriol 1994; 44:846–849. doi:10.1099/00207713-44-4-846. [Google Scholar]
- 15.Mack I, Cuntz U, Grämer C, Niedermaier S, Pohl C, Schwiertz A, et al. Weight gain in anorexia nervosa does not ameliorate the faecal microbiota, branched chain fatty acid profiles, and gastrointestinal complaints. Sci Rep 2016; 6:26752–26767. doi: 10.1038/srep26752. [DOI] [PMC free article] [PubMed] [Google Scholar]
- 16.Morita C, Tsuji H, Hata T, Gondo M, Takakura S, Kawai K, et al. Gut dysbiosis in patients with anorexia nervosa. PLoS One 2015; 10:e0145274.doi: 10.1371/journal.pone.0145274. [DOI] [PMC free article] [PubMed] [Google Scholar]
- 17.Borgo F, Riva A, Benetti A, Casiraghi MC, Bertelli S, Garbossa S, et al. Microbiota in anorexia nervosa: the triangle between bacterial species, metabolites and psychological tests. PLoS One 2017; 12:e0179739.doi: 10.1371/journal.pone.0179739. [DOI] [PMC free article] [PubMed] [Google Scholar]
- 18.Mörkl S, Lackner S, Müller W, Gorkiewicz G, Kashofer K, Oberascher A, et al. Gut microbiota and body composition in anorexia nervosa inpatients in comparison to athletes, overweight, obese, and normal weight controls. Int J Eat Disord 2017; 50:1421–1431. doi: 10.1002/eat.22801. [DOI] [PubMed] [Google Scholar]
- 19.Schulz N, Belheouane M, Dahmen B, Ruan VA, Specht HE, Dempfle A, et al. Gut microbiota alteration in adolescent anorexia nervosa does not normalize with short-term weight restoration. Int J Eat Disord 2021; 54:969–980. doi: 10.1002/eat.23435. [DOI] [PubMed] [Google Scholar]
- 20.Armougom F, Henry M, Vialettes B, Raccah D, Raoult D. Monitoring bacterial community of human gut microbiota reveals an increase in Lactobacillus in obese patients and methanogens in anorexic patients. PLoS One 2009; 4:e7125.doi: 10.1371/journal.pone.0007125. [DOI] [PMC free article] [PubMed] [Google Scholar]
- 21.Koliada A, Syzenko G, Moseiko V, Budovska L, Puchkov K, Perederiy V, et al. Association between body mass index and Firmicutes/Bacteroidota ratio in an adult Ukrainian population. BMC Microbiol 2017; 17:120–125. doi: 10.1186/s12866-017-1027-1. [DOI] [PMC free article] [PubMed] [Google Scholar]
- 22.Odamaki T, Kato K, Sugahara H, Hashikura N, Takahashi S, Xiao JZ, et al. Age-related changes in gut microbiota composition from newborn to centenarian: a cross-sectional study. BMC Microbiol 2016; 16:90–101. doi: 10.1186/s12866-016-0708-5. [DOI] [PMC free article] [PubMed] [Google Scholar]
- 23.Kim E, Kim DB, Park JY. Changes of mouse gut microbiota diversity and composition by modulating dietary protein and carbohydrate contents: a pilot study. Prev Nutr Food Sci 2016; 21:57–61. doi: 10.3746/pnf.2016.21.1.57. [DOI] [PMC free article] [PubMed] [Google Scholar]
- 24.Vacca M, Celano G, Calabrese FM, Portincasa P, Gobbetti M, De Angelis M. The controversial role of human gut Lachnospiraceae. Microorganisms 2020; 8:573–597. doi: 10.3390/microorganisms8040573. [DOI] [PMC free article] [PubMed] [Google Scholar]
- 25.Mason BL. Feeding systems and the gut microbiome: gut-brain interactions with relevance to psychiatric conditions. Psychosomatics 2017; 58:574–580. doi: 10.1016/j.psym.2017.06.002. [DOI] [PubMed] [Google Scholar]
- 26.Kasahara K, Krautkramer KA, Org E, Romano KA, Kerby RL, Vivas EI, et al. Interactions between Roseburia intestinalis and diet modulate atherogenesis in a murine model. Nat Microbiol 2018; 3:1461–1471. doi: 10.1038/s41564-018-0272-x. [DOI] [PMC free article] [PubMed] [Google Scholar]
- 27.Dalton B, Bartholdy S, Robinson L, Solmi M, Ibrahim MAA, Breen G, et al. A meta-analysis of cytokine concentrations in eating disorders. J Psychiatr Res 2018; 103:252–264. doi: 10.1016/j.jpsychires.2018.06.002. [DOI] [PubMed] [Google Scholar]
- 28.Chávez-Carbajal A, Nirmalkar K, Pérez-Lizaur A, Hernández-Quiroz F, Ramírez-Del-Alto S, García-Mena J, et al. Gut microbiota and predicted metabolic pathways in a sample of Mexican women affected by obesity and obesity plus metabolic syndrome. Int J Mol Sci 2019; 20:438–455. doi: 10.3390/ijms20020438. [DOI] [PMC free article] [PubMed] [Google Scholar]
- 29.Cheung SG, Goldenthal AR, Uhlemann AC, Mann JJ, Miller JM, Sublette ME. Systematic review of gut microbiota and major depression. Front Psychiatry 2019; 10:34–50. doi: 10.3389/fpsyt.2019.00034. [DOI] [PMC free article] [PubMed] [Google Scholar]
- 30.Parker BJ, Wearsch PA, Veloo ACM, Rodriguez-Palacios A. The genus Alistipes: gut bacteria with emerging implications to inflammation, cancer, and mental health. Front Immunol 2020; 11:906–920. doi: 10.3389/fimmu.2020.00906. [DOI] [PMC free article] [PubMed] [Google Scholar]
- 31.Zhou LX, Zhang MM, Wang YM, Dorfman RG, Liu H, Yu T, et al. Faecalibacterium prausnitzii produces butyrate to maintain Th17/Treg balance and to ameliorate colorectal colitis by inhibiting histone deacetylase 1. Inflamm Bowel Dis 2018; 24:1926–1940. doi: 10.1093/ibd/izy182. [DOI] [PubMed] [Google Scholar]
- 32.Verhoog S, Taneri PE, Roa Díaz ZM, Marques-Vidal P, Troup JP, Bally L, et al. Dietary factors and modulation of bacteria strains of Akkermansia muciniphila and Faecalibacterium prausnitzii: a systematic review. Nutrients 2019; 11:1565.doi: 10.3390/nu11071565. [DOI] [PMC free article] [PubMed] [Google Scholar]
Associated Data
This section collects any data citations, data availability statements, or supplementary materials included in this article.


