

Abstract
While correction of dysplastic acetabular deformity has been a focus of both clinical treatment and research, concurrent femoral deformities have only more recently received serious attention. The purpose of this study was to determine how including abnormalities in femoral head-neck offset and femoral version alter computationally derived contact stresses in patients with combined dysplasia and femoroacetabular impingement (FAI). Hip models with patient-specific bony anatomy were created from preoperative and postoperative CT scans of 20 hips treated with periacetabular osteotomy and femoral osteochondroplasty. To simulate performing only a PAO, a third model was created combining each patient’s postoperative pelvis and preoperative femur geometry. These three models were initialized with the femur in two starting orientations: (1) standardized template orientation, and (2) using patient-specific anatomic landmarks. Hip contact stresses were computed in all 6 model sets during an average dysplastic gait cycle, an average FAI gait cycle, and an average stand-to-sit activity using discrete element analysis. No significant differences in peak contact stress (p=0.190 to 1), mean contact stress (p=0.273 to 1), or mean contact area (p=0.050 to 1) were identified during any loading activity based on femoral alignment technique or inclusion of femoral osteochondroplasty. These findings suggest that presence of abnormal femoral version and/or head-neck offset deformities are not themselves predominant factors in intra-articular contact mechanics during gait and stand-to-sit activities. Inclusion of modified movement patterns caused by these femoral deformities may be necessary for models to adequately capture the mechanical effects of these clinically recognized risk factors for negative outcomes.
Keywords: Discrete Element Analysis, Contact Stress, Hip Dysplasia, Periacetabular Osteotomy, Femoroacetabular Impingement
INTRODUCTION
Standard treatment for symptomatic hip dysplasia in adolescents and young adults is acetabular reorientation using the Bernese periacetabular osteotomy (PAO). While PAO has demonstrated good clinical results (Wells et al., 2018), altered intra-articular mechanics in hip dysplasia patients remain of interest due to the strong association with future osteoarthritic joint degeneration (Chegini et al., 2009; Hadley et al., 1990; Mavcic et al., 2008; Maxian et al., 1995). Computational modeling techniques such as finite element analysis (FEA) and discrete element analysis (DEA) can provide non-invasive joint contact stress information and have been used to compare differences between normal and dysplastic hips (Goetz et al., 2021; Henak et al., 2014) and the effects of treating dysplasia with PAO (Abraham et al., 2017; Armand et al., 2009; Armiger et al., 2009; Goetz et al., 2021; Thomas-Aitken et al., 2019; Zou et al., 2013).
However, acetabular dysplasia is often accompanied by femoral deformities, including decreased head-neck offset and abnormal femoral version. Left unaddressed, these features decrease PAO survivorship due to the creation of femoroacetabular impingement (Albers et al., 2013; Fabricant et al., 2015; Goronzy et al., 2017; Kelly et al., 2012; Wells et al., 2018; Ziebarth et al., 2011). As distal femur anatomy has only recently begun to be regularly included in CT scans of hip dysplasia patients, most previous computational modeling studies of hip dysplasia use models that assume standardized femoral version based on proximal femur geometry, precluding them from considering femoral version deformities. And while one recent computational modeling study has suggested that unaddressed femoral head-neck offset deformity is associated with adverse joint contact stress after PAO (Scott et al., 2018), the effects of modeling femoral version and modeling correction of head-neck offset deformity on computed intra-articular contact stress before and after PAO remains unclear.
The purpose of this study was to evaluate the effects of including femoral version and head-neck offset deformity correction on computationally derived joint contact stress patterns in patients treated with PAO and femoral osteochondroplasty. Our hypotheses were that inclusion of patient-specific femoral version would result in elevated intra-articular contact stress, particularly for patients with head-neck offset abnormalities, and addition of femoral osteochondroplasty at the time of PAO would reduce intra-articular contact stress.
METHODS
With Institutional Review Board approval, 15 patients (20 hips) who underwent treatment of symptomatic acetabular dysplasia and head-neck offset deformity were retrospectively identified. Inclusion criteria were PAO followed by head-neck osteochondroplasty (OCP) via anterior arthrotomy, plus availability of preoperative and postoperative CT scans that included axial sections through the knee to evaluate femoral version. All hips had a Tönnis classified arthritis grade of 0 or 1 prior to surgery. Preoperative radiographic assessment of acetabular and femoral deformity was performed for all patients by a board-certified hip preservation surgeon (Table 1). Indication for OCP was less than 20 degrees of internal femur rotation at 90 degrees of flexion intraoperatively after PAO. Postoperative CT scans were obtained a median of 9.8 months (IQR: 4.1-12.0 months) following surgery.
Table 1.
Preoperative radiographic evaluation of hip dysplasia and femoral deformity in all 20 patients.
| Lateral Center Edge Angle (degrees) | Anterior Center Edge Angle (degrees) | Acetabular Inclination (degrees) | Femoral Version (degrees) | AP Alpha Angle (degrees) | Frog Lateral Alpha Angle (degrees) | Dunn Alpha Angle (degrees) | |
|---|---|---|---|---|---|---|---|
|
| |||||||
| 1 | 26 | 16 | 3 | −2 | 40 | 54 | 71 |
|
| |||||||
| 2 | 14 | 18 | 11 | 1 | 42 | 49 | 44 |
|
| |||||||
| 3 | 15 | 15 | 14 | 9 | 75 | 56 | 81 |
|
| |||||||
| 4 | 23 | 16 | 9 | 10 | 69 | 56 | 73 |
|
| |||||||
| 5 | 14 | 24 | 12 | 9 | 50 | 36 | 71 |
|
| |||||||
| 6 | 12 | 16 | 18 | 11 | 44 | 46 | 46 |
|
| |||||||
| 7 | 19 | 25 | 11 | 1 | 39 | 54 | 56 |
|
| |||||||
| 8 | 21 | 29 | 19 | 19 | 44 | - | 70 |
|
| |||||||
| 9 | 17 | - | 15 | 9 | 44 | - | 69 |
|
| |||||||
| 10 | 17 | 30 | 10 | 16 | 44 | 46 | 52 |
|
| |||||||
| 11 | 23 | 24 | 12 | −1 | 96 | 47 | 51 |
|
| |||||||
| 12 | 22 | 13 | 17 | 3 | 94 | 43 | 54 |
|
| |||||||
| 13 | 14 | 14 | 19 | 7 | 40 | 37 | 56 |
|
| |||||||
| 14 | 20 | 29 | 13 | 8 | 42 | 52 | 57 |
|
| |||||||
| 15 | 14 | 9 | 18 | 4 | 42 | 67 | 60 |
|
| |||||||
| 16 | 14 | 24 | 8 | 2 | 39 | 43 | 40 |
|
| |||||||
| 17 | 23 | 20 | 12 | 4 | 42 | 51 | 68 |
|
| |||||||
| 18 | 16 | 17 | 17 | 11 | 49 | 56 | 59 |
|
| |||||||
| 19 | 12 | 9 | 17 | 6 | 93 | 50 | 57 |
|
| |||||||
| 20 | 15 | 7 | 16 | 12 | 38 | 63 | 53 |
|
| |||||||
| Median | 16 | 17 | 14 | 7 | 44 | 50 | 57 |
| IQR | 14-21 | 15-24 | 11-17 | 3-10 | 41-55 | 46-55 | 53-69 |
Hip models were created for each patient from their preoperative and postoperative CT scans using a semi-automated process to segment the pelvic and femoral bony geometry (Thomas-Aitken et al., 2019; Thomas et al., 2011). Articular cartilage was approximated in the models by first projecting the subchondral bone surfaces into the joint space, and then using a custom algorithm to smooth these projected surfaces (Aitken et al., 2022) into the continuous, non-spherical, non-uniform thickness cartilage surfaces crucial for obtaining accurate contact stress calculations (Anderson et al., 2010).
Template-Based Models – Generic Femoral Version
For DEA modeling, each pelvis model was oriented in a standardized pelvic coordinate frame defined according to patient-specific anatomic locations of the anterior superior iliac spines and the midpoint of the posterior superior iliac spines (Wu et al., 2002). Previous computational studies using clinical CT scans did not have full femoral geometry. Therefore, to align the femur models in the absence of full femoral geometry, the proximal portion of each patient-specific femur model was aligned to a template femur model (Figure 1) using an iterative closest-point algorithm in Geomagic Design X (3D Systems, Inc, Rock Hill, SC, USA). The template femur consisted of a full-length femur model with nominally normal femoral version (Jiang et al., 2015) which had been aligned in an anatomic femoral coordinate frame by defining the medial and lateral femoral epicondyles and the center of a sphere fit to the femoral head (Wu et al., 2002) (Figure 1). Alignment to this template effectively standardized femoral version between patient models.
Figure 1.
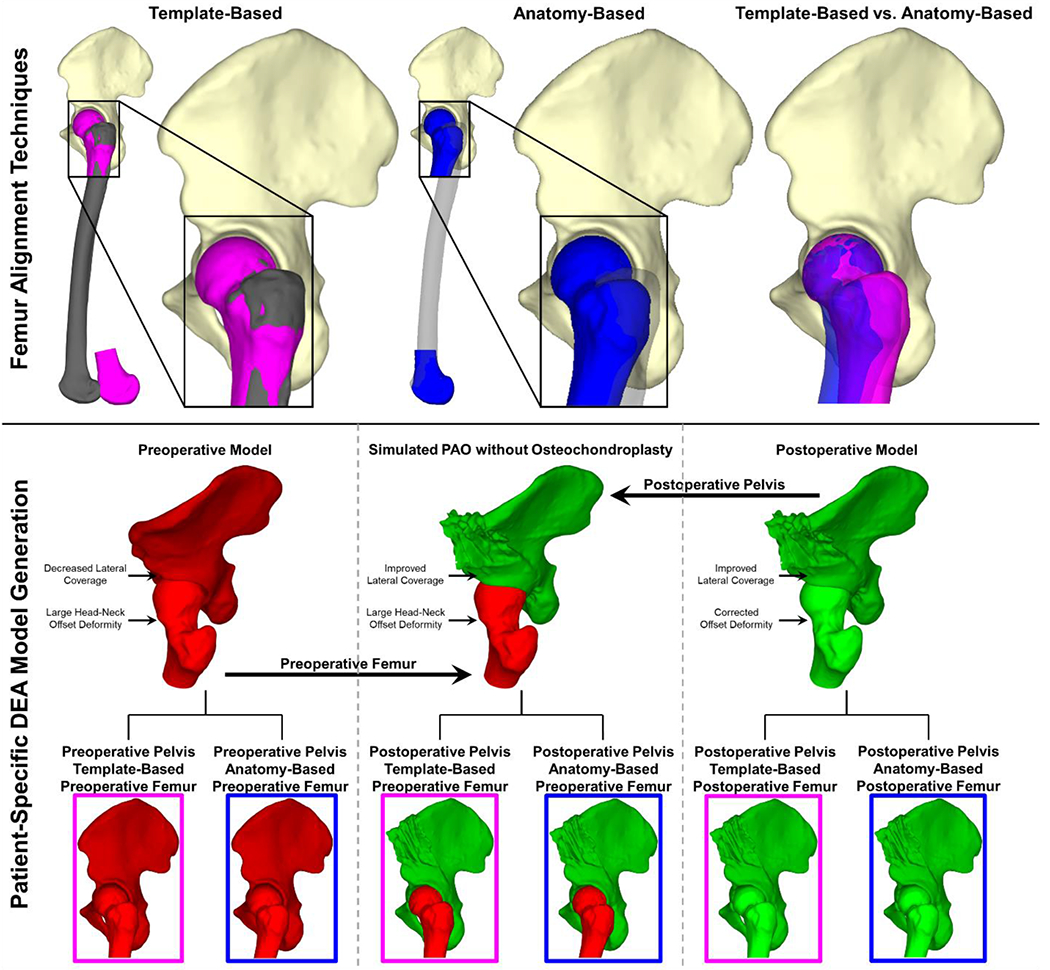
Femoral alignment processes and DEA model generation. (Top left) The patient-specific proximal femur geometry (pink) was aligned to a previously aligned template femur (grey), as is done in the absence of full femoral geometry. (Top center) The same patient-specific femur (now blue) was aligned to the femoral coordinate system according to its own bony anatomic landmarks, resulting in a more realistic alignment of the full femoral geometry. (Top right) Comparison of the same femur model aligned using the template-based (pink) and the anatomy-based (blue) alignment processes. (Center) For each patient, two DEA models were created from their preoperative (red) and postoperative (green) hip geometry. A third model simulating performing a PAO without osteochondroplasty was then created by combining the preoperative femur (red) geometry with the postoperative pelvis (green) geometry. (Bottom) For each preoperative, postoperative, and simulated PAO without osteochondroplasty model, the patient-specific femur was aligned using both the template-based (pink box) and anatomy-based (blue box) alignment techniques, resulting in a total of six DEA models per patient.
Anatomy-Based Models – Patient-Specific Femoral Version
Patients in this cohort had CT scans that included both proximal and distal portions of the femur, which enabled creation of a second set of models that incorporated each patient’s own femoral anatomy in the alignment process. Using the same anatomic landmark-based approach that had been used to define the template femur coordinate system, each patient’s femur model was aligned to a femoral coordinate system using its own medial and lateral femoral epicondyles and femoral head center (Wu et al., 2002). The resulting femoral orientation was unique to each patient’s bony anatomy and distinct from the template alignment (Figure 1). Pelvis alignment was identical to the template-based models.
Simulated PAO without Osteochondroplasty Models
Finally, to isolate the effects of performing a femoral OCP at the time of PAO on computed contact mechanics, a third series of DEA models was created by combining the postoperative pelvis (after the PAO) and the preoperative femur (which still included any head-neck offset deformity) (Figure 1). These simulated models represented each patient’s hip if only the PAO had been performed and were created for both femoral alignment techniques.
Discrete Element Analysis (DEA)
Hip joint contact stresses were computed for all models using DEA, a rapidly-executing computational modeling technique which permits contact stress to be inferred from the deformation of a compressible substrate (cartilage) between two rigid bodies (bones) under load (Abraham et al., 2013; Chao et al., 2010; Volokh et al., 2007). Each set of models was subjected to three different loading scenarios: (1) inputs derived from gait analysis and musculoskeletal modeling of walking in a series of patients with hip dysplasia (Harris et al., 2017), (2) inputs derived from motion capture and musculoskeletal modeling of walking in patients with symptomatic cam femoroacetabular impingement (FAI) (Ng et al., 2018), and (3) inputs measured during a stand-to-sit task in a series of patients with instrumented total hips (Bergmann et al., 2001). For each loading scenario, patient bodyweight-scaled joint reaction forces and hip rotation angles were discretized into 13 quasi-static increments, and hip contact stress was computed at each increment. Cartilage was assigned isotropic, linear-elastic material properties (E = 8 MPa, ν = 0.42) (Townsend et al., 2018), and DEA calculations were performed utilizing a custom Newton’s method solver previously developed in MATLAB (Kern and Anderson, 2015).
Data Analysis
To investigate differences in computed mechanics due to femoral alignment technique, two-sided Wilcoxon rank-sum tests (SAS 9.4, SAS Institute Inc, Cary, NC, USA) were used to compare differences in computed peak contact stress, mean contact stress, and mean contact area between template-based and anatomy-based femoral alignment models for each loading condition (dysplastic gait, FAI gait, stand-to-sit task) in each operative state (preoperative, postoperative, simulated PAO without OCP). Next, to better understand the effect of surgery on the computed intra-articular contact mechanics, differences in peak contact stress, mean contact stress, and mean contact area between preoperative, postoperative, and simulated PAO without OCP models were reanalyzed using two-sided Wilcoxon rank-sum tests with a Holm-Bonferroni correction for multiple comparisons to compare between operative states for each loading condition (dysplastic gait, FAI gait, stand-to-sit task) and each femoral alignment technique (template-based and anatomy-based). All data are presented as medians with interquartile range (IQR), and statistical significance was set at p ≤ 0.05.
RESULTS
Across all simulated joint loading activities, median within-patient differences in computed peak contact stress, mean contact stress, and mean contact area as a result of template-based versus anatomy-based femoral version models ranged from 0.9 to 1.8 MPa, 0.1 MPa, and 8 to 18 mm2, respectively (Table 2). When comparing template-based versus anatomy-based femoral version models, there were no significant differences in peak contact stress for models simulating dysplastic gait (preoperative: p = 0.974; postoperative: p = 0.847; simulated PAO without OCP: p = 0.826), FAI gait (preoperative: p = 0.931; postoperative: p = 0.784; simulated PAO without OCP: p = 0.723), or stand-to-sit (preoperative: p = 0.645; postoperative: p = 0.516; simulated PAO without OCP: p = 0.551) (Table 3, Figure 2). Similarly, there were no significant differences in mean contact stress computed using the different femoral alignment techniques for the preoperative/postoperative/simulated PAO-only models (dysplastic gait: p = 0.952/0.995/0.995; FAI gait: p = 0.910/0.826/0.805; stand-to-sit: p = 0.743/0.784/0.764). Mean contact area computed using the different femoral alignment techniques was also not significantly different (p > 0.86 for all comparisons) for preoperative, postoperative, or simulated PAO without OCP when modeling dysplastic gait, FAI gait, or stand-to-sit (Table 3, Figure 2).
Table 2.
Within patient differences in peak contact stress, mean contact stress, and mean contact area between template-based and anatomy-based femoral alignment models. Data are presented as median (IQR).
| Peak Contact Stress (MPa) | Mean Contact Stress (MPa) | Mean Contact Area (mm2) | ||
|---|---|---|---|---|
|
| ||||
| Preoperative | Dysplastic Walking Gait | 1.3 (0.7-2.0) | 0.1 (0.0-0.2) | 10 (4-14) |
|
| ||||
| FAI Walking Gait | 1.2 (1.0-2.0) | 0.1 (0.1-0.2) | 8 (5-12) | |
|
| ||||
| Stand-To-Sit | 1.8 (1.3-2.5) | 0.1 (0.1-0.2) | 18 (12-27) | |
|
| ||||
| Postoperative | Dysplastic Walking Gait | 1.5 (0.8-2.1) | 0.1 (0.0-0.1) | 12 (10-17) |
|
| ||||
| FAI Walking Gait | 0.9 (0.6-2.0) | 0.1 (0.1-0.2) | 8 (6-18) | |
|
| ||||
| Stand-To-Sit | 1.7 (0.9-2.9) | 0.1 (0.0-0.2) | 18 (12-30) | |
|
| ||||
| Simulated PAO without OCP | Dysplastic Walking Gait | 1.5 (0.9-2.1) | 0.1 (0.0-0.1) | 12 (11-17) |
|
| ||||
|
FAI
Walking Gait |
0.9 (0.7-1.8) | 0.1 (0.1-0.2) | 10 (6-17) | |
|
| ||||
| Stand-To-Sit | 1.6 (0.9-2.3) | 0.1 (0.0-0.2) | 18 (12-31) | |
|
|
||||
Table 3.
Peak contact stress, mean contact stress, and mean contact area were computed for models using template-based and anatomy-based femoral alignment techniques when simulating stance phase of dysplastic walking gait, stance phase of FAI walking gait, and a stand-to-sit task. Data are presented as median (IQR) with p-values comparing differences due to femoral alignment techniques.
| Peak Contact Stress (MPa) | Mean Contact Stress (MPa) | Mean Contact Area (mm2) | |||||||||
|---|---|---|---|---|---|---|---|---|---|---|---|
|
| |||||||||||
| Template-Based Alignment | Anatomy-Based Alignment | p-value | Template-Based Alignment | Anatomy-Based Alignment | p-value | Template-Based Alignment | Anatomy-Based Alignment | p-value | |||
| Preoperative | Dysplastic Walking Gait | 17.8 (15.5-20.6) | 17.8 (14.9-20.1) | 0.974 | 3.9 (3.3-4.9) | 4.0 (3.2-4.8) | 0.952 | 568 (410-610) | 568 (416-619) | 0.974 | |
|
| |||||||||||
| FAI Walking Gait | 20.5 (19.1-24.5) | 20.8 (18.9-24.1) | 0.931 | 4.6 (4.0-5.3) | 4.6 (4.1-5.4) | 0.910 | 358 (318-467) | 356 (315-471) | 0.868 | ||
|
| |||||||||||
| Stand-To-Sit | 10.1 (8.3-13.3) | 9.8 (7.8-12.7) | 0.645 | 2.2 (1.7-2.5) | 2.1 (1.6-2.5) | 0.743 | 400 (288-456) | 401 (284-432) | 0.910 | ||
|
| |||||||||||
| Postoperative | Dysplastic Walking Gait | 16.1 (13.7-17.3) | 15.9 (13.7-17.7) | 0.847 | 3.4 (2.9-4.1) | 3.4 (2.9-3.9) | 0.995 | 628 (494-698) | 617 (501-692) | 0.995 | |
|
| |||||||||||
| FAI Walking Gait | 22.1 (17.7-22.9) | 22.2 (17.7-24.0) | 0.784 | 4.2 (3.9-4.8) | 4.3 (4.0-4.8) | 0.826 | 386 (346-493) | 382 (343-509) | 0.952 | ||
|
| |||||||||||
| Stand-To-Sit | 10.4 (8.1-13.5) | 9.8 (7.5-12.1) | 0.516 | 1.8 (1.5-2.2) | 1.9 (1.5-2.1) | 0.784 | 471 (392-489) | 460 (395-504) | 0.867 | ||
|
| |||||||||||
| Simulated PAO without OCP | Dysplastic Walking Gait | 16.1 (13.7-17.3) | 15.9 (13.7-17.7) | 0.826 | 3.4 (2.9-4.1) | 3.4 (2.9-3.9) | 0.995 | 627 (495-698) | 617 (501-692) | 0.995 | |
|
| |||||||||||
| FAI Walking Gait | 22.0 (17.7-23.1) | 22.2 (17.7-24.0) | 0.723 | 4.2 (3.9-4.8) | 4.3 (4.0-4.8) | 0.805 | 386 (346-493) | 382 (343-509) | 0.910 | ||
|
| |||||||||||
| Stand-To-Sit | 10.3 (8.8-13.4) | 9.9 (7.5-13.1) | 0.551 | 1.8 (1.5-2.2) | 1.9 (1.5-2.1) | 0.764 | 453 (392-497) | 452 (396-509) | 0.867 | ||
|
|
|||||||||||
Figure 2.

Peak contact stress (top row), mean contact stress (center row), and mean contact area (bottom row) for preoperative (left column), postoperative (center column), and simulated PAO without OCP (right column) hip models. Data is shown for 13 quasi-static time points spanning stance phase of a dysplastic walking gait cycle. Pink lines indicate template-based femoral alingment, and blue lines indicate anatomy-based femoral alignment. Dots indicate the median of the 20 hips and the error bars indicate interquartile range. Each line is offset slightly to visualize overlapping error bars. Differences in all outcomes were minimal.
When comparing preoperative versus postoperative models, there were no significant differences in peak contact stress for models simulating dysplastic gait (template-based: p = 0.190; anatomy-based: p = 0.273), FAI gait (template-based: p = 1; anatomy-based: p = 1), or stand-to-sit (template-based: p = 1; anatomy-based: p = 1) (Table 4, Figures 3–4). Similarly, there were no significant differences in peak contact stress for preoperative versus simulated PAO without OCP models when modeling dysplastic gait/FAI gait/stand-to-sit (template-based: p = 0.190/1/1; anatomy-based: p = 0.273/1/1) or for postoperative versus simulated PAO without OCP models when modeling dysplastic gait/FAI gait/stand-to-sit (template-based: p = 0.974/1/1; anatomy-based: p = 0.995/1/1). In fact, the differences between the different surgical models were less than the differences in contact stresses computed using the different gait cycles (Figure 3). Mean contact stress and mean contact area computed for preoperative, postoperative, and simulated PAO without OCP models were also not significantly different (mean stress: p > 0.273 for all comparisons; mean area: p > 0.0504 for all comparisons) when using template-based or anatomy-based femoral alignment techniques and modeling dysplastic gait, FAI gait, or stand-to-sit (Table 4, Figures 3–4).
Table 4.
To better understand the effect of surgery on mechanical loading, differences in peak contact stress, mean contact stress, and mean contact area were reanalyzed to statistically compare between preoperative, postoperative, and simulated PAO without OCP models when modeling stance phase of dysplastic walking gait, stance phase of FAI walking gait, and a stand-to-sit task using both femoral alignment techniques. Data are presented as median (IQR). P-values compare differences between preoperative, postoperative, and simulated PAO without OCP models and were adjusted for multiple comparisons between operative states using the Holm-Bonferroni method.
| Peak Contact Stress (MPa) | Mean Contact Stress (MPa) | Mean Contact Area (mm2) | ||||||||
|---|---|---|---|---|---|---|---|---|---|---|
|
| ||||||||||
| Dysplastic Walking Gait | FAI Walking Gait | Stand-To-Sit | Dysplastic Walking Gait | FAI Walking Gait | Stand-To-Sit | Dysplastic Walking Gait | FAI Walking Gait | Stand-To-Sit | ||
|
| ||||||||||
| Template-Based Alignment | Preoperative | 17.8 (15.5-20.6) | 20.5 (19.1-24.5) | 10.1 (8.3-13.3) | 3.9 (3.3-4.9) | 4.6 (4.0-5.3) | 2.2 (1.7-2.5) | 568 (410-610) | 358 (318-467) | 400 (288-456) |
| Postoperative | 16.1 (13.7-17.3) | 22.1 (17.7-22.9) | 10.4 (8.1-13.5) | 3.4 (2.9-4.1) | 4.2 (3.9-4.8) | 1.8 (1.5-2.2) | 628 (494-698) | 386 (346-493) | 471 (392-489) | |
| Corrected p-value | 0.190 | 1 | 1 | 0.273 | 0.866 | 0.795 | 0.343 | 0.726 | 0.0504 | |
|
| ||||||||||
| Preoperative | 17.8 (15.5-20.6) | 20.5 (19.1-24.5) | 10.1 (8.3-13.3) | 3.9 (3.3-4.9) | 4.6 (4.0-5.3) | 2.2 (1.7-2.5) | 568 (410-610) | 358 (318-467) | 400 (288-456) | |
| Simulated PAO without OCP | 16.1 (13.7-17.3) | 22.0 (17.7-23.1) | 10.3 (8.8-13.4) | 3.4 (2.9-4.1) | 4.2 (3.9-4.8) | 1.8 (1.5-2.2) | 627 (495-698) | 386 (346-493) | 453 (392-497) | |
| Corrected p-value | 0.190 | 1 | 1 | 0.273 | 0.866 | 0.795 | 0.343 | 0.726 | 0.075 | |
|
| ||||||||||
| Postoperative | 16.1 (13.7-17.3) | 22.1 (17.7-22.9) | 10.4 (8.1-13.5) | 3.4 (2.9-4.1) | 4.2 (3.9-4.8) | 1.8 (1.5-2.2) | 628 (494-698) | 386 (346-493) | 471 (392-489) | |
| Simulated PAO without OCP | 16.1 (13.7-17.3) | 22.0 (17.7-23.1) | 10.3 (8.8-13.4) | 3.4 (2.9-4.1) | 4.2 (3.9-4.8) | 1.8 (1.5-2.2) | 627 (495-698) | 386 (346-493) | 453 (392-497) | |
| Corrected p-value | 0.974 | 1 | 1 | 0.947 | 0.968 | 0.925 | 0.974 | 0.968 | 0.968 | |
|
| ||||||||||
| Anatomy-Based Alignment | Preoperative | 17.8 (14.9-20.1) | 20.8 (18.9-24.1) | 9.8 (7.8-12.7) | 4.0 (3.2-4.8) | 4.6 (4.1-5.4) | 2.1 (1.6-2.5) | 568 (416-619) | 356 (315-471) | 401 (284-432) |
| Postoperative | 15.9 (13.7-17.7) | 22.2 (17.7-24.0) | 9.8 (7.5-12.1) | 3.4 (2.9-3.9) | 4.3 (4.0-4.8) | 1.9 (1.5-2.1) | 617 (501-692) | 382 (343-509) | 460 (395-504) | |
| Corrected p-value | 0.273 | 1 | 1 | 0.273 | 0.982 | 0.760 | 0.448 | 0.761 | 0.091 | |
|
| ||||||||||
| Preoperative | 17.8 (14.9-20.1) | 20.8 (18.9-24.1) | 9.8 (7.8-12.7) | 4.0 (3.2-4.8) | 4.6 (4.1-5.4) | 2.1 (1.6-2.5) | 568 (416-619) | 356 (315-471) | 401 (284-432) | |
| Simulated PAO without OCP | 15.9 (13.7-17.7) | 22.2 (17.7-24.0) | 9.9 (7.5-13.1) | 3.4 (2.9-3.9) | 4.3 (4.0-4.8) | 1.9 (1.5-2.1) | 617 (501-692) | 382 (343-509) | 452 (396-509) | |
| Corrected p-value | 0.273 | 1 | 1 | 0.273 | 0.982 | 0.760 | 0.448 | 0.761 | 0.091 | |
|
| ||||||||||
| Postoperative | 15.9 (13.7-17.7) | 22.2 (17.7-24.0) | 9.8 (7.5-12.1) | 3.4 (2.9-3.9) | 4.3 (4.0-4.8) | 1.9 (1.5-2.1) | 617 (501-692) | 382 (343-509) | 460 (395-504) | |
| Simulated PAO without OCP | 15.9 (13.7-17.7) | 22.2 (17.7-24.0) | 9.9 (7.5-13.1) | 3.4 (2.9-3.9) | 4.3 (4.0-4.8) | 1.9 (1.5-2.1) | 617 (501-692) | 382 (343-509) | 452 (396-509) | |
| Corrected p-value | 0.995 | 1 | 1 | 1 | 0.989 | 0.989 | 0.990 | 1 | 0.995 | |
Figure 3.

To better understand the effects of surgery on contact mechanics, the data are replotted with each color line indicating the operative state (preoperative, postoperative, simulated PAO without OCP). Peak contact stress (top row), mean contact stress (center row), and mean contact area (bottom row) are shown for each operative state using the anatomy-based femoral alignment technique. Data is shown for 13 quasi-static time points spanning stance phase of a dysplastic walking gait cycle (left column), stance phase of a FAI walking gait cycle (center column), and a stand-to-sit task (right column). Dots indicate the median among the 20 hips and the error bars indicate interquartile range. Each line is offset slightly to visualize overlapping error bars. Differences in all mechanical outcome metrics as a result of surgical status were minimal and less than differences associated with the type of joint loading applied (dysplastic – left column versus FAI – right column). Nearly identical results were found for models using the template-based femoral alignment technique (Figure 2).
Figure 4.

Preoperative (left), postoperative (center), and simulated PAO with OCP (right) contact stress distributions for a dysplastic hip joint during a stand-to-sit task at the point of highest flexion (61 degrees). PAO without concurrent OCP was able to increase contact area in the acetabulum and medialize the contact stress patch during the stand-to-sit task but did not reduce anterolateral contact stresses. The addition of OCP removed some of the high anterolateral contact stress (pink arrows) but did not completely eliminate the high stress in that region.
DISCUSSION
The goal of this work was to investigate the effects of incorporating patient-specific femoral geometry and orientation into computational models of patients with hip dysplasia before and after treatment with PAO and femoral OCP. Differences in computed intra-articular contact mechanics resulting from femoral alignment technique or head-neck offset correction were minimal, indicating that the presence of anatomic femoral deformities alone is not a predominant factor in intra-articular contact mechanics during gait and stand-to-sit activities.
Previous computational investigations have found that while PAO tends to decrease joint contact stress in patients with hip dysplasia, an improvement in contact mechanics is not necessarily guaranteed (Armiger et al., 2009; Scott et al., 2018; Thomas-Aitken et al., 2019), especially when there is concurrent femoral deformity that creates impingement (Satpathy et al., 2015; Scott et al., 2018). In this work, we did not find any significant changes in contact stress based on femoral alignment technique or inclusion of femoral OCP for any loading activity, which agrees with previous experimental findings (Meyer et al., 2020) but contradicts clinical evidence (Albers et al., 2013; Goronzy et al., 2017; Wells et al., 2018). The slight (albeit statistically insignificant) differences in contact stress computed when modeling a stand-to-sit task after offset correction (Figure 4) may indicate that modeling movement patterns that involve deep flexion maneuvers is more likely to elicit impingement-related contact stress abnormalities that better align with clinical findings. As such, future computational modeling studies investigating contact stress differences due to femoral abnormalities should consider emphasizing tasks of deep flexion.
Patient-specific acetabular coverage deficiencies, particularly the presence/absence of anterior deficiencies, are also likely to play a significant role in the effect of femoral OCP on intra-articular contact mechanics after PAO. While we were unable to assess regional coverage deficiencies in this work, future modeling studies should consider such regional deficiencies when evaluating contact stress differences due to femoral OCP after PAO. Finally, this is a small series of patients with low femoral version, femoral head-neck offset deformity, or a combination of both. This group was of interest because these potentially impingement-causing femoral deformities could be expected to relate to abnormal intra-articular contact mechanics and potentially derive the most improvement with surgical correction of those femoral abnormalities. However, the generally mild and relatively retroverted nature of femoral deformity in these patients (median version of 7 degrees and median Dunn alpha angle of 57 degrees; Table 1) is in contrast to the excessive femoral anteversion that frequently accompanies dysplastic deformities (Sugano et al., 1998; Wells et al., 2017). This may have limited our ability to identify significant differences in intra-articular contact mechanics, and as such, the conclusions of this investigation should only be applied to patients with similar levels of deformity.
For application of any given set of DEA loading conditions, models must be oriented in a known coordinate system. The most commonly used coordinate system for the hip is that of Bergmann, et al., due to the associated comprehensive set of kinematic and kinetic input parameters (Bergmann et al., 2001). While the Bergmann, et al. femur coordinate system is clearly defined, alignment to this coordinate system requires anatomic landmarks on the distal femur. Previous computational studies (Abraham et al., 2017; Abraham et al., 2013; Anderson et al., 2010; Goetz et al., 2021; Henak et al., 2014; Scott et al., 2018; Thomas-Aitken et al., 2019; Thomas-Aitken et al., 2018) only include the pelvis and proximal femur, precluding them from accounting for patient-specific femoral orientations in the alignment process. More recently, clinical practice has shifted to obtain preoperative CT scans for evaluating hip dysplasia that include images through the distal femur to evaluate femoral version, thereby enabling computational models of hip dysplasia to incorporate patient-specific femoral orientations in addition to patient-specific bony geometry.
While modifications to clinical imaging protocols have enabled computational models to account for patient-specific femoral orientations, it is unclear if including such information will alter the computed contact stresses. Evidence from biomechanical studies demonstrating that increases in femoral retroversion combined with internal rotation increase peak contact pressure (Satpathy et al., 2015) conflicts with other cadaveric contact pressure measurements indicating changes in femoral version during loading minimally affect intra-articular peak contact stresses (Meyer et al., 2020). While no significant differences in contact mechanics resulting from femoral version were identified in this work, many patients with abnormal femoral version walk with an altered foot progression angle as a mechanism of preventing impingement and instability, resulting in different gait characteristics (Crane, 1959; Radler et al., 2010) and joint reaction forces (Shepherd et al., 2022) than in patients with normal femoral version. It is possible that the contact stress patterns may be more influenced by the effects that femoral deformities have on movement pattern. In this work, the dysplastic and FAI loading scenarios that did result in different contact stress patterns had joint reaction forces that differed throughout the gait cycle by an average of 32.4% BW medially, 52.8% BW anteriorly, and 66.3% BW superiorly, and hip rotation angles that differed by an average of 6.7 degrees of flexion/extension, 6.4 degrees of abduction/adduction, and 9.9 degrees of external/internal rotation. Similar magnitudes of differences in hip forces and angles have been identified due to femoral version abnormalities. For example, musculoskeletal modeling techniques have demonstrated that a 15-degree increase in femoral anteversion alters hip joint reaction forces during stance by up to 48% BW (Shepherd et al., 2022), and gait analysis techniques have shown an 8-degree average difference in mean hip joint angles during stance between individuals with less than or greater than 15 degrees of femoral anteversion (Radler et al., 2010). The absence of patient-specific gait information for this patient cohort prevented including such differences in DEA model loading scenarios, and this may have contributed to the lack of significant differences in contact stress patterns found for these patients with femoral deformity.
The present study does have some additional limitations. The DEA methodology implemented in this work makes numerous modeling assumptions that may impact the results of our investigation: rigid bone, exclusion of the acetabular labrum, and simplified cartilage material properties (Thomas-Aitken et al., 2018; Townsend et al., 2018). DEA also does not permit evaluation of shear stress, which is likely an important contributor to cartilage degeneration in incongruent joints (Carter et al., 1987; Hadley et al., 1990; McKinley et al., 2008). As our hip models were created from clinical CT scans, we were unable to visualize patient-specific cartilage geometry, which required us to estimate our cartilage surfaces based on subchondral bone projections (Aitken et al., 2022). In addition to the lack of patient-specific gait alterations due to femoral deformities, we were unable to include other patient-specific compensatory mechanisms, such as modification of pelvic tilt, that may further alter hip joint forces and the associated contact stresses (Ismail and Lewis, 2022). Future studies should investigate how such patient-specific compensatory movement techniques contribute to altered joint loading and intra-articular mechanics.
Based on the minimal changes in contact stress identified in this work, we conclude that isolated femoral version and head-neck offset anatomic deformities are not predominant factors in computed intra-articular contact mechanics during gait and stand-to-sit activities. Given the clinical association of femoral abnormalities with increased hip joint degeneration (Tonnis and Heinecke, 1999; Wyles et al., 2017), these data suggest that femoral version and head-neck offset deformities themselves are not the primary reason for increased contact stress. Rather, future osteoarthritic degeneration is more likely associated with contact stress abnormalities caused by altered moment arms and unusual movement patterns caused by abnormal femoral version (Modenese et al., 2021) or to avoid bony impingement resulting from femoral head-neck offset deformity (Wyles et al., 2017). Inclusion of patient-specific movement patterns and collision detection between bony surfaces will be important considerations in future computational investigations of the effects of concurrent femoral deformities on contact mechanics in the dysplastic hip joint.
ACKNOWLEDGMENTS
This work was supported by a Career Development Grant from the Orthopaedic Research and Education Foundation and by the National Institutes of Health under award 5 T35 HL007485-39. The authors have no conflict of interest with respect to any aspect of this study.
REFERENCES
- Abraham CL, Knight SJ, Peters CL, Weiss JA, Anderson AE, 2017. Patient-specific chondrolabral contact mechanics in patients with acetabular dysplasia following treatment with peri-acetabular osteotomy. Osteoarthritis Cartilage 25, 676–684. [DOI] [PMC free article] [PubMed] [Google Scholar]
- Abraham CL, Maas SA, Weiss JA, Ellis BJ, Peters CL, Anderson AE, 2013. A new discrete element analysis method for predicting hip joint contact stresses. J Biomech 46, 1121–1127. [DOI] [PMC free article] [PubMed] [Google Scholar]
- Aitken HD, Westermann RW, Bartschat NI, Meyer AM, Brouillette MJ, Glass NA, Clohisy JC, Willey MC, Goetz JE, 2022. Chronically elevated contact stress exposure correlates with intra-articular cartilage degeneration in patients with concurrent acetabular dysplasia and femoroacetabular impingement. J Orthop Res, 1–14. [DOI] [PMC free article] [PubMed] [Google Scholar]
- Albers CE, Steppacher SD, Ganz R, Tannast M, Siebenrock KA, 2013. Impingement adversely affects 10-year survivorship after periacetabular osteotomy for DDH. Clin Orthop Relat Res 471, 1602–1614. [DOI] [PMC free article] [PubMed] [Google Scholar]
- Anderson AE, Ellis BJ, Maas SA, Weiss JA, 2010. Effects of idealized joint geometry on finite element predictions of cartilage contact stresses in the hip. J Biomech 43, 1351–1357. [DOI] [PMC free article] [PubMed] [Google Scholar]
- Armand M, Lepistö J, Tallroth K, Elias J, Chao E, 2009. Outcome of periacetabular osteotomy. Acta Orthopaedica 76, 303–313. [PMC free article] [PubMed] [Google Scholar]
- Armiger RS, Armand M, Tallroth K, Lepisto J, Mears SC, 2009. Three-dimensional mechanical evaluation of joint contact pressure in 12 periacetabular osteotomy patients with 10-year follow-up. Acta Orthop 80, 155–161. [DOI] [PMC free article] [PubMed] [Google Scholar]
- Bergmann G, Deuretzbacher G, Heller M, Graichen F, Rohlmann A, Strauss J, Duda GN, 2001. Hip contact forces and gait patterns from routine activities. J Biomech 34, 859–871. [DOI] [PubMed] [Google Scholar]
- Carter DR, Rapperport DJ, Fyhrie DP, Schurman DJ, 1987. Relation of coxarthrosis to stresses and morphogenesis. A finite element analysis. Acta Orthop Scand 58, 611–619. [DOI] [PubMed] [Google Scholar]
- Chao EY, Volokh KY, Yoshida H, Shiba N, Ide T, 2010. Discrete element analysis in musculoskeletal biomechanics. Mol Cell Biomech 7, 175–192. [PubMed] [Google Scholar]
- Chegini S, Beck M, Ferguson SJ, 2009. The effects of impingement and dysplasia on stress distributions in the hip joint during sitting and walking: a finite element analysis. J Orthop Res 27, 195–201. [DOI] [PubMed] [Google Scholar]
- Crane L, 1959. Femoral torsion and its relation to toeing-in and toeing-out. J Bone Joint Surg Am 41, 421–428. [PubMed] [Google Scholar]
- Fabricant PD, Fields KG, Taylor SA, Magennis E, Bedi A, Kelly BT, 2015. The effect of femoral and acetabular version on clinical outcomes after arthroscopic femoroacetabular impingement surgery. J Bone Joint Surg Am 97, 537–543. [DOI] [PubMed] [Google Scholar]
- Goetz JE, Thomas-Aitken HD, Sitton SE, Westermann RW, Willey MC, 2021. Joint contact stress improves in dysplastic hips after periacetabular osteotomy but remains higher than in normal hips. Hip Int, 11207000211036414. [DOI] [PMC free article] [PubMed] [Google Scholar]
- Goronzy J, Franken L, Hartmann A, Thielemann F, Postler A, Paulus T, Gunther KP, 2017. What Are the Results of Surgical Treatment of Hip Dysplasia With Concomitant Cam Deformity? Clin Orthop Relat Res 475, 1128–1137. [DOI] [PMC free article] [PubMed] [Google Scholar]
- Hadley NA, Brown TD, Weinstein SL, 1990. The effects of contact pressure elevations and aseptic necrosis on the long-term outcome of congenital hip dislocation. J Orthop Res 8, 504–513. [DOI] [PubMed] [Google Scholar]
- Harris MD, MacWilliams BA, Bo Foreman K, Peters CL, Weiss JA, Anderson AE, 2017. Higher medially-directed joint reaction forces are a characteristic of dysplastic hips: A comparative study using subject-specific musculoskeletal models. J Biomech 54, 80–87. [DOI] [PMC free article] [PubMed] [Google Scholar]
- Henak CR, Abraham CL, Anderson AE, Maas SA, Ellis BJ, Peters CL, Weiss JA, 2014. Patient-specific analysis of cartilage and labrum mechanics in human hips with acetabular dysplasia. Osteoarthritis Cartilage 22, 210–217. [DOI] [PMC free article] [PubMed] [Google Scholar]
- Ismail KK, Lewis CL, 2022. Effect of simulated changes in pelvic tilt on hip joint forces. J Biomech 135, 111048. [DOI] [PMC free article] [PubMed] [Google Scholar]
- Jiang N, Peng L, Al-Qwbani M, Xie GP, Yang QM, Chai Y, Zhang Q, Yu B, 2015. Femoral version, neck-shaft angle, and acetabular anteversion in Chinese Han population: a retrospective analysis of 466 healthy adults. Medicine (Baltimore) 94, e891. [DOI] [PMC free article] [PubMed] [Google Scholar]
- Kelly BT, Bedi A, Robertson CM, Dela Torre K, Giveans MR, Larson CM, 2012. Alterations in internal rotation and alpha angles are associated with arthroscopic cam decompression in the hip. Am J Sports Med 40, 1107–1112. [DOI] [PubMed] [Google Scholar]
- Kern AM, Anderson DD, 2015. Expedited patient-specific assessment of contact stress exposure in the ankle joint following definitive articular fracture reduction. J Biomech 48, 3427–3432. [DOI] [PMC free article] [PubMed] [Google Scholar]
- Mavcic B, Iglic A, Kralj-Iglic V, Brand RA, Vengust R, 2008. Cumulative hip contact stress predicts osteoarthritis in DDH. Clin Orthop Relat Res 466, 884–891. [DOI] [PMC free article] [PubMed] [Google Scholar]
- Maxian TA, Brown TD, Weinstein SL, 1995. Chronic stress tolerance levels for human articular cartilage: two nonuniform contact models applied to long-term follow-up of CDH. J Biomech 28, 159–166. [DOI] [PubMed] [Google Scholar]
- McKinley TO, Tochigi Y, Rudert MJ, Brown TD, 2008. The effect of incongruity and instability on contact stress directional gradients in human cadaveric ankles. Osteoarthritis Cartilage 16, 1363–1369. [DOI] [PMC free article] [PubMed] [Google Scholar]
- Meyer AM, Thomas-Aitken HD, Brouillette MJ, Westermann RW, Goetz JE, 2020. Isolated changes in femoral version do not alter intra-articular contact mechanics in cadaveric hips. J Biomech 109, 109891. [DOI] [PMC free article] [PubMed] [Google Scholar]
- Modenese L, Barzan M, Carty CP, 2021. Dependency of lower limb joint reaction forces on femoral version. Gait Posture 88, 318–321. [DOI] [PubMed] [Google Scholar]
- Ng KCG, Mantovani G, Modenese L, Beaule PE, Lamontagne M, 2018. Altered Walking and Muscle Patterns Reduce Hip Contact Forces in Individuals With Symptomatic Cam Femoroacetabular Impingement. Am J Sports Med 46, 2615–2623. [DOI] [PubMed] [Google Scholar]
- Radler C, Kranzl A, Manner HM, Hoglinger M, Ganger R, Grill F, 2010. Torsional profile versus gait analysis: consistency between the anatomic torsion and the resulting gait pattern in patients with rotational malalignment of the lower extremity. Gait Posture 32, 405–410. [DOI] [PubMed] [Google Scholar]
- Satpathy J, Kannan A, Owen JR, Wayne JS, Hull JR, Jiranek WA, 2015. Hip contact stress and femoral neck retroversion: a biomechanical study to evaluate implication of femoroacetabular impingement. J Hip Preserv Surg 2, 287–294. [DOI] [PMC free article] [PubMed] [Google Scholar]
- Scott EJ, Thomas-Aitken HD, Glass N, Westermann R, Goetz JE, Willey MC, 2018. Unaddressed Cam Deformity Is Associated with Elevated Joint Contact Stress After Periacetabular Osteotomy. J Bone Joint Surg Am 100, e131. [DOI] [PubMed] [Google Scholar]
- Shepherd MC, Gaffney BMM, Song K, Clohisy JC, Nepple JJ, Harris MD, 2022. Femoral version deformities alter joint reaction forces in dysplastic hips during gait. J Biomech 135, 111023. [DOI] [PMC free article] [PubMed] [Google Scholar]
- Sugano N, Noble PC, Kamaric E, Salama JK, Ochi T, Tullos HS, 1998. The morphology of the femur in developmental dysplasia of the hip. J Bone Joint Surg Br 80, 711–719. [DOI] [PubMed] [Google Scholar]
- Thomas-Aitken HD, Goetz JE, Dibbern KN, Westermann RW, Willey MC, Brown TS, 2019. Patient Age and Hip Morphology Alter Joint Mechanics in Computational Models of Patients With Hip Dysplasia. Clin Orthop Relat Res 477, 1235–1245. [DOI] [PMC free article] [PubMed] [Google Scholar]
- Thomas-Aitken HD, Willey MC, Goetz JE, 2018. Joint contact stresses calculated for acetabular dysplasia patients using discrete element analysis are significantly influenced by the applied gait pattern. J Biomech 79, 45–53. [DOI] [PMC free article] [PubMed] [Google Scholar]
- Thomas TP, Anderson DD, Willis AR, Liu P, Marsh JL, Brown TD, 2011. ASB Clinical Biomechanics Award Paper 2010 Virtual pre-operative reconstruction planning for comminuted articular fractures. Clin Biomech (Bristol, Avon) 26, 109–115. [DOI] [PMC free article] [PubMed] [Google Scholar]
- Tonnis D, Heinecke A, 1999. Acetabular and femoral anteversion: relationship with osteoarthritis of the hip. J Bone Joint Surg Am 81, 1747–1770. [DOI] [PubMed] [Google Scholar]
- Townsend KC, Thomas-Aitken HD, Rudert MJ, Kern AM, Willey MC, Anderson DD, Goetz JE, 2018. Discrete element analysis is a valid method for computing joint contact stress in the hip before and after acetabular fracture. J Biomech 67, 9–17. [DOI] [PMC free article] [PubMed] [Google Scholar]
- Volokh KY, Chao EY, Armand M, 2007. On foundations of discrete element analysis of contact in diarthrodial joints. Mol Cell Biomech 4, 67–73. [PMC free article] [PubMed] [Google Scholar]
- Wells J, Nepple JJ, Crook K, Ross JR, Bedi A, Schoenecker P, Clohisy JC, 2017. Femoral Morphology in the Dysplastic Hip: Three-dimensional Characterizations With CT. Clin Orthop Relat Res 475, 1045–1054. [DOI] [PMC free article] [PubMed] [Google Scholar]
- Wells J, Schoenecker P, Duncan S, Goss CW, Thomason K, Clohisy JC, 2018. Intermediate-Term Hip Survivorship and Patient-Reported Outcomes of Periacetabular Osteotomy: The Washington University Experience. J Bone Joint Surg Am 100, 218–225. [DOI] [PubMed] [Google Scholar]
- Wu G, Siegler S, Allard P, Kirtley C, Leardini A, Rosenbaum D, Whittle M, D’Lima DD, Cristofolini L, Witte H, Schmid O, Stokes I, 2002. ISB recommendation on definitions of joint coordinate system of various joints for the reporting of human joint motion—part I: ankle, hip, and spine. J Biomech 35, 543–548. [DOI] [PubMed] [Google Scholar]
- Wyles CC, Heidenreich MJ, Jeng J, Larson DR, Trousdale RT, Sierra RJ, 2017. The John Charnley Award: Redefining the Natural History of Osteoarthritis in Patients With Hip Dysplasia and Impingement. Clin Orthop Relat Res 475, 336–350. [DOI] [PMC free article] [PubMed] [Google Scholar]
- Ziebarth K, Balakumar J, Domayer S, Kim YJ, Millis MB, 2011. Bernese periacetabular osteotomy in males: is there an increased risk of femoroacetabular impingement (FAI) after Bernese periacetabular osteotomy? Clin Orthop Relat Res 469, 447–453. [DOI] [PMC free article] [PubMed] [Google Scholar]
- Zou Z, Chavez-Arreola A, Mandal P, Board TN, Alonso-Rasgado T, 2013. Optimization of the position of the acetabulum in a ganz periacetabular osteotomy by finite element analysis. J Orthop Res 31, 472–479. [DOI] [PubMed] [Google Scholar]