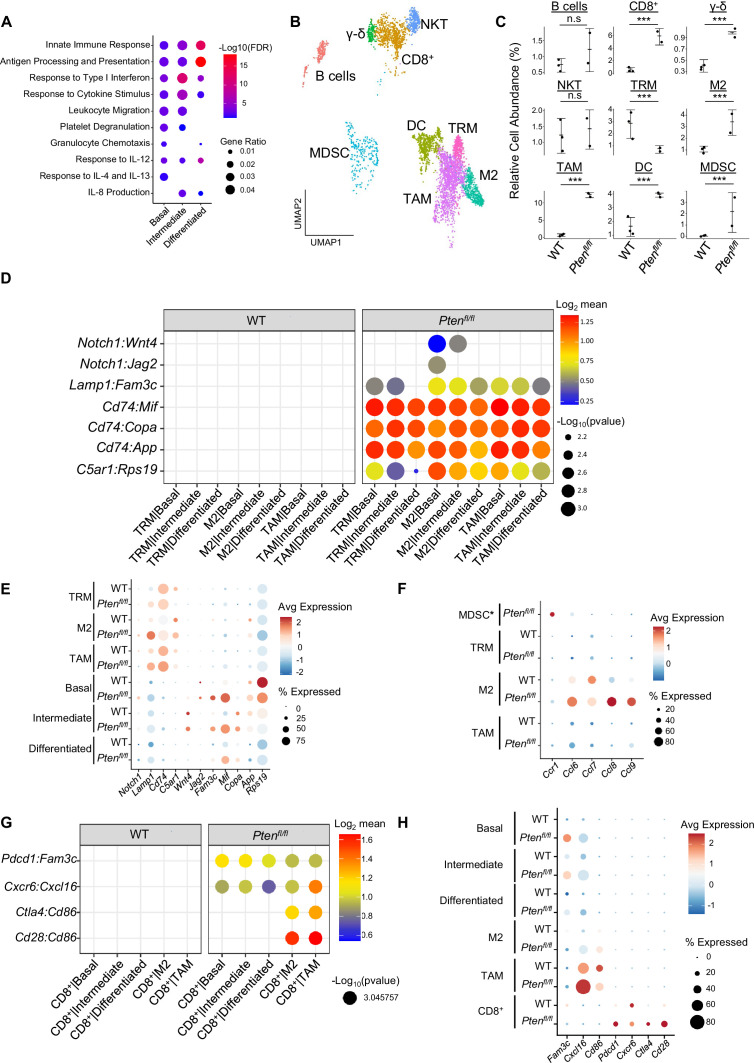
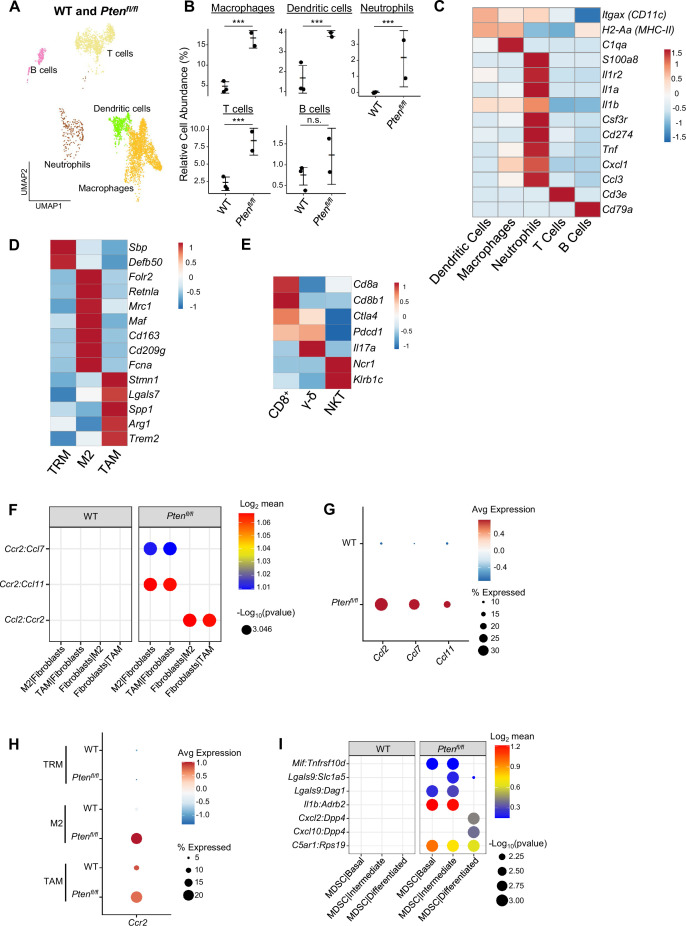
Figure 2. Immune recruitment in Ptenfl/fl prostates is mediated by both epithelial and immune cell signaling.
(A) Top immune-related GSEA results enriched in Ptenfl/fl compared to WT mice for each epithelial subtype. All pathways are enriched with FDR <0.05. (B) UMAP visualization of immune cells labeled by cell subtype or state. (C) Relative abundance of immune cells in WT (n=3) and Ptenfl/fl (n=2) mice. Y-axis shows the % composition of each sample by cell type (Data presented as +/-SD, ***p<0.001, n.s.=not significant, negative binomial test). (D) Dot plot of signaling interactions between macrophages and epithelial cells. Y-axis, ligand-receptor pairs from CellphoneDB database. X-axis, cell-cell pairings. Interactions are directional: the first gene in a pair is expressed in the first cell in the cell-cell interaction. (E) Dot plot of epithelial ligand and macrophage receptor gene expression in WT and Ptenfl/fl mice. (F) Dot plot of Ccr1 and Ccr1 ligand expression in MDSCs and macrophages in WT and Ptenfl/fl ventral prostates. MDSCs are only present in Ptenfl/fl and therefore do not have a WT row (denoted by asterisk). (G) Plot of signaling interactions between CD8 +T cells and epithelial cells and macrophages. (H) Dot plot of CD8+ T cell receptors and epithelial and macrophage ligand gene expression in WT and Ptenfl/fl ventral prostates.


