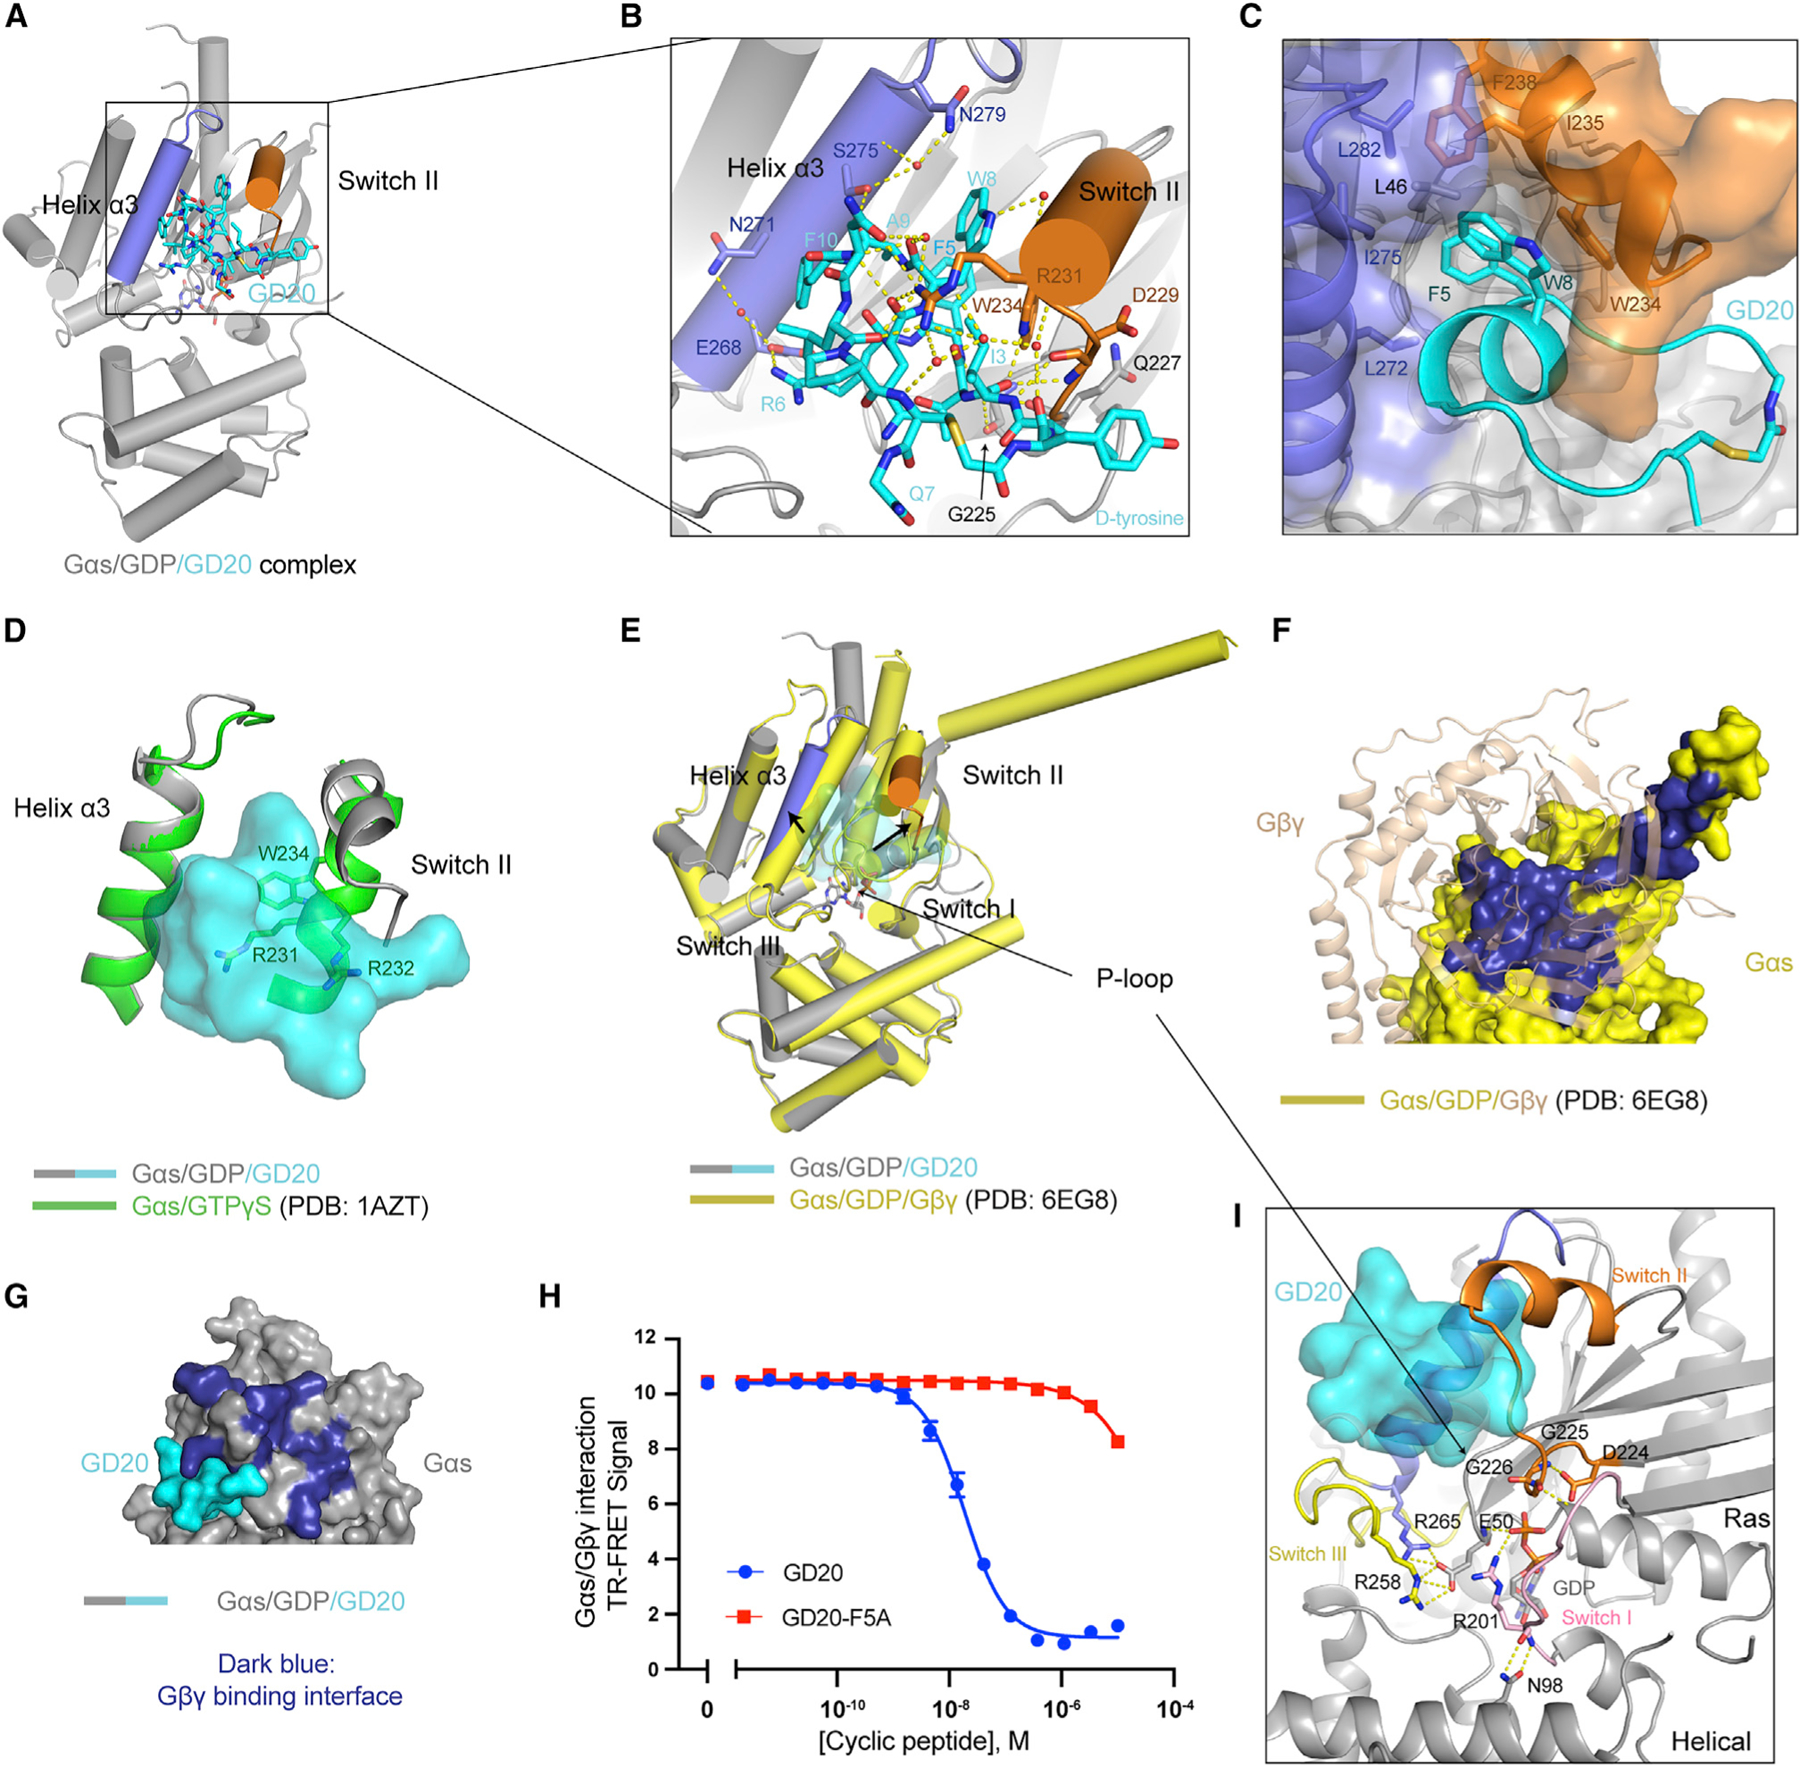
Figure 5. The crystal structure of GDP-bound Gαs in complex with GD20.

(A) Overall structure of the Gαs/GDP/GD20 complex. GD20 (cyan) binds in between switch II (orange) and the α3 helix (slate).
(B) Structural details of Gαs/GD20 interaction. Ion pair and H-bonds are shown as yellow dashed lines.
(C) Close-up view of a hydrophobic pocket in Gαs that accommodates GD20 F5 and W8 (cyan). Gαs residues that form the hydrophobic pocket are shown as sticks.
(D) Alignment of Gαs/GD20 complex structure (gray) with the structure of Gαs/GTPγS (green, PDB: 1AZT) in the switch II/α3 pocket.
(E) Alignment of Gαs/GD20 complex structure (gray) with the structure of Gαs/GDP (yellow) in the structure of Gαs/Gβ1/γ2 heterotrimer (PDB: 6EG8). Gβγ was hidden for clarity.
(F) Structural details of the Gαs (yellow, surface) and Gβγ (wheat, cartoon) binding interface (dark blue) (PDB: 6EG8).
(G) The Gβγ binding interface (dark blue) of Gαs is rearranged when GD20 (cyan) binds to Gαs (gray). Gβγ was hidden for clarity.
(H) GD20, but not GD20-F5A, inhibited PPI between Gαs/GDP and Gβγ(C68S). Mean ± SD, n = 3.
(I) Close-up view of Gαs nucleotide binding pocket in our Gαs/GD20 complex structure. Residues that stabilize GDP binding are shown as sticks.
