

Abstract
Pandemics significantly impact human daily life. People throughout the world adhere to safety protocols (e.g., social distancing and self-quarantining). As a result, they willingly keep distance from workplace, friends and even family. In such circumstances, in-person social interactions may be substituted with virtual ones via online channels, such as, Instagram and Snapchat. To get insights into this phenomenon, we study a group of undergraduate students before and after the start of COVID-19 pandemic. Specifically, we track N=102 undergraduate students on a small college campus prior to the pandemic using mobile sensing from phones and assign semantic labels to each location they visit on campus where they study, socialize and live. By leveraging their colocation network at these various semantically labeled places on campus, we find that colocations at certain places that possibly proxy higher in-person social interactions (e.g., dormitories, gyms and Greek houses) show significant predictive capability in identifying the individuals’ change in social media usage during the pandemic period. We show that we can predict student’s change in social media usage during COVID-19 with an F1 score of 0.73 purely from the in-person colocation data generated prior to the pandemic.
Keywords: Colocation, Social Media, Social Interaction, Mobile Sensing, COVID-19
1. INTRODUCTION
Pandemics change our lives on multiple levels. Individuals stay at home and work from home in order to adhere to safety guidelines and maintain social distance[5, 15, 41]. However, spending more time at home does not change the fact that humans are innately social. We hypothesize that while adhering to the shelter-in-place guidelines leads to a sharp decrease in individuals’ face-to-face interactions, their virtual interactions via social media should increase to offset the loss of in-person interaction. We explore individual differences in the shift from in-person social behavior to social media usage during a pandemic. We find that although there is a general increase in social media usage, the extent of this increase varies widely across individuals. While some people experience a large increase in social media usage compared to their pre-pandemic norm, others report having only a slight change, if any.
Prospectively identifying individuals that significantly increase their social media usage during times of crisis is critically important. Social media and other tech companies can adjust the product to better target and serve these users. It is also important to health agencies because significantly increased phone usage, particularly for social media applications, has been linked to poor mental health outcomes, such as depression and generalized anxiety disorder [29, 65]. Therefore, we investigate factors that influence changes in social media usage during a pandemic. However, our initial analysis shows that demographic information, such as, gender is not significantly associated with a change in social media usage. The change during pandemic has special characteristics: COVID-19 inhibits our free movement offline (i.e., in real life) giving impetus to shifting to virtual interactions. Very few studies have investigated how this shift is related to individuals’ longitudinal face-to-face social interaction. To get insights into this shift, we propose to understand how individuals are connected offline (hereon termed “in-person”) during the pre-COVID-19 period.
How can we measure in-person social behavior? Traditional methods are mainly dependent on participants’ self-report or onetime survey [2, 23]. However, such an approach may be unreliable and inaccurate because of issues stemming from bias, recall effect, among other factors. Smartphones and other wearable sensors provide access to behavioral and contextual information through various built-in sensors which are objective in nature compared to the subjective self-reports. The major smartphone sensors that are used to measure localization are GPS, WiFi and Bluetooth. Although Bluetooth has many advantages, it has various limitations in terms of sensing social interactions [16]. First, Bluetooth proximity could be noisy when devices sometimes fail to detect all nearby devices, which is likely to happen when many devices are active at the same time in the same location. Second, Bluetooth needs beacons to recognize an individual’s identity. It requires additional pre-study setups (e.g., distributing beacons to the participants and linking the beacon ID to user IDs). Instead, the GPS is available with no extra cost via apps. Therefore, in our study, we use mobile phone based GPS tracking to passively and consistently calculate individuals’ geospatial social distance in real-time.
In this paper, we use colocation data computed from GPS sensing before the COVID-19 period to predict the changes of social media usage during the COVID-19 period, capturing the shift of social behavior from in-person to virtual – we use the terms virtual interactions and online interactions interchangeably in this manuscript. We explore this shift of social behavior among undergraduate students at Dartmouth College. We use longitudinal data from the pre-COVID-19 period to investigate the change as a result of the pandemic. Specifically, we leverage data from the 2020 academic Winter term which started from Jan 06, 2020. In terms of the first 8 weeks of the Winter term, students enjoyed normal school life on campus – studying, socializing and working on a tight-knit campus in a small college town where all undergraduates live on campus. We consider this period of the Winter term to be our baseline data and as such we use it to compute colocations over the students’ in-person social behavior as part of their pre-COVID-19 “normal lifestyle”. In week 9 of this Winter term (specifically, on March 2), the campus community confirmed its first case of a student with COVID-19. In week 10, the World Health Organization (WHO) officially declared COVID-19 a pandemic, and the vast majority of undergraduate students returned home after their final exams. Starting from week 11, we collected Ecological Momentary Assessment (EMA) surveys remotely once a week to record the change in students’ social media usage behavior. We perform analysis to explore the correlations between the pre-COVID in-person colocation and the change in social media usage and then finally, we predict the change in social media usage with features generated from the in-person colocation.
The contributions of this paper are as follows:
To the best of our knowledge, this is the first paper to predict increased social media usage during COVID-19 by utilizing in-person colocation sensing data from phones collected prior to COVID-19. We believe it shines some light on individuals’ social behavior as they switch from in-person to virtual interactions during the pandemic.
We identify three on-campus semantic location categories (viz. dormitory, greek houses and gym) where students’ colocations are positively related to an increase in social media usage during COVID-19.
We show that colocation at places that may proxy higher in-person social interactions have significant predictive capability in identifying the individuals’ change in social media usage during COVID-19. By using only the time series of the network degree 1 at these three semantic locations prior to COVID-19, we can predict whether or not a student experiences a significant increase in social media usage with an F1 score of 0.73.
The structure of the paper is as follows. We start by discussing the related work on social behavior, mobile sensing, colocation and then detail our study design, dataset, methods, models, results and insights. We make some concluding remarks, implications and discuss the privacy and ethical considerations of collecting sensitive data in the discussion section.
2. RELATED WORK
2.1. Social Behavior: Virtual and In-Person
Social behavior refers to a set of actions conducted by members of the same species when they have interactions or exchanges [27, 54]. One fundamental social behavior is communication between each other in a way that influences the members’ immediate or future behavior [54, 58]. Social media platforms like Facebook, YouTube, Instagram have become some of the most popular tools for social interaction and information exchange online [22, 31, 35, 43, 49]. We usually term this online social behavior as social networking as it is particularly focused on connecting people remotely [39]. Studies show that social networking platforms help people feel that they belong to a community [59, 64].
One of the reasons for increased engagement in social networking is colloquially termed as “fear of missing out”, often abbreviated as FOMO – “a pervasive apprehension that others might be having rewarding experiences from which one is absent” [50]. This phenomenon might be more severe during COVID-19, as individuals are required or suggested to stay at home, possibly causing them to experience subsequent separation from others. This would lead to increased loneliness and a “fear of missing out” if people observe others having a good time on social media platforms. Another thing to note is that as COVID-19 has led several businesses and educational institutes to transition to an online only format, online social behavior now rapidly extends to several different areas not just limited to social networking. For instance, in-person social meetings have transitioned to online, along with several facets of life, spanning work [37, 38], medical help [32, 48, 62], internships [20], and education [53].
2.2. Social Behavior and Mobile Sensing
Mobile phone and wearable sensing have been widely used for passive and naturalistic assessment of individuals’ activity and behavior [12, 25, 30] as well as their health conditions. A number of studies find relationships between mobile sensing data and mental health, such as, anxiety [7, 8, 28, 55], depression [11, 45, 56, 67, 68], mood change [24, 42], and other behavioral markers related to mental health [47, 70], well-being and personality [46, 57, 69]. The StudentLife study [67] implemented mobile sensing with college students and demonstrated that students’ depression, stress, loneliness are associated with passive sensing behaviors such as conversation, sleep, activity, colocation. To date, there has been increasingly influential work that examines social behaviors detected from mobile sensors for accessing mental wellbeing or personality disorders [8, 51, 70]. Researchers have also identified relationships between the content that people share on social media and activity sensed by mobile devices [12].
2.3. Colocation and Location Semantics
Facilitated by mobile sensing and GPS tracking, colocation stands out as an interesting approach to observe connections between individuals by utilizing accurate geospatial information. Colocation has been adopted by researchers in various human-computer interface (HCI) designs such as collaborative web search [1], collaborative TV [10], multiplayer games [34] and other cooperative or competitive interfaces [63, 72]. Furthermore, colocation is widely used in physical proximity calculation [40], group detection/discovery [9, 66] and in analyzing location-based social activity like inter-firm cooperation [19]. Reitmaier & Benz et al. [52] design and theorize the colocated interactions by showing how we sensitized ourselves to theory from diverse intellectual disciplines. Recent research reports that colocation is a proxy for real-world social interactions [3, 6, 60, 61] and is also a strong indicator of friendship [17]. The semantics of where colocation takes place may reveal more about the in-person social connection [33]. Brown and colleagues [9] explore group colocation behavior and find that groups of individuals are more likely to meet at places that their other friends have visited before, and that the type of place strongly affects the propensity for groups to meet there. This is to say that different semantics of locations have different meanings to individuals and can also make different influences on the individuals [7, 28, 55].
As far as we know, there is not any research that focuses on using colocation data to predict social media usage. This could be helpful in numerous ways. First, it can help us understand the change in social behavior of colocated individuals and whether certain location semantics are relevant to it. Next, because the colocation captured from GPS tracks real-time group information, it can be leveraged in applications and protocols, such as recommendation systems or delay-tolerant forwarding in ad-hoc networks, to enhance the user experience [71].
3. METHODOLOGY
3.1. Study Design
The current study began in September 2018 and tracked 102 college undergraduates (approximately 10% of all new students admitted in the same year) for four years. The students were asked to install a continuous mobile sensing app on their primary Android or Apple phone for the four years. The study is approved by the institution’s Institutional Review Board (IRB) and participants are compensated 10 dollars per week for active participation. The Winter term of the participating student’s second year at college coincided with the initial phases of the COVID-19 pandemic.
Figure 1 shows the timeline of the Winter term and some of the important dates related to COVID-19. Specifically, on March 2, 2020 (the beginning of the ninth week of the term), the first local COVID-19 case was diagnosed near campus, raising significant awareness among the students. On March 13, the Winter term’s final exam ended and also, COVID-19 was declared a National Emergency by the President of the United States. The college consequently announced online-only learning for the then upcoming Spring term. In order to understand students’ changes in social media usage during the quarantine, beginning March 18, we started posting a COVID-19 follow-up survey remotely to our mobile sensing app. Students received notifications once a week asking, “Is your social media usage?” with options rated on a 7-point Likert scale with 1 being “much less than normal”, 4 being “normal”, and 7 being “much more than normal”. They also have the option to open the app and answer the survey manually when it is most convenient for them.
Figure 1:

Timeline of the Winter term and the important dates in relation to the response to COVID-19. In this work we calculate on-campus colocation based on the sensed GPS data during week 1–8 of the Winter term (i.e., before the first local COVID-19 case diagnosed near the campus). We collect student’s self-reported change in social media usage after the term ended.
3.2. Demographics
Many Dartmouth College students utilize their whole sophomore year to get work experience through internships, volunteer on community projects, perform field research, or attend study-abroad programs, which is known as the D-Plan. Therefore, among the 102 enrolled participants, only 60 were on campus during the 2020 Winter term. It is worth noting that, because many other students who were not enrolled in our study also departed college, we can still consider the 60 individuals to represent 10% of the students on campus.
In order to understand the link between students’ on-campus colocation and the change in social media usage during COVID-19, 52 students are filtered based on the condition that: (1) they are on-campus during the term and (2) they answer COVID-19 follow-up questions about the change in social media usage (the survey was optional so not everyone answered voluntarily). Table 1 shows the demographics of the 52 students who we use in our analysis.
Table 1:
Demographics of the participants (N=52)
| Type | Count | Percent |
|---|---|---|
| Gender | ||
| Female | 32 | 61.5% |
| Male | 19 | 36.5% |
| Unknown or not reported | 1 | 1.9% |
| Race | ||
| White | 29 | 55.8% |
| Asian | 17 | 32.7% |
| More than one race | 3 | 5.8% |
| American Indian/Alaska Native | 1 | 1.9% |
| Unknown or Not Reported | 1 | 1.9% |
3.3. Ground Truth
To get reliable ground truth, we collect multiple responses through in-app Ecological Momentary Assessments (EMAs). We push the survey once a week during the 3 weeks after COVID-19 was declared a National Emergency and the social-distance and stay-home policies mandated by local and national governments. We calculate the mean of a student’s response as the ground truth for reducing the potential variance between multiple responses. As previously stated, we are particularly interested in the group that has experienced a large rise in social media usage, which corresponds to a score more than 6 on a 7-point Likert scale. We take a binary split as illustrated by Figure 2. 27 have a mean score equal or higher than 6, indicating more or much more social media usage, while 25 have a mean score lower than 6 out 7, indicating less, normal or just slightly more usage.
Figure 2:
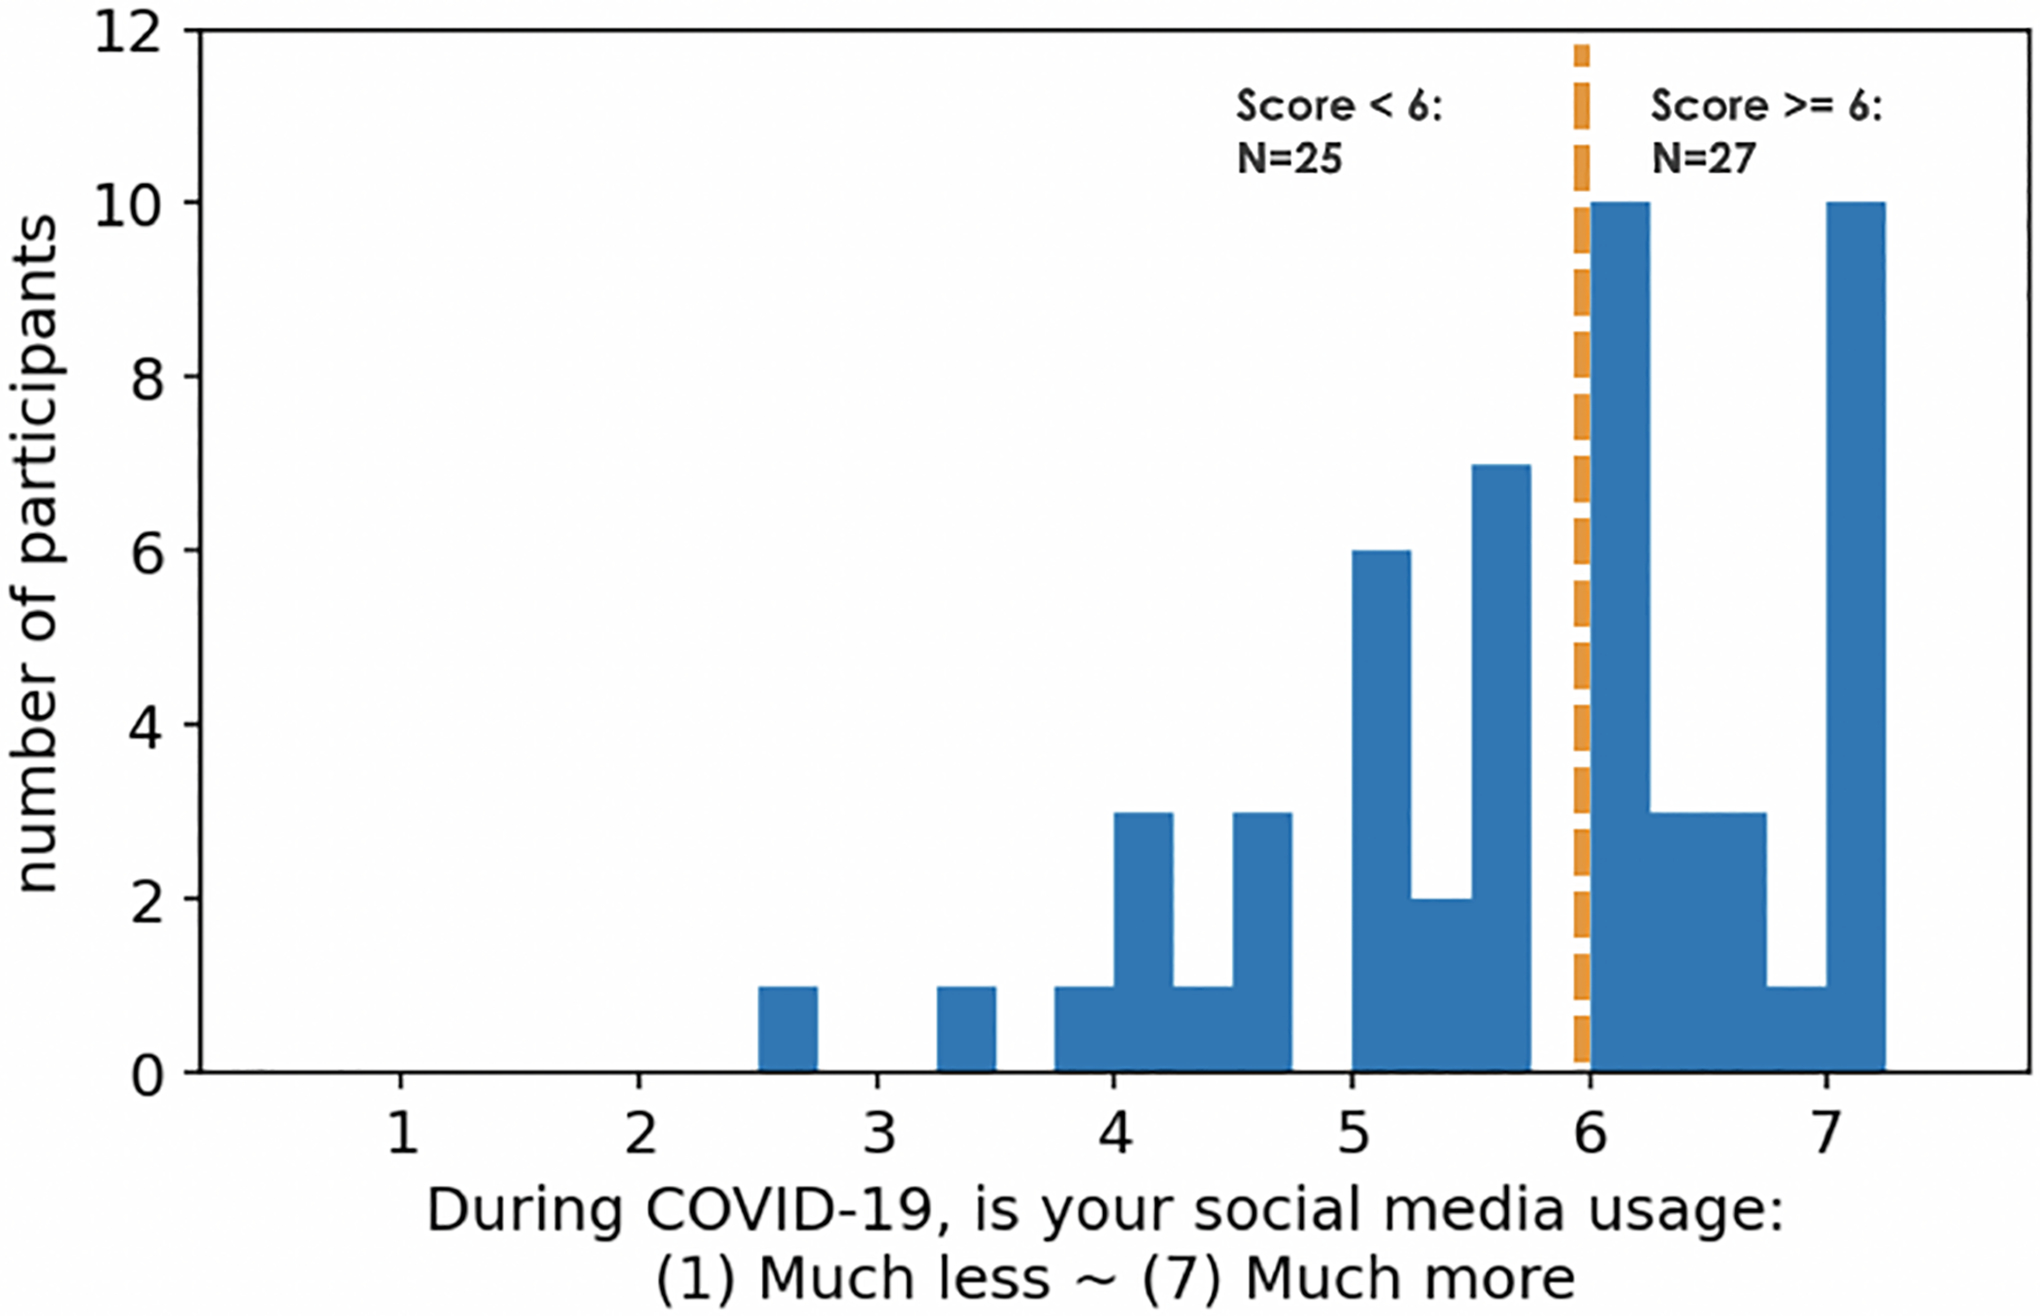
Change in Social media usage. The figure shows change in social media usage reported by the participants. The responses are based on a 7-point Likert based scale. Note that the figure shows the average values reported by each participant.
3.4. Colocation from Mobile Sensing System
Our mobile sensing application runs in the background on both the iOS and Android phones and passively collects the GPS data without user interaction. The app first stores sensing data on the device and uploads the data to our secure server whenever an Internet connection is available. The GPS is sampled every 10 minutes, with the consideration of both energy conservation and data quality.
Colocation refers to the fact that some participants are grouped at one place with a very short distance separating them. As they are situated close to one another, it can serve as a proxy for interaction/isolation detection, and reflects the willingness of one participant to conduct certain activities at the same place during the same time with others. Although it could be argued that physical proximity does not always mean actual interaction, prior research shows striking evidence for the role of physical proximity as a predictor of collaborations at campus life [40], social groups formed through face-to-face interactions [44], or even at inferring friendship with high accuracy (95 percent) [17]. In addition, because we are collecting longitudinal data, it could help us overcome some of the limitations such as occasional factors [16].
We generate weekly on-campus colocation networks using the GPS data from our mobile sensing app. We first cluster raw GPS coordinates using density-based spatial clustering of applications with noise (DBSCAN) [18]. We then consider the centroid of each cluster as a significant location where a participant dwells for a certain amount of time. We term an occurrence as a colocation when two participants are within 15 meters of each other for more than an hour. Note that the number of participants in our study is almost 10% of the total number of students of that particular batch/class at the college. Therefore, for each participant, the likelihood that s/he colocates with others is sampled by looking at whether or not that participant was colocated with 10% of the students of the same class year. Considering that it is difficult for a study to enroll all the members in a community, our sampling approach, although not able to capture the total colocation occurrences, provides a reasonable and novel insight of the on-campus interactions from smartphone sensing in the real world.
Campus life shows a strong day-of-week pattern due to the class schedules. In order to reduce the day-of-week rhythm effect, we aggregate the colocation observations within a week and calculate the number of different people a student has colocated with, based on the following relation:
where represents the number of colocated students of participant i in week w (i.e., the unweighted degree of node i in the colocation network in week w; if there was a colocation among participant i and j during week w, otherwise ; P represents the 52 participants in this study; w is the index of the weeks ranging from 1 to 10. Figure 3 shows the mean of unweighted degrees on each node in the colocation network (i.e., the number of colocated students of each participant) during every week in the term. We can see from the figure that colocation decreases drastically week 9 onward as that is when the first local COVID-19 case was diagnosed near campus. The colocation further decreases in week 10 after the students were asked to leave campus as soon as possible. In order to obtain a pre-COVID-19 colocation network that could act as a baseline representing student’s in-person social interactions, we use the data from week 1 to week 8 in the following analysis.
Figure 3:

colocations at all the places on campus. The curve represents average number of colocated students with the participants. Confidence interval is of 95%.
3.5. Semantic Colocation
The semantics of locations help us to understand the motivation behind physical proximity. Dartmouth College is located in a small town in the United States. Unlike universities in big cities, the institution is located on a self-contained campus, the very place where almost all student activity takes place. On-campus buildings are associated with a primary function, such as classroom, library, gym, cafeteria, social and others. There are almost no multi-functional tall buildings on campus. Therefore, the GPS signal can indicate the type of area the students are in. We use a campus-wide map to label the buildings and areas within buildings. We associate them with meaningful semantics, such as, study areas, classrooms (to understand class attendance), leisure spaces (i.e., cafes, film theaters, lounges), workout areas (i.e., gym, sports areas, outing club), dorms (where students live and sleep), and so on. Note that, we exclude the colocation in study areas caused by two students taking the same course because it is not purely triggered by the willingness of students themselves, i.e., we only take into account the after-class colocation in study areas.
4. CORRELATION ANALYSIS
As we discussed in Section 3.4, we calculate the weekly colocation network at various semantic locations on campus to understand students’ contextual offline interactions. We first calculate the colocation at all areas on campus. After that, we specifically consider five essential areas that depict the different facets of campus life: (1) study area, (2) food and leisure area, (3) Greek houses (i.e., fraternities and sororities where all party events occur), (4) dormitory areas and (5) workout places. Note that computing colocation at all the places on campus does not simply mean adding up the colocation at each of these individual areas as the students could meet same people in different places.
The aim of computing the colocation is to investigate how it relates to the change in social media usage during COVID-19. For each participant, we compute the mean of the degrees from week 1 to 8. The ground truth, as is shown in Figure 2, is not normally distributed. Therefore, we compute Spearman’s correlation. The results are shown in Table 2. We also note the adjusted p-value (by using the Benjamini-Hochberg procedure [4] to regulate the false discovery rate) for the reader’s reference.
Table 2:
Correlation between pre-COVID on-campus colocation and the change in social media usage during COVID-19
| Semantics | Spearman’s r | p-value |
|---|---|---|
| all | 0.24 | 0.08 |
| study | 0.08 | 0.60 |
| food and leisure | 0.14 | 0.35 |
| Greek houses | 0.28 | 0.05* |
| dorm | 0.40 | <0.01 ** |
| gym | 0.28 | 0.05* |
p <= 0.05;
p <= 0.01; bold if FDR-adjusted p <= 0.05
The colocation at all places on campus, which is a proxy for the willingness or likelihood of interactions with other students on all activities, is positively associated with the increase in social media usage during COVID-19 (marginally significant p-value of 0.08). However, there is no correlation between colocation in study areas and food/leisure areas and changes in social media usage. The colocation at Greek houses and gyms, however, positively correlates to the change in social media usage (significant p-value of p=0.05). Especially, the colocation at dorm areas (including the dorm of the participant and the dorm of their friends and schoolmates) shows the strongest positive association with a correlation of 0.4 and a p-value of less than 0.01.
5. PREDICTIVE CLASSIFICATION MODEL FOR CHANGE IN SOCIAL MEDIA USAGE
5.1. Overview of the Classification Problem
In this section, we show how we can predict the change in social media usage during COVID-19 simply from the time series of on-campus colocation during the term. We consider the problem of identifying an increase in social media usage as a binary classification problem. Figure 2 in Section 3.3 shows a meaningful and balanced division; that is, we divide the dataset into two classes: a) those subjects with scores >= 6 (indicating “much more than” or “more than” normal social media usage on the 7-point Likert scale) and b) those with scores < 6 (indicating “slightly more than”, “almost equal to” or “less than normal” usage). Note, for simplicity, we call these two groups group A and group B, respectively. The weekly colocation time series of the two groups are plotted in Figure 4. The blue curve represents the mean of group A whereas the orange curve represents the mean of group B, both with a confidence interval of 95%.
Figure 4:

The comparison of the number of colocated people (i.e., degree) during week 1 to week 8 between two groups (group A: students who report “more than” or “much more” social media usage than normal during COVID-19; group B: students who report “slightly more than”, “similar to” or “less” social media usage than normal). The curve represents the mean within each group with confidence interval of 95%.
The weekly curves show distinguishable patterns for different groups at Greek houses, dorms and gyms which is in accordance with our observations in Section 4. However, the detailed weekly time series give us greater insight into the differences between the two groups at each semantic location and during different phases in the term. At Greek houses and gyms, for example, we see that group A begins with a higher degree at the beginning of the term and subsequently drops to the very bottom right before the mid-term exams. The red bounding boxes on the plots of Greek houses and gym show a sharp increase in group A’s degree during week 5, after the students were relieved from mid-term exams and began to enjoy the transitional winter festival (at the end of the fifth week), whereas such change appears to be less visible on group B. This provides us confidence that for Greek houses and gyms, the slope before and after the mid-term may be an important feature in this classification problem. The colocation in dorms exhibits a different pattern: both groups have a decrease in their degree during the term, with group A experiencing a significantly steeper reduction. This might mean that the slope of colocation at dorms throughout the term could be useful in classification.
5.2. Predictive Method
A key goal of our study is to evaluate how accurate a machine learning model can get at predicting a student’s online social media usage during COVID-19 purely from the offline (or in-person) colocation before the social distancing protocols kicked in. To answer this question, we take two different approaches to build the predictive model: using handcrafted features and using automatically generated features from the time series. In both the approaches, any missing data is first imputed using K Nearest Neighbor algorithm. We perform a 3-fold cross validation to evaluate the generalizability of the model, which basically means that we train the classifier using 67% of the data and perform prediction on the rest 33% of the data for 3 times, with each data point used for validation once. An inner 3-fold cross validation is set during each training session to identify the optimal combination of hyper-parameters in the model. Please keep in mind that each data point in our dataset represents one user’s data. The same person’s data would not be on both the training and testing sets. Finally, the whole process is repeated 5 times using different random seeds to avoid bias from the initial seed selection. We use F1 score (i.e., ) to evaluate the performance which conveys the balance between the precision and the recall.
We describe the two approaches in Table 3. The first approach is a very traditional approach that has been widely used in the community. We handcraft 13 features from the time series according to our observation in Section 5.1. The 13 features include the mean value, the maximum value and the slope on the curve at important semantic locations. We then walk through a series of machine learning algorithms and hyper-parameters, as is shown in Table 4, in order to find the best predictive model. Table 4 shows the performance of each machine learning algorithm. Logistic Regression with L2 regularization performs the best with an F1 score of 0.73.
Table 3:
Features used to build the predictive model. In the final dataset, each participant has one sample with the features listed below and one binary label.
| Approach | Feature |
|---|---|
| handcrafting features from time series | (1) term-average degree @ all places, (2) term-average degree @ Greek houses, (3) term-average degree @ dorm, (4) term-average degree @ gym, (5) max degree @ all places, (6) max degree @ Greek houses, (7) max degree @ dorm, (8) max degree @ gym, (9) slope week 1–4 @ Greek houses, (10) slope week 4–5 @ Greek houses, (11) slope week 1–8 @ dorm, (12) slope week 1–4 @ gym, (13) slope week 4–5 @ gym |
| automatically generating features from time series | For each time series, 20,000 features using 10,000 random kernels generated by ROCKET. |
Table 4:
Machine learning algorithms, hyper-parameters and performance using 13 handcrafted features. We perform a 3-fold cross validation to evaluate the performance of the model. F1 scores are reported.
| Algorithm | Hyper- parameter | Values | F1 |
|---|---|---|---|
| KNN | n_neighbors | 5, 6, 7, 8, 9, 10 | 0.65 |
| Linear SVC | gamma | 0.001, 0.01, 0.1, 1 | 0.71 |
| C | 0.001, 0.01, 0.1, 1, 10, 100 | ||
| SVC (RBF kernel) | gamma | 0.001, 0.01, 0.1, 1 | 0.68 |
| C | 0.001, 0.01, 0.1, 1, 10, 100 | ||
| Logistic Regression (l2) | C | np.logspace(−4, 4, 20) | 0.73 |
| Random Forest | max_depth | 3, 5, 7 | 0.56 |
| n_estimators | range(10,101,10) | ||
| min_samples_split | 3, 5 | ||
| Gradient Boosting Tree | max_depth | 3, 4, 5 | 0.68 |
| subsample | 0.5, 0.6, 0.8, 0.85, 0.9, 0.95, 1.0 | ||
| learning_rate | 0.01, 0.03, 0.05, 0.075, 0.1, 0.2 | ||
| n_estimators | range(10,101,10) | ||
| Neural Network | hidden layers | 1, 2, 3 | 0.71 |
| hidden units | 100, 200, 300 | ||
| dropout rate | 0, 0.25, 0.5 |
In the second approach, we frame the problem as a multivariate time series classification task and use a recently developed technique - Random Convolutional Kernel Transform (ROCKET) - to automatically construct features from weekly colocation data [13]. ROCKET is a unique technique that creates a large number of convolutional kernels at random and extracts two features from each convolution: the maximum value and the proportion of positive values. ROCKET builds on the recent triumphs of Convolutional Neural Networks (CNN) [21], specifically the 1D CNN [36], which are routinely employed over 1D sources like audio and bio-signals.
However, unlike the kernels on deep neural networks which are learned through back propagation [26], the kernels in ROCKET are generated randomly and are not learned, which greatly speeds up the computation of this transformation. ROCKET works well on small datasets where traditional CNNs have hard time to converge. The authors show that simple linear classifiers using random convolutional kernels can achieve state-of-the-art accuracy with very low computational expense [13]. We utilize three separate time series to reflect colocation at Greek houses, dorms, and the gym. The sequence length for the time series is equal to 8 because we have 8 weeks. We use kernels with a length of 2. For each time series, we initialize 10,000 random kernels which lead to 20,000 features at the end (since each kernel will generate 2 features: the maximum value and the proportion of positive values). As suggested by [13], we run simple Logistic Regression on each time series using the 20,000 features, yielding three models. We next stack the probability outputs from these 3 models and train a second Logistic Regression on them, yielding an final F1 score of 0.72. This demonstrates that an autonomous pipeline may achieve comparable performance to handcrafting features from time series for this task.
6. DISCUSSION
6.1. Result Interpretation
The colocation data combined with the semantic meaning of locations help us better understand students’ in-person social interaction prior to COVID-19. Our results indicate that colocation at places such as dormitory, Greek houses and gym are significant indicators to predict change in online social media usage during COVID-19, while colocation at study and food areas are not. Although all these five areas refer to the places that are most visited by the students on campus, they reflect different purposes – students visit each of these places for different reasons, as a result they have different power in capturing the in-person social interactions. In addition, according to Baker and Efstatiou’s [3] research, in some crowded environments where multiple social groups are included, proximity between individuals might not be an indicator of social interaction. For example, “having a chat in a crowded cafe, or interacting with different people during a networking session in a conference, are common situations where proximity may not be sufficient to correctly identify the people involved in an interaction”[3]. This might be a reason why colocations at food and study areas do not contribute as much in our analysis. To be more specific, while we are eating in a crowded restaurant or studying in the library, it is likely that we are quietly sitting there, sometimes surrounded by people we do not know. So even though we sit close to each other and stay in the same place for a long time to finish our meals or assignments, it does not necessarily mean that we have social interactions in these spaces. Greek houses, on the other hand, are where students join communities and take part in social activities. Greek houses on this campus are popular and sponsor all drinking parties on campus multiple nights per week. These events are open to all undergraduates on campus and not just students that are associated with the Greek system. In comparison to study or food places, colocations at these places therefore are likely to be capture real interactions. Similarly, dormitories are where students live, hangout with friends and spend private time. So we could reason that only close and trusted friends are more likely to be invited to visit such places. Gym areas are where sports teams as well as other students train, exercise, share interest and perform social activities together. These might be the reasons why these three semantic locations stand out in the correlation analysis.
6.2. Implications for Social Computing and HCI Design
The computational methods discussed in the paper augment current methods to improve understanding of social media usage. Our approach highlights the importance of linking the change in online social media usage to individuals’ in-person social behavior in semantic locations. People’s lives changed considerably adhering to the “Stay Safe, Stay Home” policies at the college, local, and national levels. It is important to know in advance who will be more relying on social media so that developers can adapt their tools to better serve the user if certain scenarios reoccur in the future. For example, social networking companies can better target users and provide more accurate information or suggestions if knowing the need in advance. In addition, researchers in social science may find the results interesting because it reveals the connection between virtual and in-person interactions, especially under the COVID-19 circumstance. Our prediction also suggests the benefit of using ROCKET, which could relieve researchers from handcrafting features based on different locations and time series, while achieving similar performance on this task. This also implies that researchers can include their own multi-model time series and ensemble them before generating the final output. We anticipate that this colocation-based classifier will be integrated into other prediction models produced by organizations such as social networking in order to better target and assist certain individuals when in-person social activities are constrained due to non-subjective factors.
6.3. Privacy and Ethical Considerations
Given the greater ethical and privacy concerns in this field, the exploitation of passive sensing technologies could result in major problems. We have taken great effort to protect the privacy of our participants. According to the IRB’s requirements, we organize two teams: a technology team that solely collects data without knowing the identity of the participants, and an enrollment team that assists with recruiting and communicates with students without access to raw data. In addition, all the sensing data is decoupled from demographic data and is associated with only a random study ID. All the GPS data are transferred from the phones to our secure backend server through encrypted network protocols. Furthermore, we mask the identifiable raw GPS colocation occurrence with semantics (i.e., type of locations such as study area, gym, dorm, etc.) for the purposes of data sharing among research teams.
6.4. Limitations
One concern in our study is that the sample size. As a result, there might be doubts regarding how the small N can represent the complete community and their in-person social interactions in its entirety. However, the campus in our study is a small community with around 1000 freshmen enrolled each year, and we recruit 100+ students as participants in our study, which in theory would sample 10% of the colocation. During the sophomore year, roughly half of the students would study abroad which makes our N=52 still samples close to 10% on-campus colocation. Although not perfect, a similar sampling approach can also be seen in some other research [6, 61], where authors do not recruit the complete student body in the whole community, but the colocation model built still has good performance. These prior results inspired us and we think the same method could be effective to explain the sample size representation to the whole community.
Next, the ground truth, aka the change in social media usage, is self-reported and prone to subjectiveness and recall bias. The optimal approach, of course, is to acquire this information directly from the smartphone. However, while Android allows us to monitor ongoing processes, iOS is somewhat restricted, and there is no way to access the utilization of other apps on the phone. Because the vast majority of our participants use iOS, passively gathering this information is impossible. It’s worth noting that an app can undoubtedly tell when it’s operating. As a result, we believe that if any social media business wants to validate this study, they can easily test it using GPS data and app activity acquired from users.
Finally, the result in this study derives from a college in a small college town; the location features computed in our system may not apply to other campuses in big cities where the semantics are more complex and cross-campus interactions are more frequent. We suggest researchers run the model on their own data, which could be collected in even different types of settings such as companies, residential communities, hospitals or age care facilities to examine the replicability of this interesting finding.
7. CONCLUSION
In this paper, we study the impact of the advent of COVID-19 on changes in social interaction behavior of undergraduate students as they move from college to learning from home. We compute colocation based on data collected from GPS sensors to capture the long-term in-person physical proximity of students before COVID-19. We then try to predict the change in students’ online social media usage during COVID-19 based on the computed colocation data. First, we find that even though the average online media usage are significantly increased during COVID-19, not everyone experiences the same level of change. Students can be divided into two groups: one group experiences a large increase in social media usage during COVID-19, while the other group experiences a slight increase or no change at all in online social media usage during COVID-19. To better understand the differences between these groups, we analyze the students’ in-person social activities before COVID-19, which refers to the first 8 weeks of the Winter term. We construct their social network with their physical proximity data obtained from GPS combined with the semantic locations. This allows us to dynamically depict their in-person social interactions. We find that three semantic locations are important features to later predict change in students’ online social media usage. These three locations are the dormitory area, gym area and Greek houses (where all party events occur). Students who have more connections with these three places before COVID-19 are more likely to experience a significant increase in online media usage during COVID-19. The machine learning algorithm achieved an F1 score of 0.73 simply by using the features derived from the colocation time series at these three semantic locations.
CCS CONCEPTS.
• Applied computing → Sociology; • Human-centered computing → Ubiquitous and mobile computing design and evaluation methods.
ACKNOWLEDGMENTS
This work was supported by NIMH 5R01MH059282-14.
Footnotes
The number of edges that are incident to the node in a graph [14]. Here each node represents a participant and an edge happens if two participants are colocated. Furthermore, the degree represents the number of colocated students of one participant in the graph.
Contributor Information
Weichen Wang, Dartmouth College, Hanover, NH, USA.
Jialing Wu, Dartmouth College, Hanover, NH, USA.
Subigya Nepal, Dartmouth College, Hanover, NH, USA.
Alex daSilva, Dartmouth College, Hanover, NH, USA.
Elin Hedlund, Dartmouth College, Hanover, NH, USA.
Eilis Murphy, Dartmouth College, Hanover, NH, USA.
Courtney Rogers, Dartmouth College, Hanover, NH, USA.
Jeremy Huckins, Dartmouth College, Hanover, NH, USA.
REFERENCES
- [1].Amershi Saleema and Morris Meredith Ringel. 2009. Co-located collaborative web search: understanding status quo practices. In CHI’09 Extended Abstracts on Human Factors in Computing Systems. 3637–3642. [Google Scholar]
- [2].Argyle Michael. 2017. Social interaction: process and products. Routledge. [Google Scholar]
- [3].Baker Jon and Efstratiou Christos. 2017. Next2me: Capturing social interactions through smartphone devices using wifi and audio signals. In Proceedings of the 14th EAI International Conference on Mobile and Ubiquitous Systems: Computing, Networking and Services. 412–421. [Google Scholar]
- [4].Benjamini Yoav and Hochberg Yosef. 1995. Controlling the false discovery rate: a practical and powerful approach to multiple testing. Journal of the Royal statistical society: series B (Methodological) 57, 1 (1995), 289–300. [Google Scholar]
- [5].Bloom Nicholas, Liang James, Roberts John, and Ying Zhichun Jenny. 2015. Does working from home work? Evidence from a Chinese experiment. The Quarterly Journal of Economics 130, 1 (2015), 165–218. [Google Scholar]
- [6].Boonstra Tjeerd W, Larsen Mark E, Townsend Samuel, and Christensen Helen. 2017. Validation of a smartphone app to map social networks of proximity. PloS one 12, 12 (2017). [DOI] [PMC free article] [PubMed] [Google Scholar]
- [7].Boukhechba Mehdi, Chow Philip, Fua Karl, Teachman Bethany A, and Barnes Laura E. 2018. Predicting social anxiety from global positioning system traces of college students: feasibility study. JMIR mental health 5, 3 (2018), e10101. [DOI] [PMC free article] [PubMed] [Google Scholar]
- [8].Boukhechba Mehdi, Huang Yu, Chow Philip, Fua Karl, Teachman Bethany A, and Barnes Laura E. 2017. Monitoring social anxiety from mobility and communication patterns. In Proceedings of the 2017 ACM International Joint Conference on Pervasive and Ubiquitous Computing and Proceedings of the 2017 ACM International Symposium on Wearable Computers. 749–753. [Google Scholar]
- [9].Brown Chloë, Lathia Neal, Mascolo Cecilia, Noulas Anastasios, and Blondel Vincent. 2014. Group colocation behavior in technological social networks. PloS one 9, 8 (2014). [DOI] [PMC free article] [PubMed] [Google Scholar]
- [10].Buchner Karolina, Lissermann Roman, and Holmquist Lars Erik. 2014. Interaction techniques for co-located collaborative TV. In CHI’14 Extended Abstracts on Human Factors in Computing Systems. 1819–1824. [Google Scholar]
- [11].Canzian Luca and Musolesi Mirco. 2015. Trajectories of depression: unobtrusive monitoring of depressive states by means of smartphone mobility traces analysis. In Proceedings of the 2015 ACM international joint conference on pervasive and ubiquitous computing. 1293–1304. [Google Scholar]
- [12].De Choudhury Munmun, Kumar Mrinal, and Weber Ingmar. 2017. Computational approaches toward integrating quantified self sensing and social media. In Proceedings of the 2017 ACM Conference on Computer Supported Cooperative Work and Social Computing. 1334–1349. [DOI] [PMC free article] [PubMed] [Google Scholar]
- [13].Dempster Angus, Petitjean François, and Webb Geoffrey I. 2019. ROCKET: Exceptionally fast and accurate time series classification using random convolutional kernels. arXiv preprint arXiv:1910.13051 (2019). [Google Scholar]
- [14].Diestel Reinhard. 2005. Graph theory 3rd ed. Graduate texts in mathematics 173 (2005). [Google Scholar]
- [15].Dingel Jonathan I and Neiman Brent. 2020. How many jobs can be done at home? Technical Report. National Bureau of Economic Research. [Google Scholar]
- [16].Do Trinh Minh Tri and Gatica-Perez Daniel. 2013. Human interaction discovery in smartphone proximity networks. Personal and Ubiquitous Computing 17, 3 (2013), 413–431. [Google Scholar]
- [17].Eagle Nathan, Pentland Alex Sandy, and Lazer David. 2009. Inferring friendship network structure by using mobile phone data. Proceedings of the national academy of sciences 106, 36 (2009), 15274–15278. [DOI] [PMC free article] [PubMed] [Google Scholar]
- [18].Ester Martin, Kriegel Hans-Peter, Sander Jörg, Xu Xiaowei, et al. 1996. A density-based algorithm for discovering clusters in large spatial databases with noise.. In Kdd, Vol. 96. 226–231. [Google Scholar]
- [19].Felzensztein Christian, Gimmon Eli, and Carter Sara. 2010. Geographical co-location, social networks and inter-firm marketing co-operation: the case of the salmon industry. Long Range Planning 43, 5–6 (2010), 675–690. [Google Scholar]
- [20].Franks Patricia C and Oliver Gillian C. 2012. Experiential learning and international collaboration opportunities: virtual internships. Library review (2012). [Google Scholar]
- [21].Goodfellow Ian, Bengio Yoshua, and Courville Aaron. 2016. Deep Learning. MIT Press. http://www.deeplearningbook.org. [Google Scholar]
- [22].Grinberg Nir, Kalyanaraman Shankar, Adamic Lada A, and Naaman Mor. 2017. Understanding feedback expectations on Facebook. In Proceedings of the 2017 ACM Conference on Computer Supported Cooperative Work and Social Computing. 726–739. [Google Scholar]
- [23].Gudykunst William B, Ting-Toomey Stella, and Chua Elizabeth. 1988. Culture and interpersonal communication. Sage Publications, Inc. [Google Scholar]
- [24].Hammer Jon C and Yan Tingxin. 2014. Exploiting usage statistics for energy-efficient logical status inference on mobile phones. In Proceedings of the 2014 ACM International Symposium on Wearable Computers. 35–42. [Google Scholar]
- [25].Harari Gabriella M, Müller Sandrine R, Stachl Clemens, Wang Rui, Wang Weichen, Bühner Markus, Rentfrow Peter J, Campbell Andrew T, and Gosling Samuel D. 2019. Sensing sociability: Individual differences in young adults’ conversation, calling, texting, and app use behaviors in daily life. Journal of personality and social psychology (2019). [DOI] [PubMed] [Google Scholar]
- [26].Hecht-Nielsen Robert. 1992. Theory of the backpropagation neural network. In Neural networks for perception. Elsevier, 65–93. [Google Scholar]
- [27].Homans George C. 1958. Social behavior as exchange. American journal of sociology 63, 6 (1958), 597–606. [Google Scholar]
- [28].Huang Yu, Xiong Haoyi, Leach Kevin, Zhang Yuyan, Chow Philip, Fua Karl, Teachman Bethany A, and Barnes Laura E. 2016. Assessing social anxiety using GPS trajectories and point-of-interest data. In Proceedings of the 2016 ACM International Joint Conference on Pervasive and Ubiquitous Computing. 898–903. [Google Scholar]
- [29].Huckins Jeremy F, daSilva Alex W, Wang Rui, Wang Weichen, Hedlund Elin L, Murphy Eilis I, Lopez Richard B, Rogers Courtney, Holtzheimer Paul E, Kelley William M, et al. 2019. Fusing mobile phone sensing and brain imaging to assess depression in college students. Frontiers in Neuroscience 13 (2019), 248. [DOI] [PMC free article] [PubMed] [Google Scholar]
- [30].Huckins Jeremy F, DaSilva Alex W, Wang Weichen, Hedlund Elin, Rogers Courtney, Nepal Subigya K, Wu Jialing, Obuchi Mikio, Murphy Eilis I, Meyer Meghan L, et al. 2020. Mental health and behavior of college students during the early phases of the COVID-19 pandemic: Longitudinal smartphone and ecological momentary assessment study. Journal of medical Internet research 22, 6 (2020), e20185. [DOI] [PMC free article] [PubMed] [Google Scholar]
- [31].Hughes David John, Rowe Moss, Batey Mark, and Lee Andrew. 2012. A tale of two sites: Twitter vs. Facebook and the personality predictors of social media usage. Computers in Human Behavior 28, 2 (2012), 561–569. [Google Scholar]
- [32].Huh Jina. 2015. Clinical questions in online health communities: the case of” See your doctor” threads. In Proceedings of the 18th ACM Conference on Computer Supported Cooperative Work & Social Computing. 1488–1499. [DOI] [PMC free article] [PubMed] [Google Scholar]
- [33].Ilarri Sergio, Mena Eduardo, Sheth Amit, et al. 2011. Semantics in location-based services. IEEE Internet Computing 6 (2011), 10–14. [Google Scholar]
- [34].Kappen Dennis L, Gregory John, Stepchenko Daniel, Wehbe Rina R, and Nacke Lennart E. 2013. Exploring social interaction in co-located multiplayer games. In CHI’13 Extended Abstracts on Human Factors in Computing Systems. 1119–1124. [Google Scholar]
- [35].Khan Shereen, Gagné Monique, Yang Leigh, and Shapka Jennifer. 2016. Exploring the relationship between adolescents’ self-concept and their offline and online social worlds. Computers in Human Behavior 55 (2016), 940–945. [Google Scholar]
- [36].Kiranyaz Serkan, Ince Turker, Hamila Ridha, and Gabbouj Moncef. 2015. Convolutional neural networks for patient-specific ECG classification. In 2015 37th Annual International Conference of the IEEE Engineering in Medicine and Biology Society (EMBC). IEEE, 2608–2611. [DOI] [PubMed] [Google Scholar]
- [37].Kirk David S, Sellen Abigail, and Cao Xiang. 2010. Home video communication: mediating’closeness’. In Proceedings of the 2010 ACM conference on Computer supported cooperative work. 135–144. [Google Scholar]
- [38].Koehne Benjamin, Shih Patrick C, and Olson Judith S. 2012. Remote and alone: coping with being the remote member on the team. In Proceedings of the ACM 2012 conference on Computer Supported Cooperative Work. 1257–1266. [Google Scholar]
- [39].Kuss Daria J and Griffiths Mark D. 2017. Social networking sites and addiction: Ten lessons learned. International journal of environmental research and public health 14, 3 (2017), 311. [DOI] [PMC free article] [PubMed] [Google Scholar]
- [40].Lee Kyungjoon, Brownstein John S, Mills Richard G, and Kohane Isaac S. 2010. Does collocation inform the impact of collaboration? PloS one 5, 12 (2010). [DOI] [PMC free article] [PubMed] [Google Scholar]
- [41].Lewnard Joseph A and Lo Nathan C. 2020. Scientific and ethical basis for social-distancing interventions against COVID-19. The Lancet. Infectious diseases (2020). [DOI] [PMC free article] [PubMed] [Google Scholar]
- [42].LiKamWa Robert, Liu Yunxin, Lane Nicholas D, and Zhong Lin. 2013. Moodscope: Building a mood sensor from smartphone usage patterns. In Proceeding of the 11th annual international conference on Mobile systems, applications, and services. 389–402. [Google Scholar]
- [43].Liu Jiaxin, Weitzman Elissa R, and Chunara Rumi. 2017. Assessing behavior stage progression from social media data. In Proceedings of the 2017 ACM Conference on Computer Supported Cooperative Work and Social Computing. 1320–1333. [DOI] [PMC free article] [PubMed] [Google Scholar]
- [44].Mardenfeld Steve, Boston Daniel, Pan Susan Juan, Jones Quentin, Iamntichi Adriana, and Borcea Cristian. 2010. Gdc: Group discovery using co-location traces. In 2010 IEEE Second International Conference on Social Computing. IEEE, 641–648. [Google Scholar]
- [45].Mehrotra Abhinav, Hendley Robert, and Musolesi Mirco. 2016. Towards multi-modal anticipatory monitoring of depressive states through the analysis of human-smartphone interaction. In Proceedings of the 2016 ACM International Joint Conference on Pervasive and Ubiquitous Computing: Adjunct. 1132–1138. [Google Scholar]
- [46].Mønsted Bjarke, Mollgaard Anders, and Mathiesen Joachim. 2018. Phone-based metric as a predictor for basic personality traits. Journal of Research in Personality 74 (2018), 16–22. [Google Scholar]
- [47].Obuchi Mikio, Huckins Jeremy F, Wang Weichen, daSilva Alex, Rogers Courtney, Murphy Eilis, Hedlund Elin, Holtzheimer Paul, Mirjafari Shayan, and Campbell Andrew. 2020. Predicting Brain Functional Connectivity Using Mobile Sensing. Proceedings of the ACM on Interactive, Mobile, Wearable and Ubiquitous Technologies 4, 1 (2020), 1–22. [DOI] [PMC free article] [PubMed] [Google Scholar]
- [48].O’Leary Kathleen, Bhattacharya Arpita, Munson Sean A, Wobbrock Jacob O, and Pratt Wanda. 2017. Design opportunities for mental health peer support technologies. In Proceedings of the 2017 ACM conference on computer supported cooperative work and social computing. 1470–1484. [Google Scholar]
- [49].Perrin Andrew. 2015. Social media usage. Pew research center (2015), 52–68. [Google Scholar]
- [50].Przybylski Andrew K, Murayama Kou, DeHaan Cody R, and Gladwell Valerie. 2013. Motivational, emotional, and behavioral correlates of fear of missing out. Computers in Human Behavior 29, 4 (2013), 1841–1848. [Google Scholar]
- [51].Rabbi Mashfiqui and Ahmed Syed Ishtiaque. 2014. Sensing stress network for social coping. In Proceedings of the companion publication of the 17th ACM conference on Computer supported cooperative work & social computing. 225–228. [Google Scholar]
- [52].Reitmaier Thomas, Benz Pierre, and Marsden Gary. 2013. Designing and theorizing co-located interactions. In Proceedings of the SIGCHI Conference on Human Factors in Computing Systems. 381–390. [Google Scholar]
- [53].Rennie Frank and Morrison Tara. 2013. E-learning and social networking handbook: Resources for higher education. Routledge. [Google Scholar]
- [54].Robinson Gene E, Fernald Russell D, and Clayton David F. 2008. Genes and social behavior. science 322, 5903 (2008), 896–900. [DOI] [PMC free article] [PubMed] [Google Scholar]
- [55].Saeb Sohrab, Lattie Emily G, Kording Konrad P, and Mohr David C. 2017. Mobile phone detection of semantic location and its relationship to depression and anxiety. JMIR mHealth and uHealth 5, 8 (2017), e112. [DOI] [PMC free article] [PubMed] [Google Scholar]
- [56].Saeb Sohrab, Lattie Emily G, Schueller Stephen M, Kording Konrad P, and Mohr David C. 2016. The relationship between mobile phone location sensor data and depressive symptom severity. PeerJ 4 (2016), e2537. [DOI] [PMC free article] [PubMed] [Google Scholar]
- [57].Sandstrom Gillian M, Lathia Neal, Mascolo Cecilia, and Rentfrow Peter J. 2017. Putting mood in context: Using smartphones to examine how people feel in different locations. Journal of Research in Personality 69 (2017), 96–101. [Google Scholar]
- [58].Scholand Andrew J, Tausczik Yla R, and Pennebaker James W. 2010. Social language network analysis. In Proceedings of the 2010 ACM conference on Computer supported cooperative work. 23–26. [Google Scholar]
- [59].Stollak Matthew J, Vandenberg Amy, Burklund Andie, and Weiss Stephanie. 2011. Getting social: The impact of social networking usage on grades among college students. In Proceedings from ASBBS annual conference, Vol. 18. 859–865. [Google Scholar]
- [60].Stopczynski Arkadiusz, Lehmann Sune, et al. 2018. How physical proximity shapes complex social networks. Scientific reports 8, 1 (2018), 1–10. [DOI] [PMC free article] [PubMed] [Google Scholar]
- [61].Stopczynski Arkadiusz, Sekara Vedran, Sapiezynski Piotr, Cuttone Andrea, Madsen Mette My, Larsen Jakob Eg, and Lehmann Sune. 2014. Measuring large-scale social networks with high resolution. PloS one 9, 4 (2014). [DOI] [PMC free article] [PubMed] [Google Scholar]
- [62].Tang Charlotte and Carpendale Sheelagh. 2008. Evaluating the deployment of a mobile technology in a hospital ward. In Proceedings of the 2008 ACM conference on Computer supported cooperative work. 205–214. [Google Scholar]
- [63].Tausch Sarah, Ta Stephanie, and Hussmann Heinrich. 2016. A Comparison of Cooperative and Competitive Visualizations for Co-Located Collaboration. In Proceedings of the 2016 CHI Conference on Human Factors in Computing Systems (San Jose, California, USA) (CHI ‘16). Association for Computing Machinery, New York, NY, USA, 5034–5039. 10.1145/2858036.2858072 [DOI] [Google Scholar]
- [64].Thom-Santelli Jennifer, Millen David R, and Gergle Darren. 2011. Organizational acculturation and social networking. In Proceedings of the ACM 2011 conference on Computer supported cooperative work. 313–316. [Google Scholar]
- [65].Twenge Jean M, Joiner Thomas E, Rogers Megan L, and Martin Gabrielle N. 2018. Increases in depressive symptoms, suicide-related outcomes, and suicide rates among US adolescents after 2010 and links to increased new media screen time. Clinical Psychological Science 6, 1 (2018), 3–17. [Google Scholar]
- [66].Umbelino Gustavo, Ta Vivian, Blake Samuel, Truong Eric, Luo Amy, and Dow Steven. 2019. ProtoTeams: Supporting Small Group Interactions in Co-Located Crowds. In Conference Companion Publication of the 2019 on Computer Supported Cooperative Work and Social Computing. 392–397. [Google Scholar]
- [67].Wang Rui, Chen Fanglin, Chen Zhenyu, Li Tianxing, Harari Gabriella, Tignor Stefanie, Zhou Xia, Ben-Zeev Dror, and Campbell Andrew T. 2014. StudentLife: assessing mental health, academic performance and behavioral trends of college students using smartphones. In Proceedings of the 2014 ACM international joint conference on pervasive and ubiquitous computing. 3–14. [Google Scholar]
- [68].Wang Rui, Wang Weichen, daSilva Alex, Huckins Jeremy F, Kelley William M, Heatherton Todd F, and Campbell Andrew T. 2018. Tracking depression dynamics in college students using mobile phone and wearable sensing. Proceedings of the ACM on Interactive, Mobile, Wearable and Ubiquitous Technologies 2, 1 (2018), 1–26. [Google Scholar]
- [69].Wang Weichen, Harari Gabriella M, Wang Rui, Müller Sandrine R, Mirjafari Shayan, Masaba Kizito, and Campbell Andrew T. 2018. Sensing behavioral change over time: Using within-person variability features from mobile sensing to predict personality traits. Proceedings of the ACM on Interactive, Mobile, Wearable and Ubiquitous Technologies 2, 3 (2018), 1–21. [Google Scholar]
- [70].Wang Weichen, Mirjafari Shayan, Harari Gabriella, Ben-Zeev Dror, Brian Rachel, Choudhury Tanzeem, Hauser Marta, Kane John, Masaba Kizito, Nepal Subigya, et al. 2020. Social Sensing: Assessing Social Functioning of Patients Living with Schizophrenia using Mobile Phone Sensing. In Proceedings of the 2020 CHI Conference on Human Factors in Computing Systems. 1–15. [Google Scholar]
- [71].Weiler Michael, Schmid Klaus Arthur, Mamoulis Nikos, and Renz Matthias. 2015. Geo-social co-location mining. In Second International ACM Workshop on Managing and Mining Enriched Geo-Spatial Data. 19–24. [Google Scholar]
- [72].Wells Thomas and Houben Steven. 2020. CollabAR–Investigating the Mediating Role of Mobile AR Interfaces on Co-Located Group Collaboration. In Proceedings of the 2020 CHI Conference on Human Factors in Computing Systems. 1–13. [Google Scholar]